
Abstract
Capacitively coupled radio frequency plasmas operated in an electronegative gas (CF4) and driven by voltage waveforms composed of four consecutive harmonics are investigated for different fundamental driving frequencies using PIC/MCC simulations and an analytical model. As has been observed previously for electropositive gases, the application of peak-shaped waveforms (that are characterized by a strong amplitude asymmetry) results in the development of a DC self-bias due to the electrical asymmetry effect (EAE), which increases the energy of ions arriving at the powered electrode. In contrast to the electropositive case (Korolov et al 2012 J. Phys. D: Appl. Phys. 45 465202) the absolute value of the DC self-bias is found to increase as the fundamental frequency is reduced in this electronegative discharge, providing an increased range over which the DC self-bias can be controlled. The analytical model reveals that this increased DC self-bias is caused by changes in the spatial profile and the mean value of the net charge density in the grounded electrode sheath. The spatio-temporally resolved simulation data show that as the frequency is reduced the grounded electrode sheath region becomes electronegative. The presence of negative ions in this sheath leads to very different dynamics of the power absorption of electrons, which in turn enhances the local electronegativity and plasma density via ionization and attachment processes. The ion flux to the grounded electrode (where the ion energy is lowest) can be up to twice that to the powered electrode. At the same time, while the mean ion energies at both electrodes are quite different, their ratio remains approximately constant for all base frequencies studied here.
Export citation and abstract BibTeX RIS

Original content from this work may be used under the terms of the Creative Commons Attribution 3.0 licence. Any further distribution of this work must maintain attribution to the author(s) and the title of the work, journal citation and DOI.
1. Introduction
Plasmas have been used for various surface processing applications for many decades [1, 2]. In particular, the selective and anisotropic etching of semiconductors as well as the deposition of functional coatings on large area substrates are performed in capacitively coupled radio frequency (CCRF) plasmas. These plasma systems are subject of continuous research, as the technological demands are rising [2]. In most cases, a combination of many feed gases with a complex plasma chemistry is used. Accordingly, many different species of positive ions, negative ions, neutral radicals, and electrons can be found in the plasma volume.
The plasma chemistry is driven by energetic electrons, which transfer energy to the neutral background gas in collisions. These electrons, in turn, gain energy via their interaction with the RF electric field. The electron power absorption dynamics, therefore, varies strongly in space and time. Low-pressure electropositive plasmas typically operate in the α-mode, i.e. they are sustained by the energy gain of plasma electrons in the oscillating sheath regions adjacent to the surfaces [3–17]. At the times of sheath expansion within the RF period, electrons are accelerated towards the quasineutral plasma bulk. In certain situations, the sheath electric field locally reverses its sign and accelerates electrons towards the surface during the phase of sheath collapse [5–9, 18–20]. This mechanism of power absorption by electrons is present, when the sheath collapse is fast and/or the electron mobility is reduced, e.g. by frequent collisions with the background gas and especially with molecular gases. In the DA (drift ambipolar) mode [4, 15–17, 21–27], a very similar mechanism occurs typically in the plasma bulk. Here, the RF conductivity is reduced by frequent collisions of electrons with neutrals at high pressures of molecular gases and/or by the presence of attachment processes resulting in the formation of negative ions, causing a depletion of the electron density. Therefore, a relatively strong electric field must develop to ensure the continuity of the current through the plasma. This is particularly important in electronegative plasmas operated at low radio frequencies, as the electronegativity is typically high under such conditions [21]. The group of Makabe et al showed in their pioneering spatio-temporally resolved investigations of low RF single-frequency SF6 plasmas, that the presence of negative ions in the sheath region strongly affects the electric field and electron heating dynamics [21]. In addition, secondary electrons, which are released from the surfaces mainly by the impact of positive ions, gain high energies in the sheath regions and may significantly affect or even dominate the total ionization leading to the so-called γ-mode [3, 4, 6–8, 21]. Similarly, electron-impact induced detachment of electrons in regions of strong electric fields may play a role in electronegative plasmas [6]. Thus, various mechanisms contribute to the electron power absorption dynamics, depending on the spatial dimensions, gas composition, pressure, and the externally applied voltage.
Single-frequency CCRF plasmas have the simplest electrical design. However, it is not possible to control the energy of the ions impinging on the surfaces independently of the total ion flux in such systems [28]. This control, which is most important for applications, can be achieved by driving the plasma with multiple frequencies. The class of multi-frequency plasmas can be divided into classical dual-frequency plasmas [29–34], which are operated by applying two or more significantly different frequencies, and plasmas driven by (consecutive) harmonics of a base frequency [20, 24, 35–54]. In the latter case, the shape of the applied voltage waveform can be tuned by varying the harmonics' amplitudes and phases. Using this approach of voltage waveform tailoring (VWT) allows for control of the discharge symmetry by modifying the symmetry of the voltage waveform. Both asymmetry of the amplitude [20, 24, 35–45, 54], when the absolute value of the minimum voltage differs from the maximum voltage, as well as asymmetry of the rising and falling slopes [51–53] can be realized. Many studies over recent years have shown, that this electrical asymmetry effect (EAE) offers great opportunites to control the spatial profiles of the electric potential (including the DC self-bias) and the charged particle generation by altering the electron and ion acceleration dynamics [20, 24, 37, 39, 40, 42, 44, 45, 51–54]. Notably, the mean ion energy and the shape of the ion flux-energy distribution function at the surface can be changed without affecting the total ion flux [35–37, 41, 43, 44, 55]. Thus, surface processing applications can be optimized based on these advanced control opportunities [46–49].
Many aspects of these phenomena have been investigated in great detail in previous studies. However, almost all of these studies have been performed at a base frequency of 13.56 MHz, while the base frequency can be chosen within a wide band. At high frequencies, the plasma uniformity can be compromised by electromagnetic effects, although it has been shown that the non-uniformity is greatly reduced via the EAE at high frequencies [50]. Korolov et al found that the range over which the DC self-bias can be controlled is reduced at lower base frequencies in electropositive plasmas [54]. Until now, the effect of the base frequency on the discharge symmetry in electronegative plasmas, where the electron and ion dynamics are very different from the electropositive case, has not been studied. Some initial experimental results have suggested that the control range of the DC self-bias is enlarged by choosing a lower base frequency of 5.50 MHz compared to 13.56 MHz [56, 57], but the reason for this effect was not explained.
Here, we present a systematic investigation of the dependence of the efficiency of the EAE on the base frequency in electronegative CF4 plasmas via PIC/MCC simulations. Plasmas in CF4 are of high relevance for technological applications, as dielectrics such as SiO2 are commonly etched in semiconductor manufacturing by plasma processing, using CF4 with admixtures of O2 and Ar [58–60]. In this work we show that, in contrast to electropositive plasmas, the symmetry control via the EAE is significantly enhanced by choosing lower base frequencies. This is an extremely important finding, since it shows that in many reactive gas mixtures used in processing applications, lower base frequencies should yield more control of process performance based on the EAE due to an improved control of the ion flux-energy distributions at the surfaces via VWT. The physical mechanisms will be discussed based on an analytical model and related to the frequency dependence of electronegative single-frequency CCRF plasmas.
The paper is structured in the following way: in the next section both the simulation and model approaches are described. The results are discussed in section 3, which is divided into three parts. First, the effect of the base frequency on the control of the DC self-bias and discharge symmetry is presented. Second, the low-frequency case is studied in detail to examine the differences from the 13.56 MHz reference case. Third, the ion flux-energy distribution functions (IDFs) obtained from the simulations are discussed. Finally, conclusions are drawn in section 4.
2. Simulation and model
2.1. PIC/MCC simulation
Our numerical studies are based on a particle-in-cell simulation code, which includes a Monte Carlo treatment of collision processes (PIC/MCC) [62–64]. The reactor geometry is simplified by assuming two plane and parallel electrodes. Accordingly, only one spatial coordinate needs to be resolved, while all components of the velocity space are resolved. The CF4 plasma is created and sustained in a d = 2.5 cm wide gap between the two electrodes by applying a voltage waveform consisting of four consecutive harmonics,
to one of the electrodes, whereas the other electrode is kept at ground potential. Here,  is the amplitude of the voltage waveform and f0 is the base frequency, which is varied between 2.86 MHz and 13.56 MHz. The amplitude factor for each harmonic in the equation above maximizes the electrical DC self-bias control range in multi-frequency plasmas [41, 42]. Here, we keep the voltage amplitude constant at
  V, so that the applied voltage waveform (see figure 1) exhibits a maximum of 240 V, a minimum of −60 V, and, accordingly, a peak-to-peak voltage of 300 V. The feasability of the impedance matching of such multi-frequency voltage waveforms has been demonstrated recently [61].
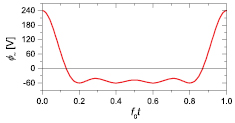
Figure 1. Applied voltage waveform.
Download figure:
Standard image High-resolution imageAlthough the discharge configuration is geometrically symmetric, a DC self-bias, η, develops due to the asymmetry of the applied voltage waveform [35, 37, 39, 41–45, 54]. Note that we keep the phases of all harmonics at  . This phase combination is known to yield the largest absolute value of the DC self-bias [41–43]. The sign of η can be reversed by tuning the phases of the applied harmonics [41, 43]. To ensure equal losses of positive and negative charges at each of the two electrodes on time average in the simulation, the DC self-bias is adjusted in an iterative manner. In this way, the realistic situation of an experimental setup is simulated, where a blocking capacitor in the matching unit prevents any DC current in steady state.
In the simulation, the charged species CF , CF
, CF , F−, and electrons are traced. We use the cross section data provided by [65] for e−–CF4 collision processes, with the exception of electron attachment processes (producing CF
 and F−ions), which are adopted from [66]. A table with all electron impact collision processes considered in the model can be found in [45]. Their energy dependent cross sections are displayed in figure 2. To simplify and speed up the calculations, the processes that create radicals or ion species other than CF
 , CF
, CF , F− are included in the set of electron collisions, but the collision products are not considered further.
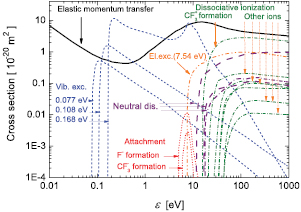
Figure 2. Cross sections of electron-impact collision processes included in the simulation. The corresponding references for the cross sections are discussed in the text.
Download figure:
Standard image High-resolution imageReactive, as well as elastic collisions of the ions are included in the model [67–70]. Langevin type cross sections are used for the elastic collisions of these ions with the neutral gas molecules [1]. Again, a table listing all of the ion-molecule reaction processes considered in the simulation is given in [45]. The respective cross sections are displayed in figure 3.

Figure 3. Cross sections of ion-impact collision processes included in the simulation. The corresponding references for the cross sections are discussed in the text.
Download figure:
Standard image High-resolution imageAll charged products of the ion-molecule reactions are traced, except for the CF ions. As CF
 ions react in a similar way with CF4 as CF
 ions, and as their recombination rate with electrons is only slightly higher than the corresponding rate of CF
 [71], we assume as a simplification that this process does not convert CF
 ions to CF
 ions. Hence, we avoid the explicit treatment of another species of minor importance in the computations, while the particle balances are hardly affected. The neglect of positive ions other than CF
 is justified by the high rates for CF+–CF4 and CF
 –CF4 reactions, which rapidly convert them into CF
 ions [72].
Recombination processes between positive and negative ions are included, using the rate coefficients available in the literature [73]. The recombination between electrons and CF ions is also included, using the data from [74]. The computional procedure is described in [75]. A table with all recombination processes considered in the simulation can be found in [45].
The gas pressure and temperature are set to 80 Pa and 350 K, respectively. The emission of secondary electrons is neglected to simplify the analysis of the complex dynamics of the energy gain and loss of electrons. Also, we find that this assumption leads to a good agreement with experimental data obtained at 5.50 MHz base frequency [56]. The reflection of electrons from the electrodes is assumed to occur with a probability of 0.2 [76].
2.2. Analytical model
We use an analytical model of DC self-bias formation in CCRF plasmas to gain further understanding of the discharge physics. This model, based on the discharge voltage balance, was first introduced in [35] and extensively described in [37, 41]. A simple expression for the DC self-bias, η, is obtained by evaluating this voltage balance at the times of maximum ( ) and minimum (
 ) applied voltage [41]:
Here,  and
and  are the floating voltages of the powered and grounded electrode sheaths (at the times of maximum and minimum applied voltage), respectively.
  and
and  are the voltage drops across the plasma bulk at the times of maximum and minimum applied voltage. Note that
  and
and  are negative [41]. The first term on the right hand side is dominant in electropositive plasmas, where the second and third terms can often be neglected. However, particularly the voltage drop across the plasma bulk (i.e. the third term) cannot be neglected in electronegative plasmas [4, 24, 45]. All quantities involved in the second and third terms can be obtained from the simulations. As such, this is not a self-consistent model, rather than an aid to understanding.
The parameter
is a measure for the discharge spatial symmetry [35, 37], and describes all factors that affect the DC self-bias apart from the voltage amplitude asymmetry. It is defined as the ratio of the maximum of the absolute value of the sheath voltage at the grounded and powered electrode (found at the times of minimum and maximum applied voltage), respectively. In the frame of this model,  refers to a symmetric discharge, whereas any strong or weak deviation from unity corresponds to a more or less pronounced asymmetry. The physical origin of such an asymmetry can be understood by examining the individual ratios contributing to the symmetry parameter, as defined in the second equality in equation (3).
Ap and Ag are the surface areas of the powered and grounded electrodes. Here,  for the geometrically symmetric discharge configuration used in this simulation.
  and
and  are the mean net charge densities in the respective sheaths. In contrast to electropositive plasmas, where only positive ions need to be considered, these values are defined by
in electronegative plasmas to account for all charged heavy species,  and
and  , which correspond to the density of the positively charged and the negatively charged ions, respectively. (Note that these expressions are also valid for multiple ionic species, but we assume that all types of ions are singly charged.) In low-pressure electropositive plasmas, it has been found that the ratio of the mean net charge densities in the two sheaths differs from unity for a driving voltage waveform described by equation (1) due to the stronger acceleration of ions in one of the sheaths, thereby causing a self-amplification of the EAE [37]. The maximum sheath widths,
  and
and  in equations (4) and (5), are determined from the simulation data based on a criterion introduced by Brinkmann [77], again taking the presence of negative ions into account.
The maximum charges are related to the mean net charge densities via  and
and  , respectively [35]. In a previous study of argon plasmas driven by voltage waveforms where the base frequency was varied over a range similar to the one used here, it was found that the charge dynamics affects the ratio of the maximum charges at low driving frequencies and reduces the range of control of the DC self-bias via the EAE [54]. The charge dynamics, in turn, was found to be enhanced by the long total time between two subsequent sheath collapses at low driving frequencies. Then, the ratio
  leads to a larger symmetry parameter
  and, thereby, to a less negative DC self-bias η if all harmonics' phases are set to 0° [54].
Isp and Isg appearing in equation (3) are the so-called sheath integrals [35], which are obtained via
where psp and psg are the net charge density profiles in the two sheaths normalized by their mean values

 and
and  are the normalized spatial position coordinates in the two sheaths. The sheath integral equals unity for a homogeneous net charge density profile. In the absence of negative ions, the decrease of the positive ion density towards the electrodes due to the acceleration of the ions by the sheath electric field at approximately constant ion flux leads to a slightly larger value. Furthermore, the ratio of the sheath integrals was found to be close to unity in such cases, so that the effect on the symmetry parameter and on the DC self-bias was negligible [35, 37]. In electronegative plasmas, however, the presence of negative ions can cause a reduction of the net charge density in the regions around the sheath edges (i.e. the regions of large
  and
and  , respectively), as will be shown below. As a consequence of the non-monotonic behavior of the resulting net charge density profile, the sheath integral value is reduced, so that values of
  are expected.
3. Results
3.1. DC self-bias and symmetry parameter
Figure 4 shows the DC self-bias obtained from the simulation and the analytical model as a function of the base frequency of the applied voltage waveform. The DC self-bias values have been normalized by the amplitude of the applied voltage, i.e.  with
with  V. A large negative DC self-bias develops due to the strong amplitude asymmetry of the applied voltage waveform. Furthermore, the absolute value of
  becomes much larger for lower base frequencies. This is in stark contrast to the findings in electropositive plasmas, where the control of the DC self-bias via the EAE is deteriorated by the charge dynamics at low frequencies [54]. The analytical model reproduces the simulation results well. It should be noted, that all terms in equation (2) have been taken into account here. The voltage drop across the plasma bulk at the time of maximum applied voltage (at t = 0) is about 10 V at 13.56 MHz and increases to about 16 V at 2.86 MHz. Hence, the influence of the bulk voltage on the DC self-bias is about 5–8%. Furthermore, the value of
  % obtained in the simulation at f0 = 5.50 MHz agrees well with
  % determined experimentally at the same base frequency [56].
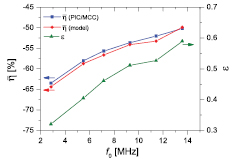
Figure 4. DC self-bias normalized by  (left axis) as a function of the base frequency, f0, of the applied voltage waveform resulting from PIC/MCC simulations of a CF4 plasma at 80 Pa and from the analytical model. Symmetry parameter, ε (right axis), obtained from the same PIC/MCC simulations.
Download figure:
Standard image High-resolution imageThe increase of the DC self-bias as the base frequency is lowered (for a waveform with constant amplitude asymmetry) is caused by a change of the symmetry parameter, which is also depicted in figure 4. These values are determined from the simulation data and are used as input parameters for the analytical model of the DC self-bias. At the reference base frequency of 13.56 MHz, a value of  is found. If the simplified model is used by neglecting the bulk and floating voltages, a value of
  would be obtained from the first term on the right hand side of equation (2) for
  . Compared to that, the EAE is amplified by the low symmetry parameter values, leading to a shift of the DC self-bias to more negative values. The deviation of the symmetry parameter from unity becomes even stronger as the base frequency is reduced. It should be noted that values below
  have not previously been observed in any study of a geometrically symmetric CCRF discharge. What is the physical origin of this strong asymmetry? In order to gain an understanding of the mechanisms behind the decrease of the symmetry parameter, it is useful to examine the individual ratios in equation (3).
Figure 5 shows the mean net charge densities in the powered and grounded electrode sheaths, as they are defined in equations (4) and (5), as well as their ratio obtained from the simulation at different base frequencies. The mean densities increase in both sheaths as the base frequency is increased. This is due to the enhanced electron power absorption and, hence, higher plasma densities for higher driving frequencies [1, 2, 21, 22]. The mean density in the grounded electrode sheath is much larger than that in the powered electrode sheath. As will be shown below, strong ionization occurs deep in the grounded electrode sheath, which causes the difference in the densities between the two sheaths. Accordingly, the ratio  is much smaller than one. This helps achieve a larger control range of the DC self-bias and is one of the important mechanisms causing the self-amplification of the symmetry control. Furthermore, the ratio
  becomes smaller for lower base frequencies, because the ionization adjacent to the powered electrode decreases more rapidly than that adjacent to the grounded electrode when f0 is reduced, due to the completely different underlying mechanisms of electron power absorption. Therefore, the DC self-bias is further enhanced at lower base frequencies.

Figure 5. Mean net charge densities in the powered and grounded electrode sheath (left axis) as well as their ratio (right axis) as a function of the base frequency f0 of the applied voltage waveform resulting from PIC/MCC simulations of a CF4 plasma at 80 Pa.
Download figure:
Standard image High-resolution imageThe maximum charges located in the two sheaths behave in a similar way to the mean net charge densities: they increase as a function of the base frequency and the maximum charge in the grounded electrode sheath is larger than that in the powered electrode sheath (see figure 6(a)). The maximum charges in the two sheaths differ from each other, because the minimum charge in the grounded sheath is much larger than that in the powered electrode sheath due to the longer time of sheath collapse. Thus, the floating potential is higher adjacent to the grounded electrode, resulting in a larger minimum charge in this sheath ( ) and, for an almost constant total charge (
 see figure 6(b)), a smaller maximum charge at the same time in the powered electrode sheath. The ratio is larger than one and, therefore, decreases the control range of the DC self-bias. This is similar to low-frequency electropositive plasmas, where the ratio was also found to be larger than one [54]. In that case it is caused by the total charge dynamics. However, here the range is smaller (ratio of about 1.4 in CF4 compared with a ratio of more than 2 in Ar at low frequencies).
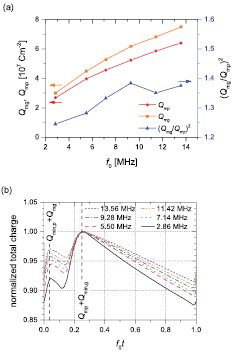
Figure 6. (a) Maximum charge located in the powered and grounded electrode sheath (left axis) as well as the square of their ratio (right axis) as a function of the base frequency f0 of the applied voltage waveform resulting from PIC/MCC simulations of a CF4 plasma at 80 Pa. (b) Normalized total net charge in the discharge volume for various base frequencies obtained from the same simulations. The vertical dashed lines indicate the times when the charge is maximum in one of the sheaths and is minimum in the other sheath.
Download figure:
Standard image High-resolution imageAs shown in figure 6(b) the total charge ( ) increases steeply at the times of sheath collapse at
  and
and  , when electrons compensate the positive ion flux to the powered and grounded electrodes, respectively. The temporal variation of the total charge is small (about 10%) and becomes only slightly larger at smaller base frequencies due to the longer period T = 1/f0, during which ions flow to the boundary surfaces. The normalized total net charge, due to the charge dynamics [40], reaches its absolute maximum, when the charge in the powered electrode sheath is maximal (around
  ). In contrast to single-frequency plasmas, where the time between periods of loss of electrons to either electrode at the times of collapsing sheaths is equal, here the grounded electrode sheath collapses shortly after the collapse of the powered electrode sheath. Therefore, the loss of electrons flowing to the electrodes occurs only in the first quarter of the RF period. During the long, remaining part of the RF period, only (positive) ions are lost to the electrodes. Thus, the total charge is continuously reduced. This leads to a smaller total charge at the time of Qmg compared to the one at the time of Qmp. The difference between the total uncompensated charge at these two times becomes larger for smaller base frequencies, as the total time during which ions are lost becomes longer, i.e. the slope of the total charge between
  and
and  becomes more negative. As a consequence, the ratio
  becomes smaller, resulting in a less pronounced decrease of the symmetry control. However, this effect of the base frequency is relatively small, since the total ion fluxes are smaller in electronegative plasmas compared with electropositive ones, as the diffusion of positive ions into the sheaths is reduced by the presence of negative ions.
The last factor in the calculation of the symmetry parameter (equation (3)) is the ratio of the sheath integrals, which are determined based on the normalized sheath density profiles,  and
and  . Figure 7 shows these profiles for different base frequencies. The profile in the powered electrode sheath resembles the scenario that is typically found in electropositive plasmas or in electronegative plasmas in the absence of negative ions inside the sheath. The positive ion density gradually decreases towards the electrode (located at
  ). The profile in the grounded electrode sheath, however, looks completely different: it exhibits a peak close to the electrode, a local minimum adjacent to this peak followed by a local maximum and then decreases towards the sheath edge (at
  ). As the frequency is reduced this pattern becomes larger in amplitude and shifts deeper into the sheath region, i.e. it moves further towards smaller values of
  . At f0 = 2.86 MHz, psg even becomes negative over a narrow spatial region (around
  ). This means that the negative ion density locally exceeds the positive ion density in the sheath region at the time of maximum applied voltage.
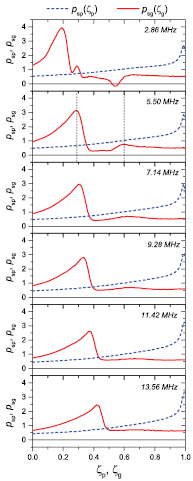
Figure 7. Normalized sheath density profiles  (blue dashed line) and
  (red solid line) for various base frequencies f0 of the applied voltage waveform resulting from PIC/MCC simulations of a CF4 plasma at 80 Pa. The vertical dashed lines indicate the maxima of
  at f0 = 5.50 MHz.
  corresponds to the electrode position and
  to the maximum sheath length.
Download figure:
Standard image High-resolution imageThe normalized sheath density profiles must be multiplied by the normalized position ( and
and  ) and integrated from the electrode to the maximum width of the respective sheath to obtain the sheath integrals (see equations (6) and (7)). Due to this mathematical procedure, the large peak in the profile of the grounded electrode is weighted by a small number (small
  ), whereas the increase of psp towards the sheath edge is further emphasized. As a result, the sheath integral at the powered side is much larger than that at the grounded side, so that the ratio of the sheath integrals,
  , is much smaller than one, as shown in figure 8. This causes a strong amplification of the symmetry control via the EAE, as it leads to a more negative DC self-bias for the driving voltage waveform specified by equation (1). The ratio decreases further, as the base frequency is reduced, since the peak in the grounded electrode sheath moves further towards smaller
  -values.
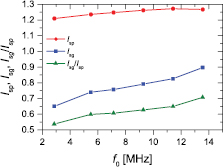
Figure 8. Sheath integrals Isp and Isg as well as their ratio as a function of the base frequency f0 of the applied voltage waveform resulting from PIC/MCC simulations of a CF4 plasma at 80 Pa.
Download figure:
Standard image High-resolution imageSummarizing the analysis, figure 9 shows all of the individual ratios contributing to the symmetry parameter and the symmetry parameter itself as a function of the base frequency. We find that both the ratio of the mean net charge densities and the ratio of the sheath integrals are smaller than one and decrease further for lower base frequencies. Therefore, these two ratios lead to an enhanced control range for the DC self-bias via the EAE already at f0 = 13.56 MHz and an even stronger enhancement if f0 is reduced. In contrast, the ratio of the maximum charges is slightly larger than one, thereby increasing the value of ε. This counteracts the effect of the other two terms and reduces the absolute value of the DC self-bias, but the effect is rather weak.
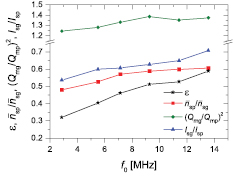
Figure 9. Individual ratios contributing to the symmetry parameter in equation (3) and the resulting symmetry parameter as a function of the base frequency f0 of the applied voltage waveform obtained from PIC/MCC simulations of a CF4 plasma at 80 Pa. Note the break of the vertical axis.
Download figure:
Standard image High-resolution image3.2. Space and time resolved analysis at 5.50 MHz base frequency
In order to understand the mechanisms behind the strong self-amplification of the symmetry control via the EAE in electronegative plasmas at low base frequencies, we examine the space and time resolved data in the 5.50 MHz case as an example. This base frequency is chosen because initial measurements have already been performed at this frequency [56], so that a comparison between the findings of the present paper and such measurements in the near future is facilitated.
The spatio-temporal distribution of the density of power absorption by electrons is given by the product of the electron current density and the electric field [1, 2]. These three quantities are depicted in figures 10(a)–(c). Due to the shape of the driving voltage waveform (equation (1)), the sheath at the grounded electrode is collapsed for most of the fundamental RF period, while the sheath at the powered electrode is expanded for most of the time. Both sheaths expand and collapse quickly once per RF period. At the beginning of the RF period, when the powered electrode sheath expands and the grounded electrode sheath collapses, the electron conduction current is strongly positive in the plasma bulk (i.e. electrons flow towards the grounded electrode), whereas the reversed situation is found at the end of the RF period. In the region  the conduction current density is smaller compared with that in the discharge center due to the presence of a significant displacement current density. However, in this region an intermediate electric field strength is found, i.e. the electric field is stronger here than in the bulk region, but weaker than in the electron-free sheath regions. Around the time of the collapse of the sheath adjacent to the grounded electrode (at
  ), the electric field becomes negative locally (within and around the dashed rectangle in figure 10(b)) to enable the transport of electrons out of the bulk towards the grounded electrode. This field is required because the RF conductivity is reduced by the presence of negative ions and the large loss of electron momentum due to the high collision frequency at 80 Pa gas pressure. The feature can be regarded as a double layer, which typically develops in CCRF plasmas in highly electronegative gases [21]. As will be shown below, negative ions are created between
  and z = d and may remain in this region due to the long time during which the sheath is collapsed (resulting in the time-averaged electric field profile discussed below), whereas no negative ions are found in the powered electrode sheath region. As a result of the electric field facilitating the electron transport, a relatively large number of electrons gain sufficient energy to overcome the thresholds for inelastic collisions, causing collisional attachment of negative ions and/or ionization. This reversed field located at the bulk side of the oscillating plasma sheath edge is the main power source for electrons in the entire discharge volume within the RF period, so the power absorption rate at the collapsing grounded electrode sheath is stronger than that caused by any other mechanisms such as sheath expansion at either side. Moreover, we observe a strong cooling of electrons in the positive field, that represents the drop of the floating potential at the grounded electrode (around
  and
and  mm).
mm).
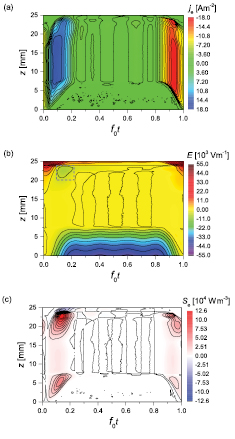
Figure 10. Spatially and temporally resolved (a) electron current density, je, (b) electric field strength, E, and (c) density of power absorption by electrons, Se, resulting from PIC/MCC simulations of a CF4 plasma operated at 80 Pa and f0 = 5.50 MHz.
Download figure:
Standard image High-resolution imageThe presence of a significant density of negative ions in the grounded electrode sheath region is the result of dissociative attachment processes in e−-CF4 collisions. Figure 11(a) shows the rate of F− production in electron collisions with CF4. (The formation pattern of CF ions (not shown) looks very similar, but the rate is only about 20% of the F− production rate.) These collisions require energies above the threshold of 5 eV for the projectile electrons. As the gas pressure is relatively high, the electron mean free path is short and these processes can be expected to occur close to the regions of high electron energy gain in space and time. Accordingly, the biggest and strongest pattern is observed in the grounded electrode sheath region at the beginning of the RF period. This is a direct consequence of the strong electron power absorption found in this region. Therefore, the maximum generation of negative ions occurs in the region between the grounded electrode and the maximum grounded electrode sheath extension at the time, when the respective sheath collapses and electrons flow out of the plasma bulk towards the electrode. The dissociative ionization rate shows a peak in space and time caused by highly energetic electrons (see figure 11(b)), where the attachment rates exhibit a hollow pattern around this peak. This is because the attachment processes have a smaller threshold energy and are effective over only a narrow energy range (see figure 2).

Figure 11. Spatially and temporally resolved (a) electron attachment rate generating F− and (b) electron impact dissociative ionization rate resulting from PIC/MCC simulations of a CF4 plasma operated at 80 Pa and f0 = 5.50 MHz.
Download figure:
Standard image High-resolution imageFigure 12(a) shows the time-averaged profiles of all charged species across the entire discharge gap. An abrupt transition from an electropositive sheath at the powered electrode to an electronegative plasma bulk is found at  . The profiles in the grounded electrode sheath region (see figure 12(b) for details) are found to be strongly different from those in the powered electrode sheath. In the case of the electrons, the maximum and minimum density at each position obtained from the temporally resolved electron density are also shown. The distribution of all heavy (ion) species is static to a very good approximation. In contrast to the usual situation of negligible negative ion densities in the sheath regions (which is the case for the powered electrode sheath region), a significant density of negative ions is present in the grounded electrode sheath region. This is a consequence of the high ionization and attachment rates in the grounded electrode sheath region due to the power absorption of electrons by the reversed field, as discussed above. A similar pattern of the spatio-temporal electric field and electron-impact ionization has been found in highly electronegative CCRF plasmas driven by a single low radio frequency [21]. The maximum densities of both negatively charged ion species are located between
  and z = d. The negative ion density is larger than the electron density in the region up to
  mm. The dashed lines indicate the positions of the maxima in the normalized charge density profile
  shown in figure 7. The major peak at
  or z = 23.8 mm occurs around the transition point where the plasma generally changes from electronegative behavior to electropositive, as the electron density starts to exceed the density of negative ions. Furthermore, the minor peak at
  or z = 22.4 mm can be associated with the position, which the plasma electrons reach at the time of maximum applied voltage (i.e. at the time of maximum voltage and spatial extension of the grounded electrode sheath). However, it should be noted that the maximum sheath width is significantly larger, as indicated in figure 12(b). Accordingly, a fraction of the bulk electrons is capable of penetrating into the grounded electrode sheath at f0t = 0. This is because the density of thermal electrons decays slowly due to the very weak electric field close to the sheath edge.

Figure 12. Spatial profiles of the charged species across the entire discharge gap (a) and in the grounded electrode sheath region (b) resulting from PIC/MCC simulations of a CF4 plasma operated at 80 Pa and f0 = 5.50 MHz. In (b), the vertical dashed lines indicate the positions of the maxima in the normalized charge density profile  shown in figure 7. In addition to the temporally averaged value, the maximum and minimum values of the spatio-temporal electron density are shown, as well.
Download figure:
Standard image High-resolution imageIn general, such effects of field reversals during sheath collapse may occur for different applied voltage waveforms and at different base frequencies. For instance, the ionization will be dominated by energetic electrons in the double layer region during field reversal in electronegative single frequency capacitive discharges, if the frequency of the applied voltage is lowered [21]. However, the customized voltage waveform used here is beneficial for two reasons. First, the energy gain of electrons in the field reversal is enhanced due to the fast decrease of the applied voltage, leading to a fast collapse of the grounded electrode sheath voltage and width. Therefore, the electrons accelerated by the reversed field dominate the ionization and attachment. Secondly, the long period of low applied voltage and, hence, low grounded electrode sheath voltage and width directly after the collapse is advantageous, because the electric field in the region of negative ion generation is relatively small on time average, so that negatively charged heavy species may build up large densities.
This can be understood based on the time averaged electric field profile, to which these heavy species react. Figure 13(a) shows the mean, maximum and minimum electric field strength across the discharge gap, while figure 13(b) provides a detailed view into the grounded electrode sheath region. In electropositive plasmas, the electric field in the grounded electrode sheath usually oscillates between a strongly positive value and about zero [1, 2]. However, in the case studied here the mean electric field changes sign inside the sheath region adjacent to the grounded electrode. This is due to the strong influence of the field reversal during sheath collapse on the time-averaged profile [21]. The electric field is even negative on time average up to z = 22.7 mm. This also means that negative ions are attracted to this region and positive ions are repelled. This explains why the density profiles of the negative ions exhibit peaks in this region. In the direct vicinity of the electrode the plasma turns electropositive and the electric field stays positive throughout the entire RF period.

Figure 13. Spatial profiles of the maximum, mean, and minimum electric field across the entire discharge gap (a) and in the grounded electrode sheath region (b) resulting from PIC/MCC simulations of a CF4 plasma operated at 80 Pa and f0 = 5.50 MHz. In (b), the vertical dashed lines indicate the positions of the maxima in the normalized charge density profile  shown in figure 7.
Download figure:
Standard image High-resolution imageTherefore, negative ions accumulate between the positions marked by the vertical dashed lines in figure 13(b), causing a reduction of the normalized charge density profile. Moreover, their presence causes a strong field reversal (minimum electric field) via a local depletion of the RF conductivity. The acceleration in this field is the dominant mechanism of energy gain for the electrons, as it has also been found in electronegative CCRF plasmas driven by a single low radio frequency [21]. Thus, hot electrons are generated, which in turn lead to the generation of positive and negative ions in electron-neutral collisions. Electrons may diffuse quickly from the ionization region, leaving a positive space charge behind, which in turn attracts the negative ions via the (time-averaged) electric field profile. Hence, the generation of both positive and negative ions eventually results in the charge density profiles presented in figure 12. Accordingly, the plasma is electronegative in the sheath region. This, again, enhances the field reversal effect on the electron power absorption dynamics. Thus, the effect is self-enhancing, as the physical mechanisms form a positive feedback loop.
The two consequences of the generation and presence of both positive and negative ions in the grounded electrode sheath are that, firstly, the net charge density profile remains relatively flat, whereas it drops strongly in the electropositive powered electrode sheath. This leads to an improved symmetry control, as it causes  . Secondly, the maximum of the net charge density at the time of maximum sheath expansion is not found close to the sheath edge, but at a position deep inside one of the two sheaths. This position is within the region where the behavior turns electropositive. We find it to be at about the same position (around
  mm at p = 80 Pa and d = 25 mm), independent of the base frequency. The sheath integral value, Isg, becomes smaller for lower base frequencies, though, because the maximum sheath width becomes larger at lower base frequencies (see figure 14), so that the peak moves closer to the electrode on a normalized scale. Thereby, the sheath integral, Isg, is strongly reduced, causing an enhanced symmetry control due to
  .
.
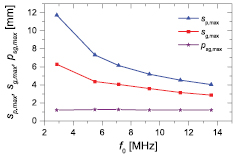
Figure 14. Maximum widths of the powered and grounded electrode sheath as well as distance between the peak in the net charge density profile in the grounded electrode sheath and the grounded electrode,  , resulting from PIC/MCC simulations of a CF4 plasma operated at 80 Pa.
Download figure:
Standard image High-resolution imageThus, the symmetry control can be enhanced by the electron heating and subsequent ionization dynamics in electronegative plasmas at low driving frequencies. Similar to single-frequency cases [21], our findings in a CCRF plasma driven by a multi-frequency voltage waveform can be generalized such that a large density of negative ions can be present in a RF sheath, if there is sufficient electron power absorption (e.g. due to a field reversal) and, subsequently, sufficient ionization to ensure an equilibrium of positive ions and electrons arriving at the electrode on time average. (No negative ions reach the electrode.) Then, the flux out of the plasma bulk is much smaller than the flux of electrons and positive ions generated at a certain position inside the sheath. Although the sheath extends into a region beyond this position during a part of the RF period, this region may remain electronegative. Under single frequency operation, both sheaths become electronegative and the plasma remains spatially symmetric [21], while we find that an asymmetric voltage waveform breaks this symmetry. Specific customization of the applied voltage waveform and its base frequency are important for the effect to be significant.
3.3. Effect of the base frequency on the IDFs
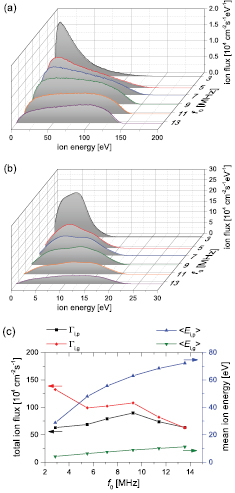
The very different physics of the two sheaths has a strong impact on the ion properties at the electrode surfaces. Figures 15(a) and (b) show the flux-energy distribution of CF ions at the powered and grounded electrodes at various base frequencies. At relatively high base frequencies the shape of the distribution function looks similar at both sides. The energy scale and maximum ion energy is different, however, because of the difference in the mean sheath voltages caused by the asymmetric driving voltage waveform. At low base frequencies the shape of the distribution function at the powered electrode peaks at low energies and decreases continuously as a function of the ion energy. This shape is typical for ions, which undergo primarily elastic collisions while being accelerated by the sheath electric field [1]. The maximum of the distribution function at the grounded electrode, however, is found at energies, which are relatively high considering the small total width of the distribution function. This is because many of the CF
 ions arriving at the electrode are generated at a distinct position deep inside the grounded electrode sheath, as discussed above. Therefore, the majority of the ions at the electrode originate from the same region relatively close to the electrode. Thus, these ions gain about the same energy during their motion through the sheath electric field, while the probability for collisions is lowered due to the reduced transit space and time. Furthermore, it is found that the maximum ion energy becomes smaller for lower base frequencies at the grounded electrode, but it stays approximately constant at the powered electrode.
Figure 15. Flux-energy distributions of CF ions at the (a) powered and (b) grounded electrode, and (c) total flux and mean energy of CF
 ions at various base frequencies resulting from PIC/MCC simulations of a CF4 plasma operated at 80 Pa.
Download figure:
Standard image High-resolution image
Figure 15(c) shows the total flux,  , and the mean energy,
  , calculated from the CF
 ion flux-energy distribution functions,
  . At high base frequencies, the total ion flux is nearly identical at both electrodes. The mean ion energy is different due to the asymmetry of the discharge, which is a consequence of the asymmetry of the applied voltage waveform. If the base frequency is reduced, a transition into the regime of electron energy gain by field reversal will occur, with a significant negative ion density in the grounded electrode sheath [21]. This does not affect the ratio of the mean ion energies at both electrodes (
 for all base frequencies). Note that this corresponds to a very large control factor of about 7 for the mean ion energy, as the roles of the two electrodes can be reversed by tuning the phases of the applied harmonics [20, 24, 35–45, 54]. However, the transition to a strongly asymmetric electron power absorption regime strongly affects the total ion flux, which is significantly higher at the grounded electrode, where the ion energies are lower. The flux ratio changes from
  at the highest base frequency to
  at the lowest base frequency, because the maximum ionization occurs within the grounded electrode sheath and all of the ions generated there will eventually flow to the grounded electrode.
4. Conclusions
The effect of the base frequency on the symmetry control of electronegative CCRF plasmas driven by tailored, multi-frequency voltage waveforms was investigated using PIC/MCC simulations of geometrically symmetric CF4 plasmas and an analytical model. We found that the Electrical Asymmetry Effect (EAE) is enhanced at lower base frequencies. This was explained by changes in the symmetry parameter, ε, as a function of the base frequency, f0. At lower base frequencies, ε becomes much smaller than unity, thereby allowing for a better control of the DC self-bias compared to the standard case at 13.56 MHz. Thus, the frequency dependence of the symmetry control in electronegative plasmas is completely different from that of electropositive plasmas, where the EAE has been found to be less effective at lower base frequencies [54].
A detailed analysis of the individual factors influencing the symmetry parameter revealed that this amplification of the EAE can be attributed to the different physical behaviors of the two sheaths: one sheath (in this case, with a 'peak-type' waveform applied, the sheath adjacent to the powered electrode) shows normal electropositive or slightly electronegative behavior, where the negative ion density in the sheath is negligible and the major part of the positive ions flows from the plasma bulk towards the electrode with a spatially and temporally almost constant flux. The other sheath (in this case the sheath adjacent to the grounded electrode), however, behaves completely differently, as electrons are accelerated by a reversed field during the collapse of the sheath towards the electrode. Subsequent collisions of these electrons with the neutral background gas may dominate the overall ionization and attachment rates in the entire discharge, so that the plasma becomes electronegative within a part of the sheath region. This, again, enhances the field reversal effect. Thus, hot electrons are generated, which in turn lead to the formation of negative ions and ionization. These physical mechanisms form a positive feedback loop. In that sense, the effect is self-enhancing.
This generation of positive and negative ions results in a particular charge density profile, with a maximum very close to the electrode and decreasing density towards the electrode and towards the plasma bulk. The sheath charge density profiles directly affect the symmetry parameter and, thereby, the control of the CCRF plasma. The electronegative sheath exhibits a larger mean charge density ( ) and a smaller sheath integral (
 ), which reflects the spatial profile of the charge density. These two ratios cause a decrease of the symmetry parameter for lower base frequencies, which enhances the symmetry control.
According to the different dynamics in the two sheath regions, the discharge consists of two halves with entirely different physical properties; in a qualitative comparison, one half is similar to that of a single-frequency electronegative plasma under low frequency operation, whereas the other half rather compares to that of a high frequency case [21]. As a consequence of the maximum in the spatial ionization profile within the grounded electrode sheath region, the ion flux to that electrode is considerably larger than that at the opposing electrode. The shape of the ion flux-energy distribution function is also altered, whereas the mean energy of the ions is hardly affected.
Summarizing these findings, the dynamics of the electron energy gain is completely different in electronegative plasmas driven by customized voltage waveforms with low base frequencies compared to the case of higher base frequencies and/or electropositive gases. In particular, if one of the two sheaths collapses quickly and stays close to the collapsed state for a large fraction of the RF period, a large region of this sheath will become electronegative, causing a transition of the electron heating mode. This causes a strong asymmetry in the ionization and attachment profiles, thereby amplifying the symmetry control via the EAE. A similar frequency dependence can be expected when controlling the discharge symmetry by driving electronegative plasmas with sawtooth-shaped voltage waveforms, i.e. using the slope asymmetry effect. This improved symmetry control should be very useful for certain applications, because the abnormal sheath behavior results in a high ion flux with a very small energy.
Acknowledgments
We thank J Franek, S Brandt, and B Berger (West Virginia University) for helpful discussions. This work was supported by the Hungarian Scientific Research Fund through the grant OTKA K-105476 and by the UK EPSRC through grant EP/K018388/1. Work described in this paper was made possible by financial support from ANR project CleanGRAPH (ANR-13-BS09-0019).