

Abstract
In this reply, we address the comments made by A N Ryabtsev on our paper (H Lu et al 2020 J. Phys. B: At. Mol. Opt. Phys. 53 115001). Specifically, we emphasize that the observed spectra depend critically on the plasma source type and conditions that pertain in the source. Our source of ions and experimental setup/method are quite different to the one referred to in the comment (A N Ryabtsev et al 2000 Opt. Spectrosc. 88 316–20). So there is no doubt that our spectra contain evidence of photoabsorption from low-lying excited states, and their inclusion is necessary, in order to account for the observed spectral distributions.
Export citation and abstract BibTeX RIS
We were very interested to read the comments made [1] in relation to the above paper [2] which we recently published in J. Phys. B: At. Mol. Opt. Phys. We make the following points in reply. Our experiment is quite different to the one referred to in the comment [3]. As we are sure the authors will appreciate, the observed spectra will depend critically on the plasma source type and conditions that pertain in the source e.g. (temperature, density, and their spatial/temporal variations and hence ionization and excitation balance). In addition, the specific experimental setup and capabilities will have an impact on the spectrum observed. Specifically, emission versus absorption of radiation, time resolved versus time integrated detection, photoelectric versus photographic detection and spatially integrated versus spatially resolved detection. In our experiment we chose specific experimental parameters, namely laser power density, the time delay following creation of the initial (absorbing) plasma and the spatial region in that plasma, which in turn allowed us to isolate Bi2+ ions (and indeed Pb+ ions in the other experiment). This was ensured by recording the photoabsorption spectra of these ions at longer wavelengths, where the spectra are well known.
On the details of the case made in [1]. We are not in a position to comment on the spectrum reported in [3]. The spectrum is specific to that experiment and the authors know their source and experiment in detail and have presented the results in their paper. It is mentioned that they observe emission due to a range of ion stages, not surprising in a case where time resolved detection was not possible, opposite to our work. We can write authoritatively only on the spectrum that we have acquired with our experimental setup and compare that with our calculations and those presented in the comment. We show our Bi2+ spectrum (figure 1(a)) [2] along with the same spectrum compared with the atomic line data (broadened by our instrumental width) extracted from table 1 in [1] (cf figure 1(b) below). It is clear that the computed spectral distribution in figure 1(b) does not match well to our observed distribution with respect to relative line strengths, albeit the wavelengths match quite well to some of the prominent features. So there is no doubt that our spectrum contains evidence of excited states, as the title of [2] states, along with photoabsorption from ions in the ground state, as one would naturally expect. We also performed a series of calculations that included configuration interaction among states of the same parity close to the ground state and also the low-lying excited states of interest here (figure 1(c)). Comparing figure 1(a) and Fig. 1(c), one observes that even though the inclusion of configuration interaction calculations slightly improves the agreement between the simulated spectrum and experimental spectrum (e.g. the relative strength in features at 46.6 nm and 46.8 nm is better reproduced), no dramatic changes are noticed in the oscillator strength distribution. The experimental spectrum is a mixed contribution of transitions from both the ground state and low-lying excited states of Bi2+. Specifically, the lines at 43.94 nm and 48.17 nm are exclusively due to transitions from low-lying excited states while the lines at 46.58 nm and 46.80 nm are predominantly due to the transitions from low-lying excited states. These lines are labeled in figure 1(c).
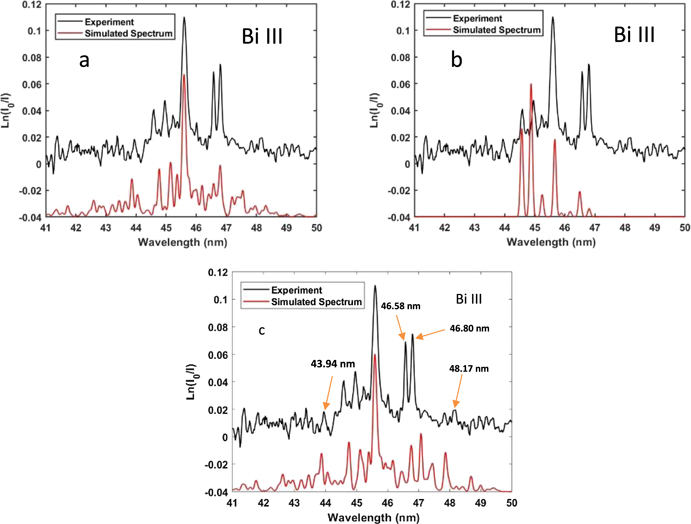
Figure 1. (a) Comparison of the Bi III photoabsorption spectrum with simulation (from [2]). (b) Comparison of the computed results from table 1 in [1] with the same experimental spectrum. (c) Comparison of the configuration interaction computed results with the experimental spectrum. The gf values in both cases have been convoluted with a common Gaussian instrumental function representing our experimental resolution.
Download figure:
Standard image High-resolution imageOur main point is that our source of ions and experimental setup/method is distinctly different to that used in [3] and so it should come as no surprise that we observed a spectrum that is quite different to that reported in [3]. As pointed out in [1] we have mis-referenced 29 in [2]. This is our mistake. Looking back through previous drafts of the manuscript it appears that we dropped a tract of text in error relating to previous work on atoms (and also to previous work on Bi ions, where reference [3] below should have appeared in the text). Reference [29] in [2] should have been to Mazzoni et al 1987 J. Phys. B: At. Mol. Phys. 20 2193.
In relation to Pb+, the spectrum was also recorded a short time after plasma breakdown (150 ns) where one expects the plasma to be still quite hot and hence, to observe, yet again, photoabsorption from excited states of the mono-cation. The spectrum is significantly more complex than for the Bi2+ case, as pointed out in [1], thus the agreement between our calculation and the experiment in [2] is not as good as for Bi2+ (cf Figure 2(a)). However, as is clear from figure 2(b), where we compare the (instrumentally broadened) data from table 2 in [1] with our experimental spectrum, the spectral distribution does not match well either. In addition, it is also clear that the density of features observed in our experimental spectrum is significantly higher than a ground state only calculation predicts. The calculations that involve configuration interaction in ground state (5d106s26p) and the excited states (5d106s26d, 5d106s27s, 5d106s6p2) in Pb+ were also performed. The results were broadened with our instrumental function and are shown in figure 2(c). Compared with figures 2(a) and (c), we can see that the simulated spectra display no significant changes compared to the original calculation.

Figure 2. (a) Comparison of the Pb II photoabsorption spectrum with simulation (from [2]). (b) Comparison of the computed results from table 2 in [1] with the same experimental spectrum. (c) Comparison of the configuration interaction computed results with the experimental spectrum. The gf values in both cases have been convoluted with a common Gaussian instrumental function representing our experimental resolution.
Download figure:
Standard image High-resolution image
In summary, there is no doubt that, in our specific experiment, we observe evidence of photoabsorption from low-lying excited states, and their inclusion is necessary, in order to account for the observed spectral distributions.
Data availability statement
All data that support the findings of this study are included within the article (and any supplementary files).