
Photoionization Cross-Sections of Carbon-Like N+ Near the K-Edge (390–440 eV)

 ,
,  ,
,
Abstract
:1. Introduction
2. Experimental Details
3. Theory
3.1. Relevant Decay Processes
3.2. Multi-Configuration Dirac-Fock (MCDF)
3.3. R-Matrix (RMPS)
4. Results and Analyses
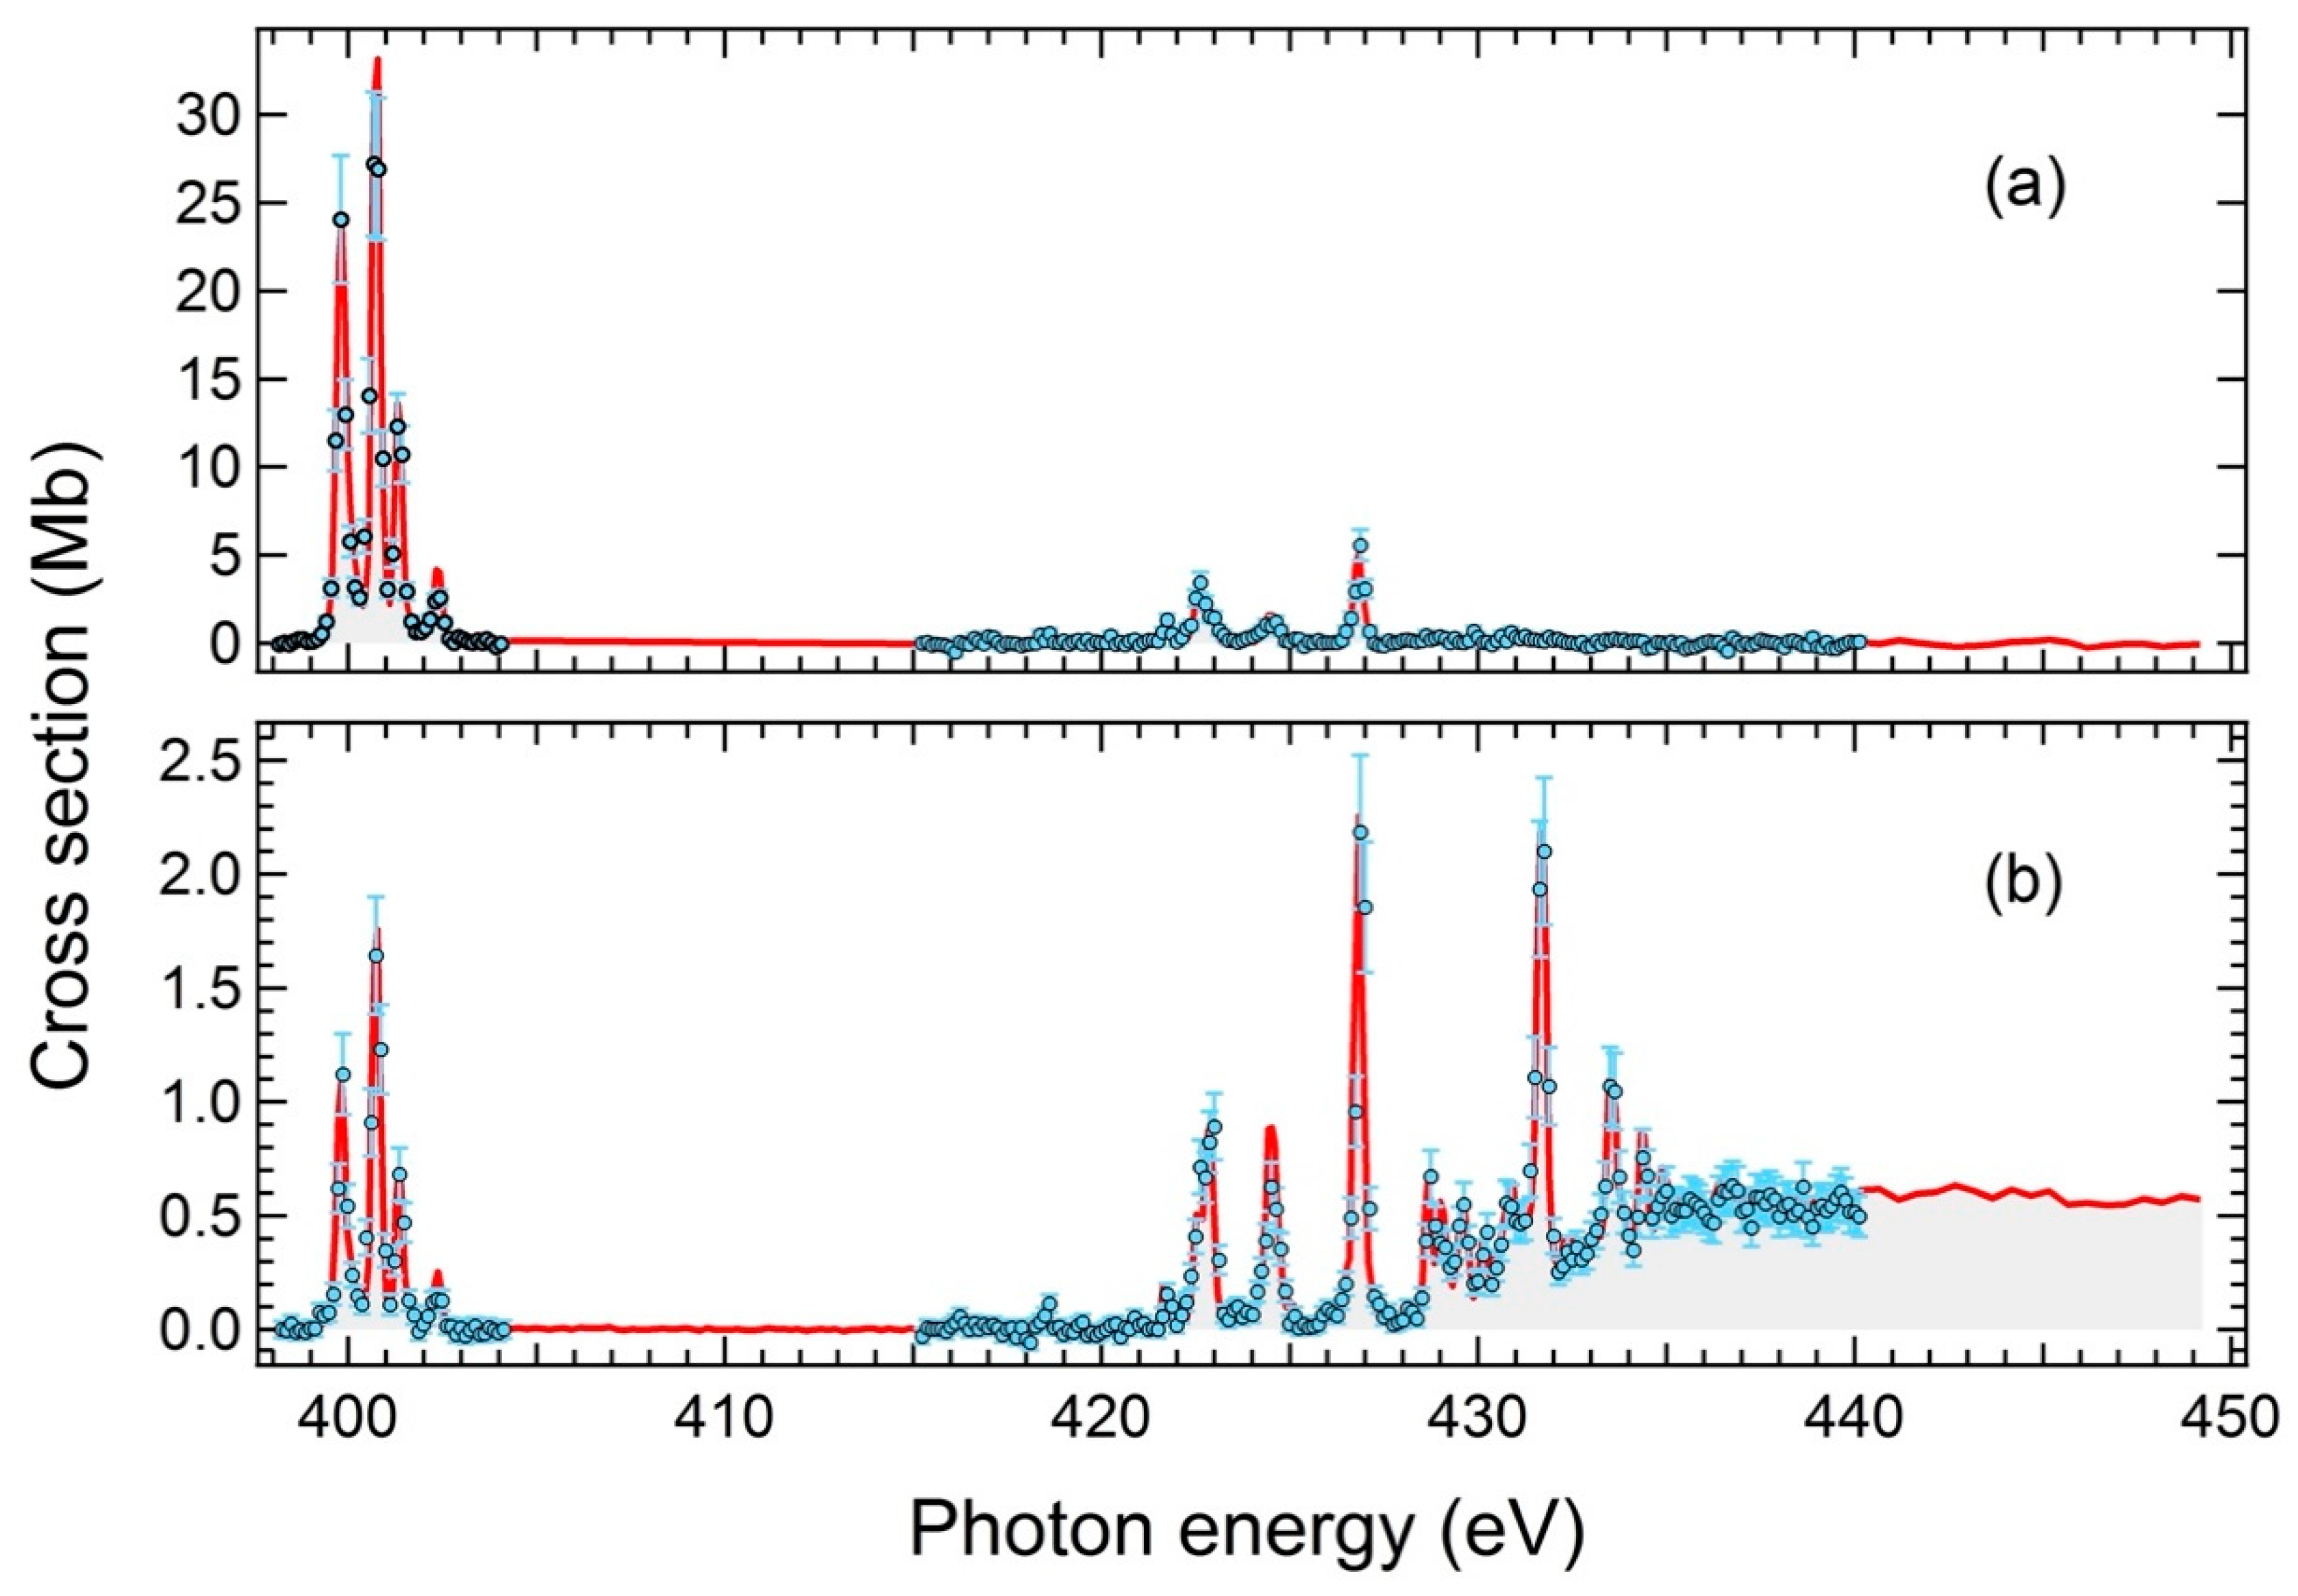
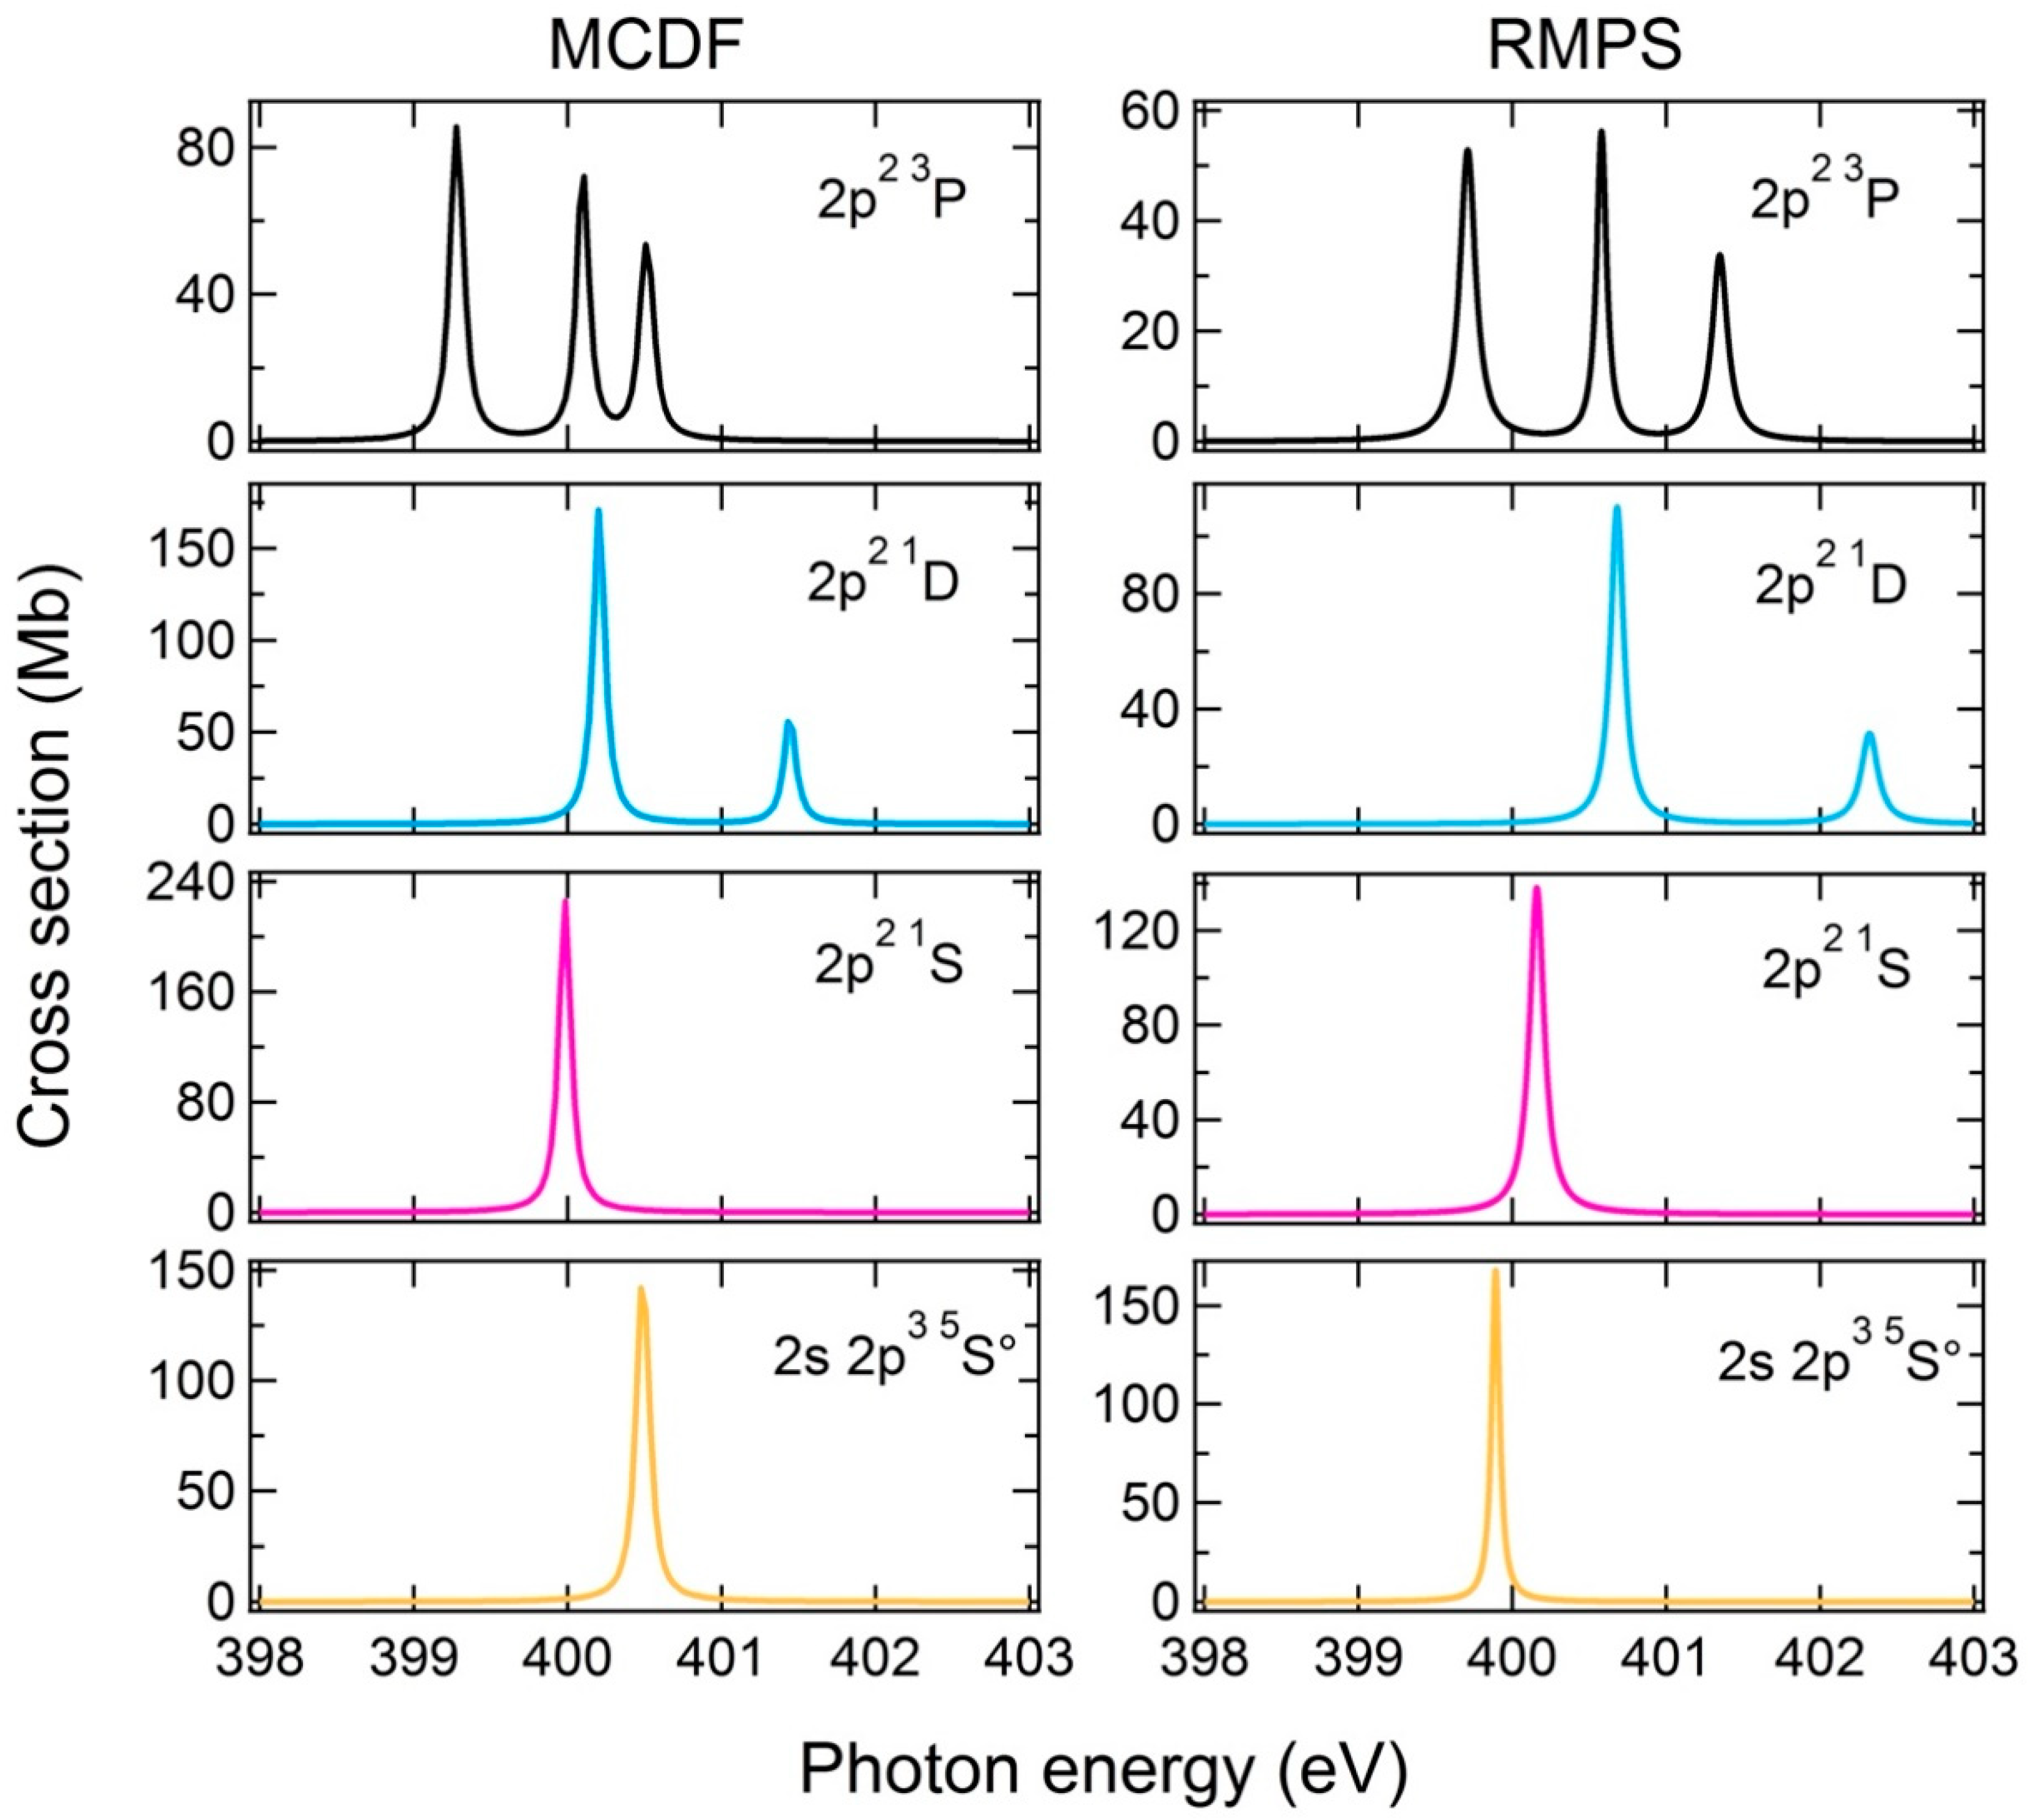
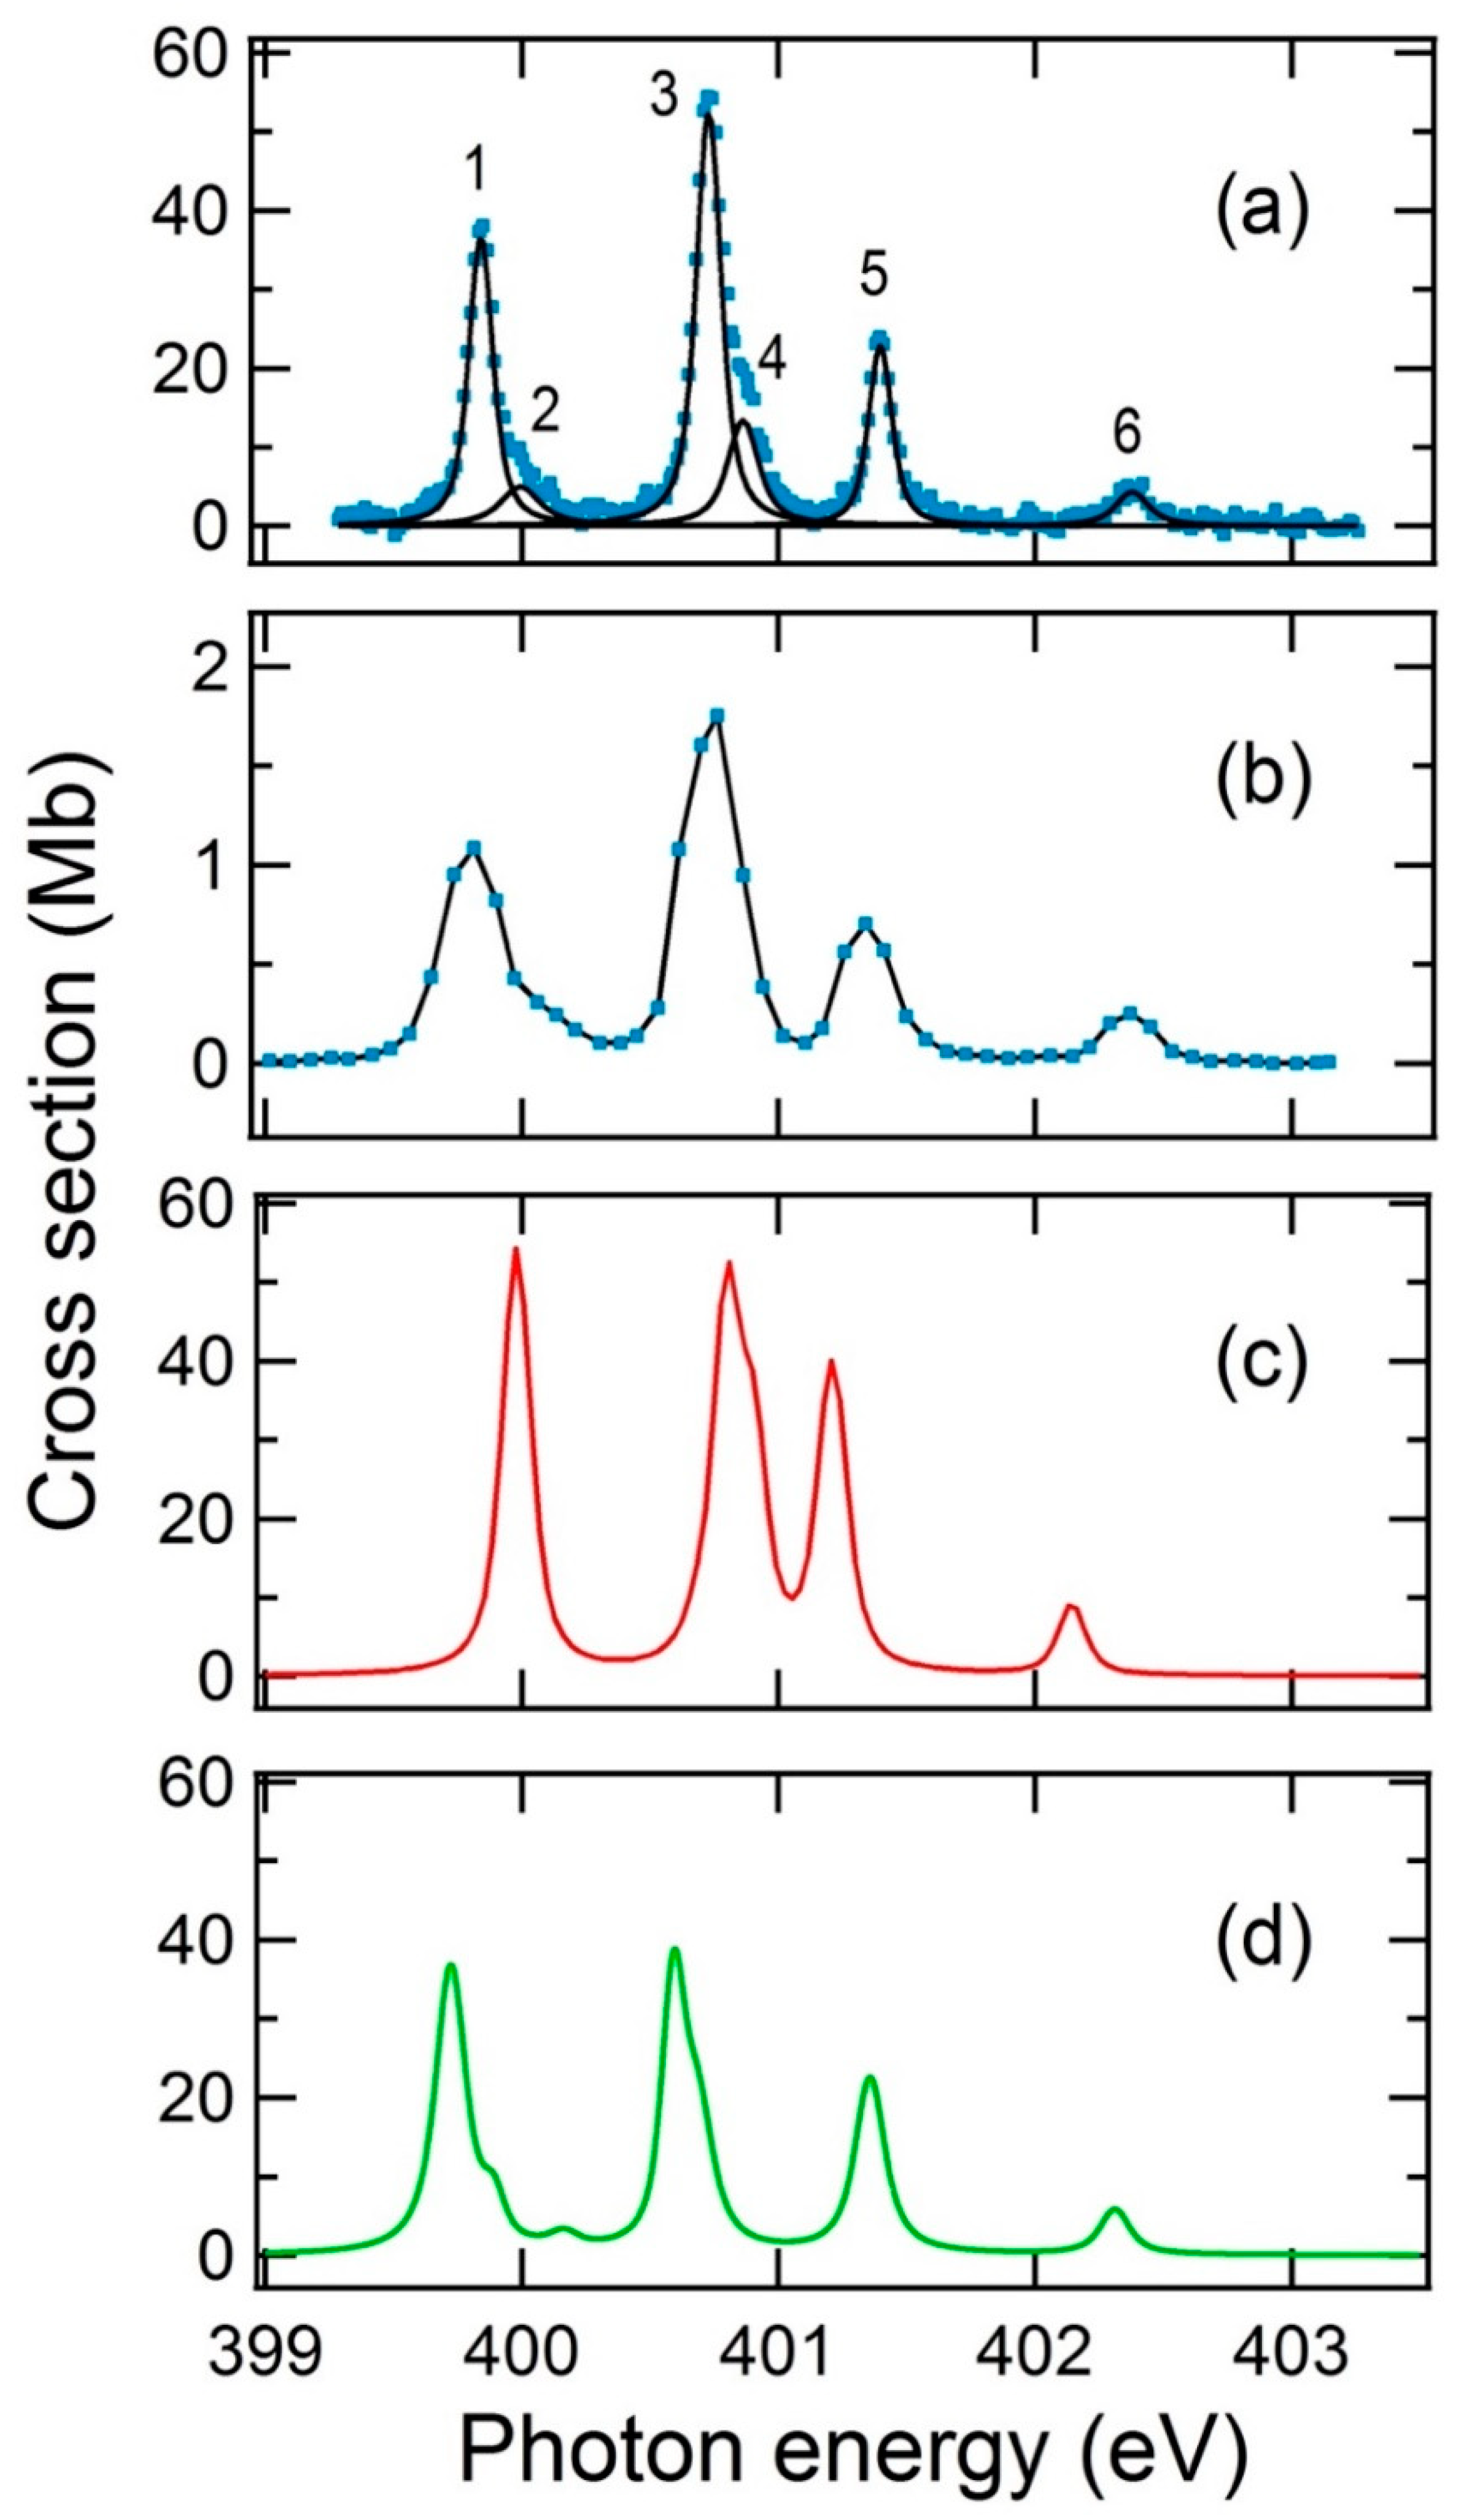
4.1. 1s → 2p Resonances
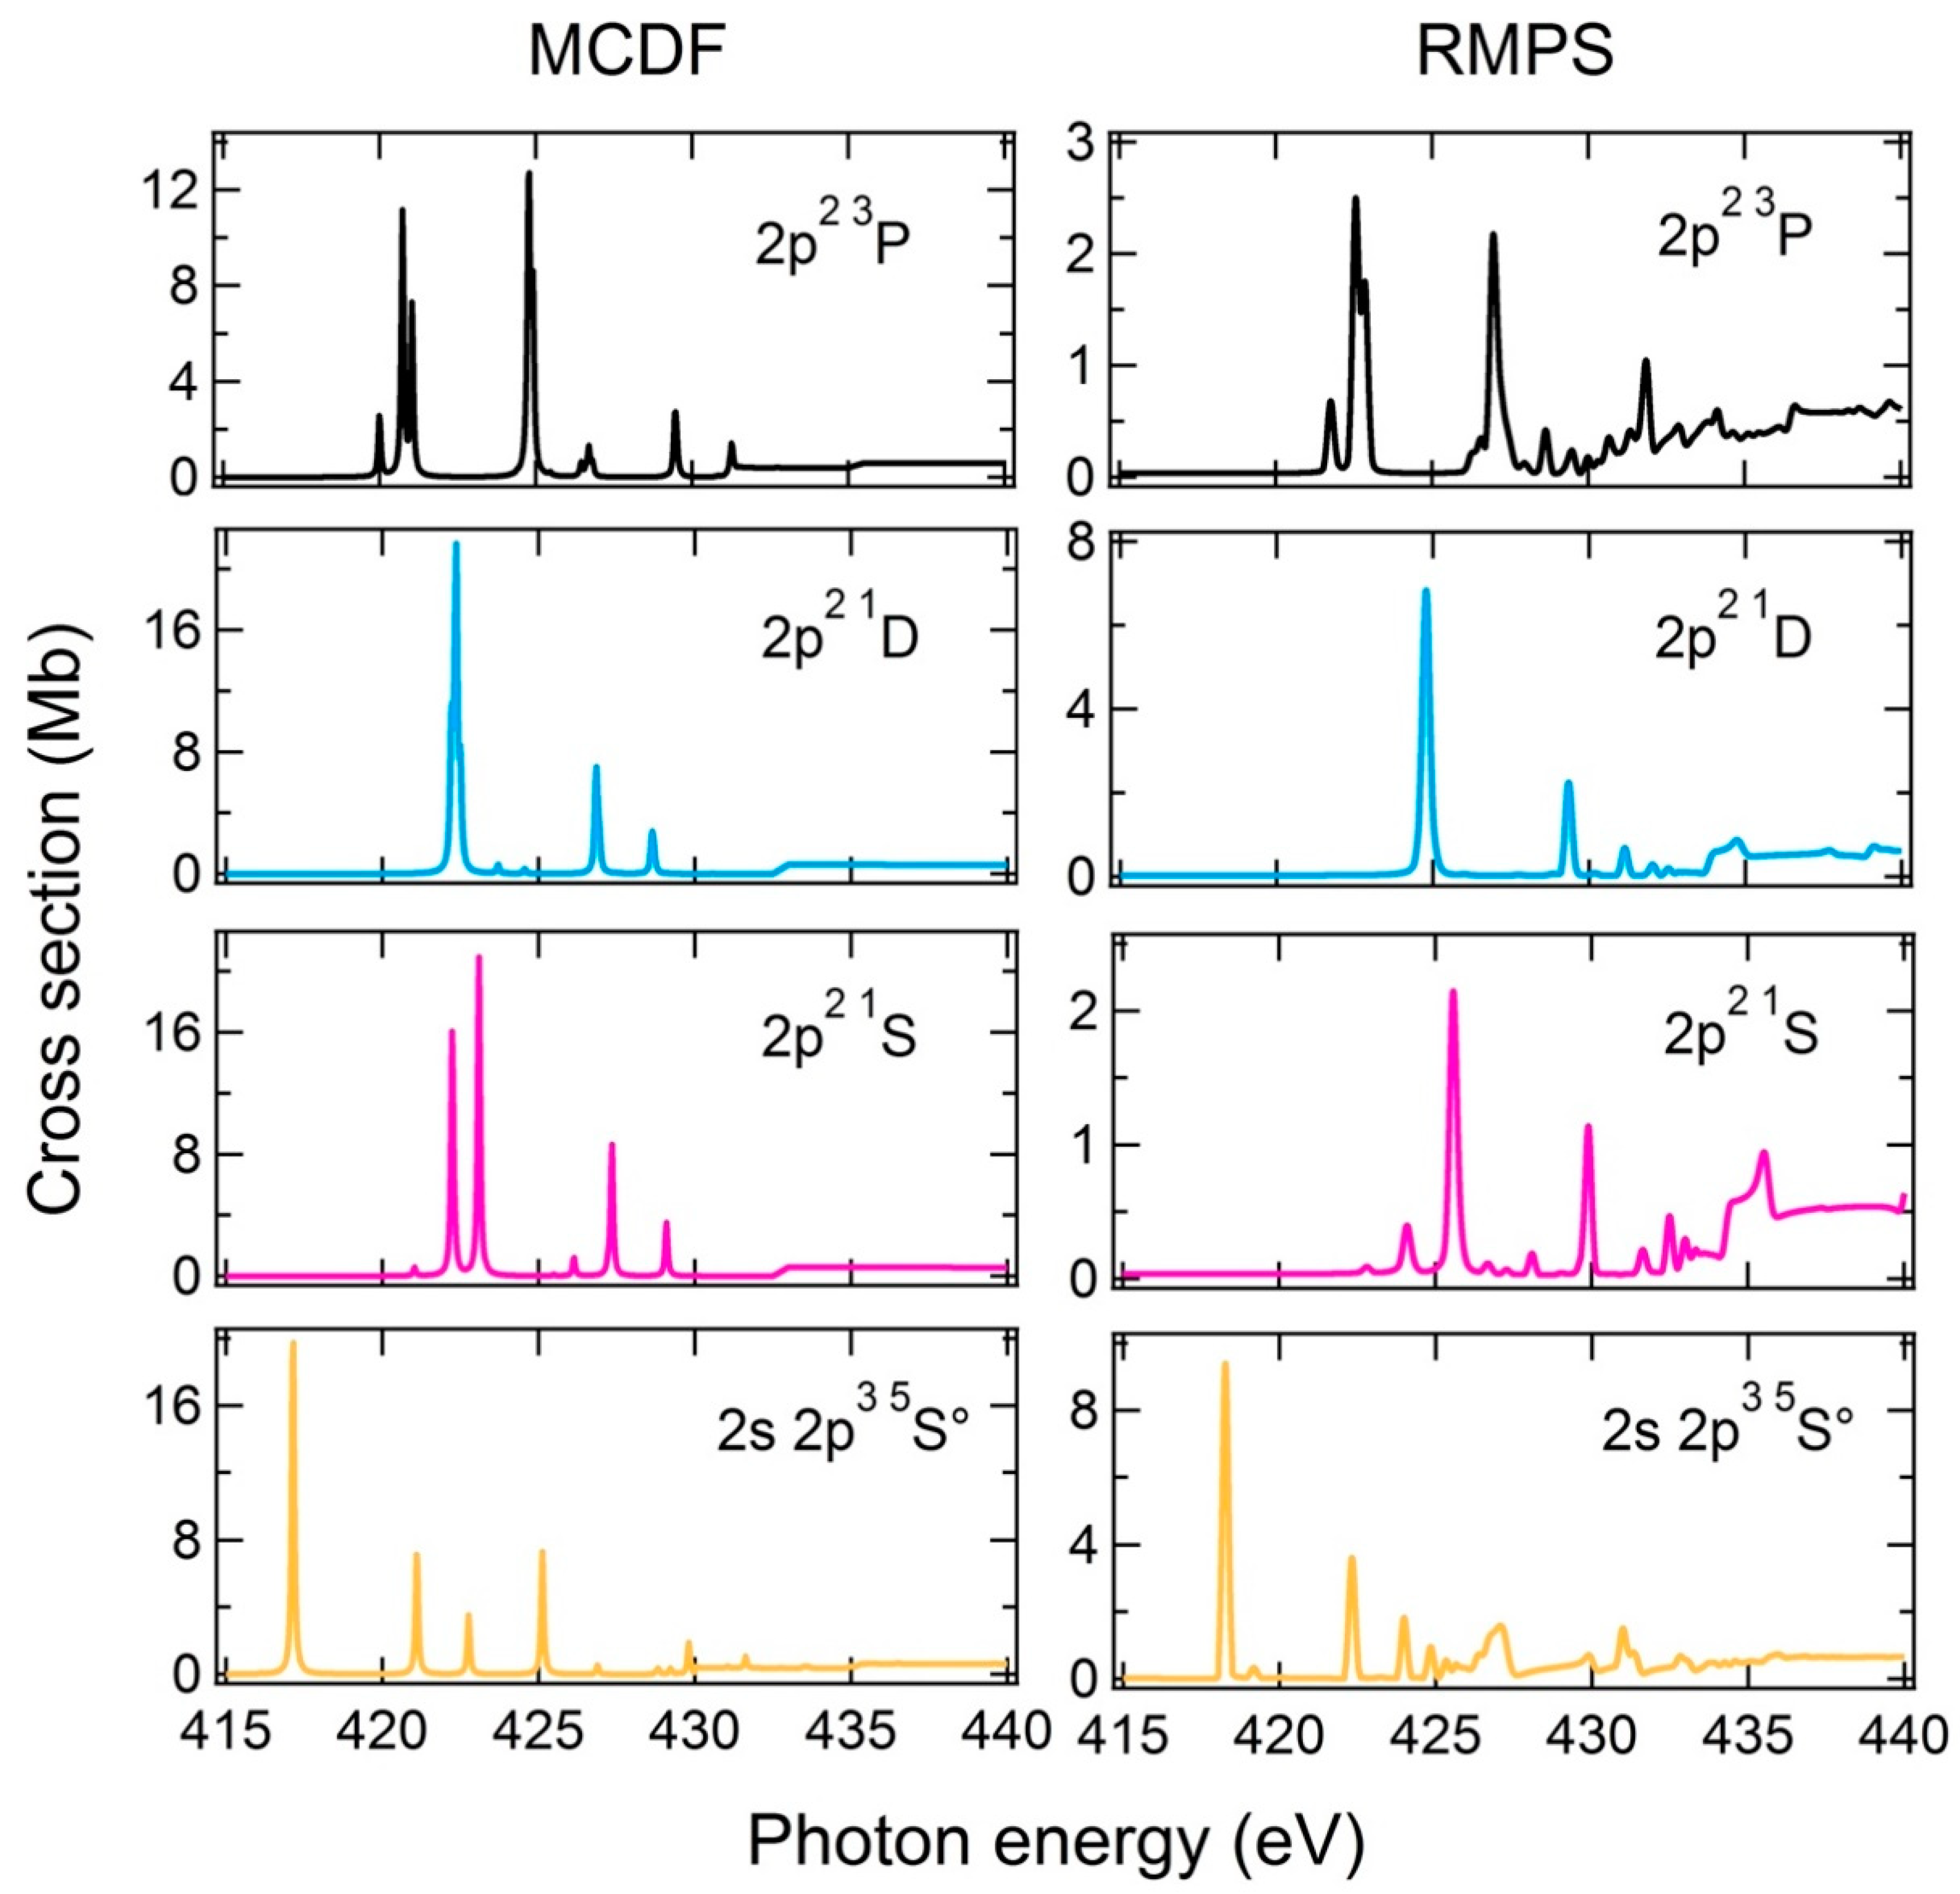
4.2. 1s → np (n ≥ 3) Resonances
5. Conclusions
Author Contributions
Funding
Acknowledgments
Conflicts of Interest
References
- Hasoglu, M.F.; Abdel-Naby, S.H.A.; Gorczyca, T.; Drake, J.J.; McLaughlin, B.M. K-shell photoabsorption studies of the carbon isonuclear sequence. Astrophys. J. 2010, 724, 1296–1304. [Google Scholar] [CrossRef]
- McLaughlin, B.M.; Bizau, J.-M.; Cubaynes, D.; Al Shorman, M.M.; Guilbaud, S.; Sahko, I.; Blancard, C.; Gharaibeh, M.F. K-shell photoionization of B-like oxygen (O3+) ions: Experiment and theory. J. Phys. B At. Mol. Opt. Phys. 2014, 47, 115201. [Google Scholar] [CrossRef]
- Bizau, J.-M.; Cubaynes, D.; Guilbaud, S.; Al Shorman, M.M.; Gharaibeh, M.F.; Ababneh, I.Q.; Blancard, C.; McLaughlin, B.M. K-shell photoionization of O+ and O2+ ions: Experiment and theory. Phys. Rev. A 2015, 92, 023401. [Google Scholar] [CrossRef] [Green Version]
- McLaughlin, B.M.; Bizau, J.-M.; Cubaynes, D.; Guilbaud, S.; Douix, S.; Al Shorman, M.M.; El Ghazaly, M.O.A.; Sakho, I.; Gharaibeh, M.F. K-shell photoionization of O4+ and O5+ ions: Experiment and theory. Mon. Not. R. Astron. Soc. 2017, 465, 4690–4702. [Google Scholar] [CrossRef]
- Mathur, S.; Nicastro, F.; Gupta, A.; Krongold, Y.; McLaughlin, B.M.; Brickhouse, N.; Pradhan, A. The O vi Mystery: Mismatch between X-Ray and UV Column Densities. Astrophys. J. 2017, 851, L7. [Google Scholar] [CrossRef] [Green Version]
- Leutenegger, M.A.; Kűhn, S.; Micke, P.; Steinbrűgge, R.; Stierhof, J.; Shah, C.; Hell, N.; Bissinger, M.; Hirsch, M.; Ballhasuen, R.; et al. High-Precision Determination of Oxygen Kα Transition Energy Excludes Incongruent Motion of Interstellar Oxygen. Phys. Rev. Lett. 2020, 125, 243001. [Google Scholar] [CrossRef] [PubMed]
- Stolte, W.C.; Jonauskas, V.; Lindle, D.W.; Sant’Anna, M.M.; Savin, D.W. Inner-shell photoionization studies of neutral atomic nitrogen. Astrophys. J. 2016, 818, 149. [Google Scholar] [CrossRef]
- Gharaibeh, M.F.; Bizau, J.M.; Cubaynes, D.; Guilbaud, S.; El Hassan, N.; Al Shorman, M.M.; Miron, C.; Nicolas, C.; Robert, E.; Blancard, C.; et al. K-shell photoionization of singly ionized atomic nitrogen: Experiment and theory. J. Phys. B At. Mol. Opt. Phys. 2011, 44, 175208. [Google Scholar] [CrossRef]
- Gharaibeh, M.F.; Hassan, N.E.; Al Shorman, M.M.; Bizau, J.-M.; Cubaynes, D.; Guilbaud, S.; Sakho, I.; Blancard, C.; McLaughlin, B.M. K-shell photoionization of B-like atomic nitrogen ions: Experiment and theory. J. Phys. B At. Mol. Opt. Phys. 2014, 47, 065201. [Google Scholar] [CrossRef]
- Al Shorman, M.M.; Gharaibeh, M.F.; Bizau, J.M.; Cubaynes, D.; Guilbaud, S.; El Hassan, N.; Miron, C.; Nicolas, C.; Robert, E.; Sakho, I.; et al. K-shell photoionization of Be-like and Li-like ions of atomic nitrogen: Experiment and theory. J. Phys. B At. Mol. Opt. Phys. 2013, 46, 195701. [Google Scholar] [CrossRef]
- Bari, S.; Inhester, L.; Schubert, K.; Mertens, K.; Schunck, J.O.; Dörner, S.; Deinert, S.; Schwob, L.; Schippers, S.; Müller, A.; et al. Inner-shell X-ray absorption spectra of the cationic series NHy+ (y = 0–3). Phys. Chem. Chem. Phys. 2019, 21, 16505–16514. [Google Scholar] [CrossRef] [Green Version]
- Schmidt, M.W.; Baldridge, K.K.; Boatz, J.A.; Elbert, S.T.; Gordon, M.S.; Jensen, J.H.; Koseki, S.; Matsunaga, N.; Nguyen, K.A.; Su, S.; et al. General atomic and molecular electronic structure system. J. Comput. Chem. 1993, 14, 1347–1363. [Google Scholar] [CrossRef]
- Liang, L.; Zhou, C. K-shell photoionization of Be-like nitrogen from the ground state: Energies and Auger widths of the high-lying double-excited states for N IV. Can. J. Phys. 2018, 96, 1183–1191. [Google Scholar] [CrossRef]
- Peng, Y.-G.; Wu, Y.; Zhu, L.-F.; Zhang, S.B.; Wang, J.-G.; Liebermann, H.-P.; Buenker, R.J. Complex multireference configuration interaction calculations for the K-vacancy Auger states of Nq+ (q = 2-5) ions. J. Chem. Phys. 2016, 144, 054306. [Google Scholar] [CrossRef] [Green Version]
- Bizau, J.M.; Cubaynes, D.; Guilbaud, S.; El Hassan, N.; Al Shorman, M.M.; Bouisset, E.; Guigand, J.; Moustier, O.; Marié, A.; Nadal, E.; et al. A merged-beam setup at SOLEIL dedicated to photoelectron–photoion coincidence studies on ionic species. J. Electron Spectrosc. Relat. Phenom. 2016, 210, 5–12. [Google Scholar] [CrossRef]
- Blancard, C.; Cubaynes, D.; Guilbaud, S.; Bizau, J.-M. Absolute Photoionization Cross Section for Fe6+ to Fe10+ Ions in the Photon Energy Region of the 2p-3d Resonance Lines. Astrophys. J. 2018, 853, 32. [Google Scholar] [CrossRef]
- Khalal, M.A.; Lablanquie, P.; Andric, L.; Palaudoux, J.; Penent, F.; Bučar, K.; Žitnik, M.; Püttner, R.; Jänkälä, K.; Cubaynes, D.; et al. 4d-inner-shell ionization of Xe+ ions and subsequent Auger decay. Phys. Rev. A 2017, 96, 013412. [Google Scholar] [CrossRef] [Green Version]
- Bizau, J.-M.; Cubaynes, D.; Guilbaud, S.; Penent, F.; Lablanquie, P.; Andric, L.; Palaudoux, J.; Al Shorman, M.M.; Blancard, C. Photoelectron Spectroscopy of Ions: Study of the Auger Decay of the 4d -> nf (n=4,5) Resonances in Xe5+ Ion. Phys. Rev. Lett. 2016, 116, 103001. [Google Scholar] [CrossRef] [PubMed]
- Mosnier, J.-P.; Kennedy, E.T.; van Kampen, P.; Cubaynes, D.; Guilbaud, S.; Sisourat, N.; Puglisi, A.; Carniato, S.; Bizau, J.-M. Inner-shell photoexcitations as probes of the molecular ions CH+, OH+, and SiH+: Measurements and theory. Phys. Rev. A 2016, 93, 061401. [Google Scholar] [CrossRef]
- Puglisi, A.; Miteva, T.; Kennedy, E.T.; Mosnier, J.-P.; Bizau, J.-M.; Cubaynes, D.; Sisourat, N.; Carniato, S. X-ray photochemistry of carbon hydride molecular ions. Phys. Chem. Chem. Phys. 2018, 20, 4415–4421. [Google Scholar] [CrossRef] [PubMed] [Green Version]
- Carniato, S.; Bizau, J.-M.; Cubaynes, D.; Kennedy, E.T.; Guilbaud, S.; Sokell, E.; McLaughlin, B.M.; Mosnier, J.-P. Vibrationally and Spin-Orbit-Resolved Inner-Shell X-ray Absorption Spectroscopy of the NH+ Molecular Ion: Measurements and ab Initio Calculations. Atoms 2020, 8, 67. [Google Scholar] [CrossRef]
- Sodhi Rana, N.S.; Brion, C.E. Reference energies for inner shell electron energy-loss spectroscopy. J. Elec. Spec. Rel. Phenom. 1984, 34, 363–372. [Google Scholar] [CrossRef]
- Kato, M.; Morishita, Y.; Oura, M.; Yamaoka, H.; Tamenori, Y.; Okada, K.; Matsudo, T.; Gejo, T.; Suzuki, I.H.; Saito, N. Absolute photoionization cross sections with ultra-high energy resolution for Ar, Kr, Xe and N2 in inner-shell ionization regions. J. Elec. Spec. Rel. Phenom. 2007, 34, 39–48. [Google Scholar] [CrossRef]
- Mosnier, J.-P.; Sayyad, M.H.; Kennedy, E.T.; Bizau, J.-M.; Cubaynes, D.; Wuilleumier, F.J.; Champeaux, J.-P.; Blancard, C.; Varma, R.H.; Banerjee, T.; et al. Absolute photoionization cross sections and resonance structure of doubly ionized silicon in the region of the 2p-1 threshold: Experiment and theory. Phys. Rev. A 2003, 68, 052712. [Google Scholar] [CrossRef] [Green Version]
- Cooper, J.W. New directions in the study of atomic autoionizing states. J. Elec. Spec. Rel. Phenom. 1994, 67, 223–231. [Google Scholar] [CrossRef]
- Kramida, A.; Ralchenko, Y.; Reader, J.; NIST ASD Team. NIST Atomic Spectra Database (ver. 5.8). 2020. Available online: https://physics.nist.gov/asd (accessed on 18 February 2021).
- Tachiev, G.; Froese Fisher, C. Breit-Pauli energy levels for the carbonlike sequence. Can. J. Phys. 2001, 79, 955–976. [Google Scholar] [CrossRef]
- Martins, M. Photoionization of open-shell atoms: The chlorine 2p excitation. J. Phys. B At. Mol. Opt. Phys. 2001, 34, 1321–1355. [Google Scholar] [CrossRef]
- Bruneau, J. Correlation and relaxation effects in ns2-nsnp transitions. J. Phys. B At. Mol. Opt. Phys. 1984, 17, 3009–3028. [Google Scholar] [CrossRef]
- Grant, I.P. Gauge invariance and relativistic radiative transitions. J. Phys. B At. Mol. Opt. Phys. 1974, 7, 1458–1475. [Google Scholar] [CrossRef]
- Slater, J.C. Quantum Theory of Molecules and Solids Vol. 4: The Self-Consistent Field for Molecules and Solids; McGraw-Hill: New York, NY, USA, 1974. [Google Scholar]
- Hasoǧlu, M.F.; Nikolić, D.; Gorczyca, T.W.; Manson, S.T.; Chen, M.H.; Badnell, N.R. Nonmonotonic behavior as a function of nuclear charge of the K-shell Auger and radiative rates and fluorescence yields along the 1s2s2p3 isoelectronic sequence. Phys. Rev. A 2008, 78, 032509. [Google Scholar] [CrossRef]
- Burke, P.G. R-Matrix Theory of Atomic Collisions: Application to Atomic, Molecular and Optical Processes; Springer: New York, NY, USA, 2011. [Google Scholar]
- Burke, P.G.; Berrington, K.A. Atomic and Molecular Processes: An R-Matrix Approach; IOP Publishing: Bristol, UK, 1993. [Google Scholar]
- Berrington, K.A.; Eissner, W.; Norrington, P.H. RMATRX1: Belfast atomic R-matrix codes. Comput. Phys. Commun. 1995, 92, 290–420. [Google Scholar] [CrossRef]
- Ballance, C.P.; Griffin, D.C. Relativistic radiatively damped R-matrix calculation of the electron-impact excitation of W46+. J. Phys. B At. Mol. Opt. Phys. 2006, 39, 3617–3628. [Google Scholar] [CrossRef]
- Robicheaux, F.; Gorczyca, T.W.; Pindzola, M.S.; Badnell, N.R. Inclusion of radiation damping in the close-coupling equations for electron-atom scattering. Phys. Rev. A 1995, 52, 1319–1333. [Google Scholar] [CrossRef] [PubMed]
- Quigley, L.; Berrington, K.A. The QB method: Analysing resonances using R-matrix theory. Applications to C+, He and Li. J. Phys. B At. Mol. Opt. Phys. 1996, 29, 4529–4542. [Google Scholar] [CrossRef]
- Quigley, L.; Berrington, K.A.; Pelan, J. The QB program: Analysing resonances using R-matrix theory. Comput. Phys. Commun. 1998, 114, 225–235. [Google Scholar] [CrossRef]
- Ballance, C.P.; Berrington, K.A.; McLaughlin, B.M. Detection and analysis of interloping molecular resonances. Phys. Rev. A 1995, 60, R4217(R). [Google Scholar] [CrossRef]
- Fano, U.; Cooper, J.W. Spectral Distribution of Oscillator Strengths. Rev. Mod. Phys. 1968, 40, 411. [Google Scholar] [CrossRef]
- Ferland, G.J. Quantitative Spectroscopy of Photoionized Clouds. Ann. Rev. Astron. Astr. 2003, 41, 517–554. [Google Scholar] [CrossRef]
- Ferland, G.J.; Korista, K.T.; Verner, D.A.; Ferguson, J.W.; Kingdon, J.B.; Verner, E.M. CLOUDY 90: Numerical Simulation of Plasmas and Their Spectra. Publ. Astron. Soc. Pac. 1998, 110, 761–778. [Google Scholar] [CrossRef]
- Bautista, M.A.; Kallman, T.R. The X-star Atomic Database. Astrophys. J. Suppl. 2001, 134, 139. [Google Scholar] [CrossRef]
- Foster, A.R.; Ji, L.; Smith, R.K.; Brickhouse, N.S. Updated Atomic Data and Calculations for X-ray Spectroscopy. Astrophys. J. 2012, 756, 128. [Google Scholar] [CrossRef] [Green Version]


| Experimental Parameter | Value |
|---|---|
| Photo-ion counting rate (s−1) | 1030 |
| Noise (s−1) | 60 |
| Ion beam velocity (ms−1) | |
| Photon brilliance (photons/0.1%BP) | |
| Ion current (nA) | 80 |
| Channel plates efficiency | 0.55 |
| Form factor | 13 |
| Resonance #Label | Measured Energy a (eV) | RMPS Energy (eV) | MCDF Energy (eV) | Experimental Width a,b (meV) | RMPS Width (meV) | MCBP/ MCDF Width (meV) [32] | Measured Strength a,c (MbeV) | Scaled Strength d,e (MbeV) | RMPS Strength f (MbeV) This Work | MCDF Strength g (MbeV) This Work |
|---|---|---|---|---|---|---|---|---|---|---|
| 1 | 399.840(2) | 399.709 | 399.275 | 73(11) | 124 | 171/181 | 5.7(1.8) | 7.6 | 10.1 | 14.5 |
| 2 | 399.994(26) | 399.891 | 400.488 | 167(70) | 62 | 1.4(8) | 34.1 | 16.2 | 22.9 | |
| x | x | 400.159 | 399.98 | 115 | 24.6 | 27.2 | ||||
| 3 | 400.728(2) | 400.579 | 400.094 | 79(9) | 78 | 33/79 | 8.6(2.5) | 11.5 | 6.8 | 9.8 |
| 4 | 400.862(9) | 400.681 | 400.199 | 116(24) | 105 | 2.9(1.0) | 14.9 | 18.0 | 26.8 | |
| 5 | 401.397(2) | 401.347 | 400.507 | 70(10) | 121 | 145/148 | 3.5(1.0) | 4.7 | 6.3 | 9.0 |
| 6 | 402.378(14) | 402.320 | 401.439 | 128(48) | 132 | 1.0(0.4) | 5.1 | 6.4 | 8.4 |
| Resonance #Label 1 | Transition |
|---|---|
| 1 | |
| 2 | |
| x | |
| 3 | |
| 4 | |
| 5 | |
| 6 |
| Main 1s Limits in N3+ | RMPS | MCDF | EXPT |
|---|---|---|---|
| 431.06 | 431.8 | 431.49 | |
| 436.23 | 435.49 | 436.32 | |
| 435.57 | 435.51 | 1 | |
| 438.20 | 439.20 | 1 |
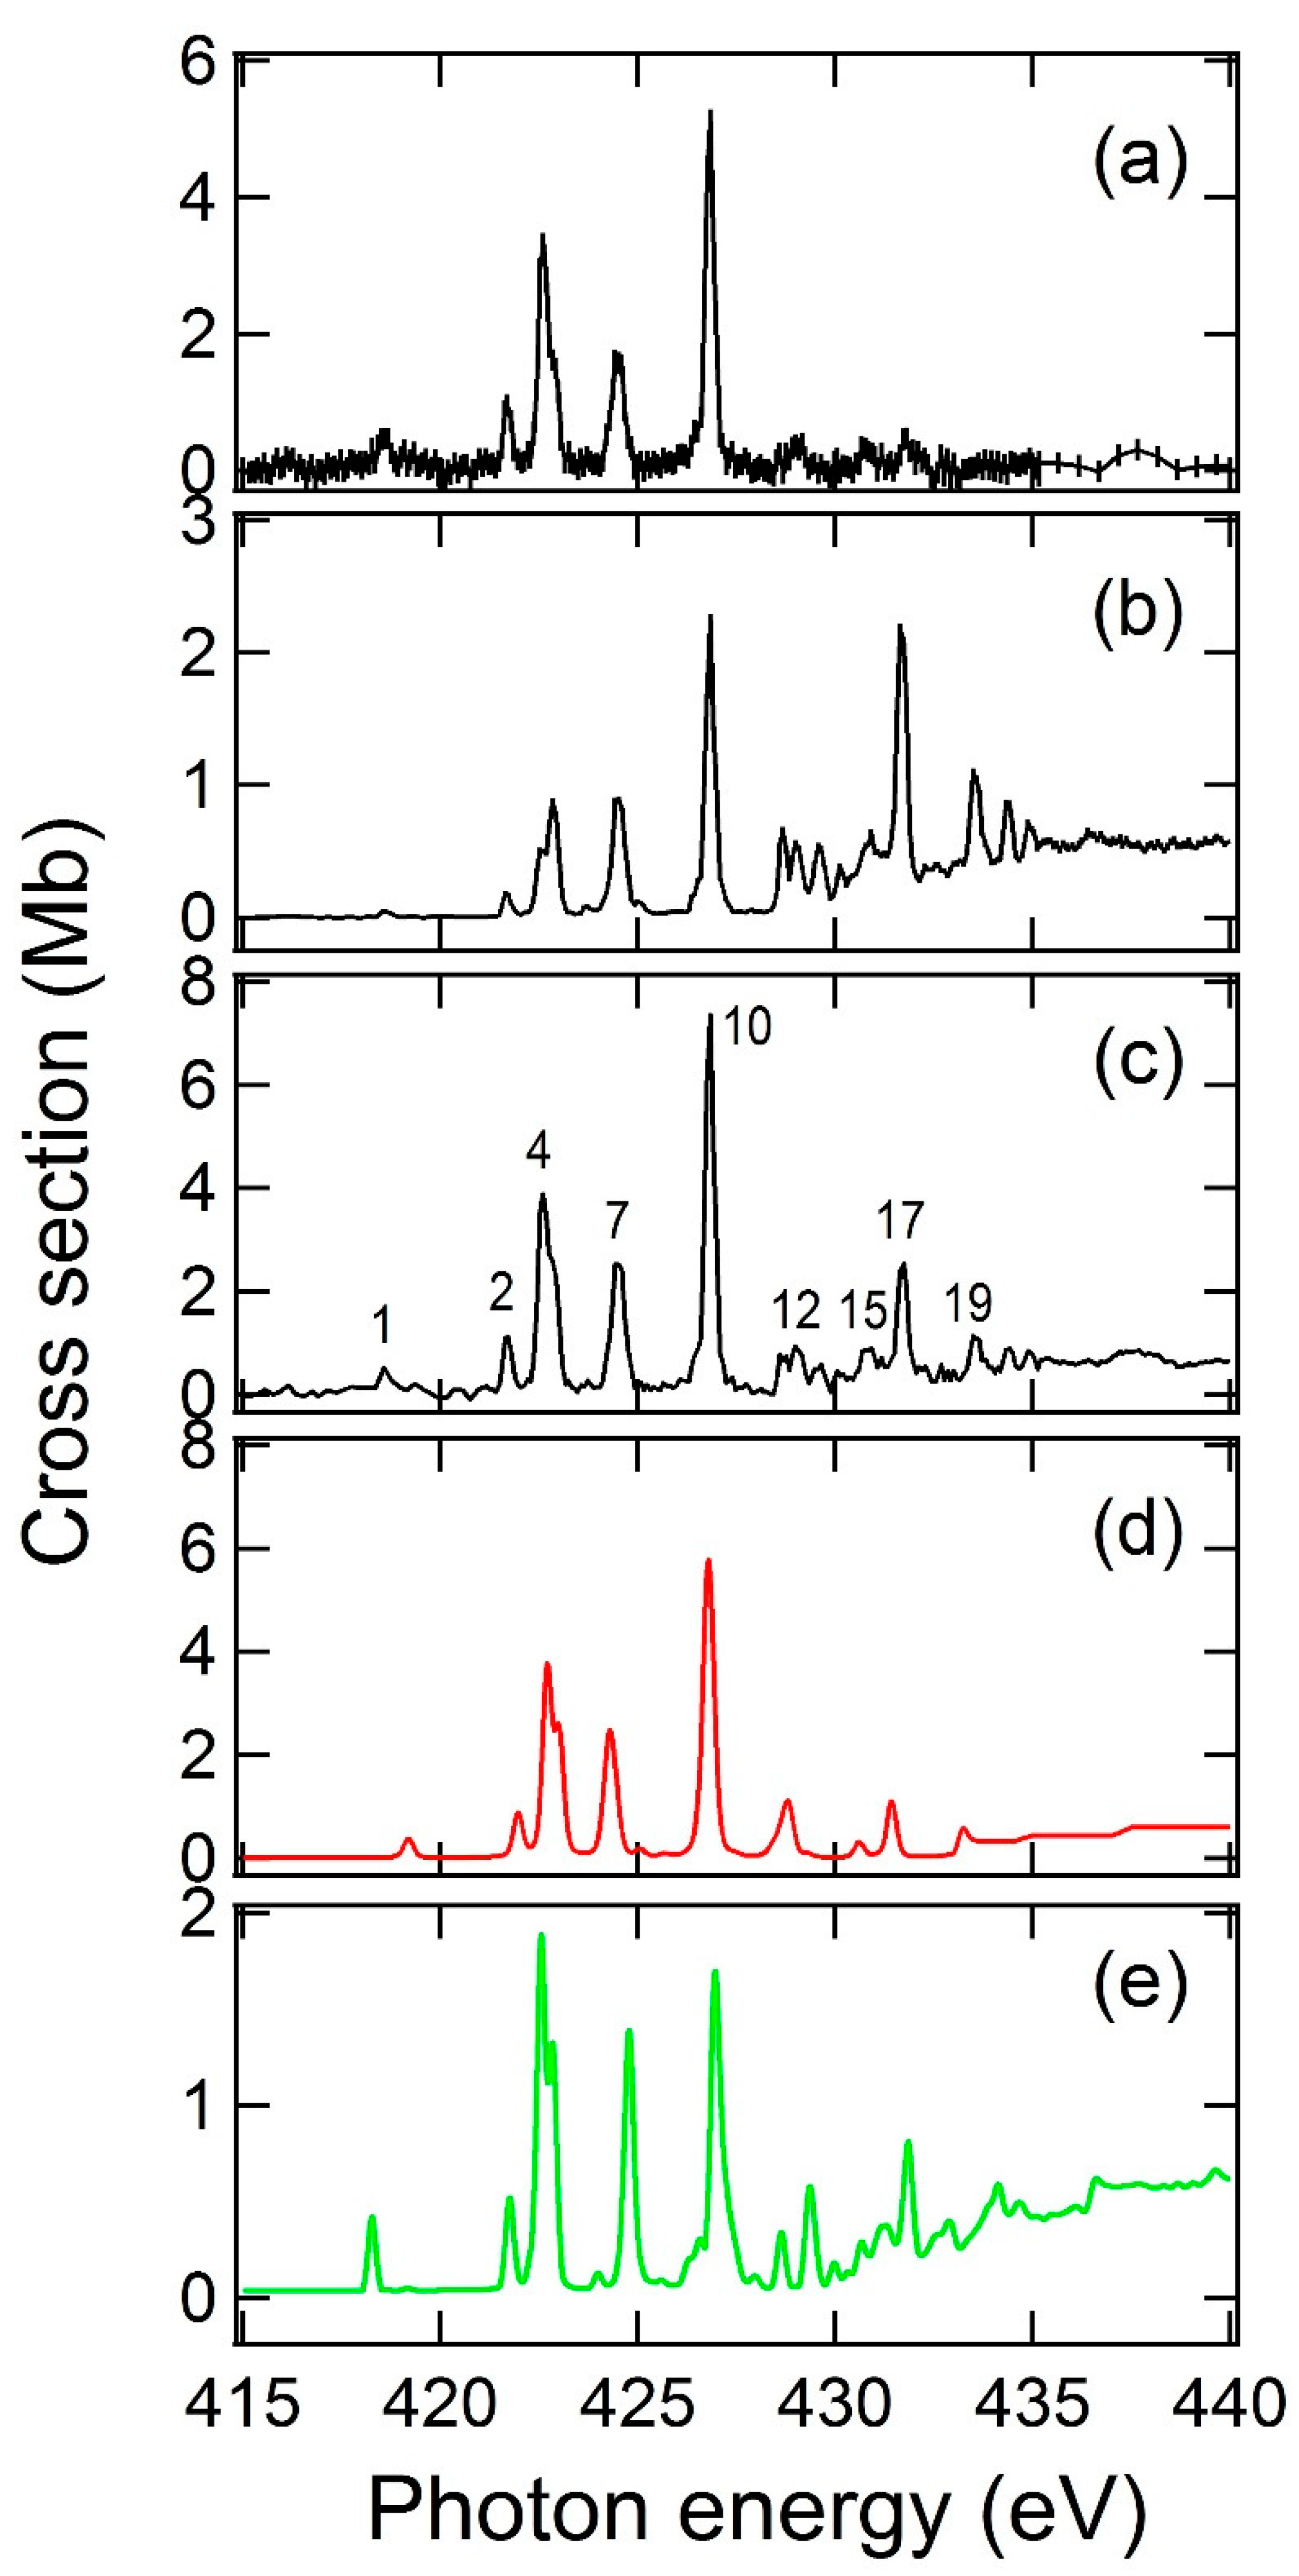
| Resonance #Label See Figure 5c | Single Ionization (SI) Channel Energy a (eV) | SI Channel Resonance Strength b (MbeV) | Double Ionization (DI) Channel Energy a (eV) | DI Channel Resonance Strength b (MbeV) | RMPS Photon Energy (eV) | MCDF Photon Energy c (eV) | Assignment |
|---|---|---|---|---|---|---|---|
| 1 | 418.53(3) | 0.16 | 418.53(3) | 0.03(1) | 418.26 | 419.14 | |
| 2 | 421.74(3) | 0.3(1) | 421.76(4) | 0.03 | 421.97 | 421.96 | |
| 3 d | 422.25(13) | ||||||
| 4 | 422.61(2) | 1.3(6) | 422.66(3) | 0.4(1) | 422.55 | 422.66 | |
| 5 | 422.96(7) | 0.5(4) | 422.97(1) | 0.22(6) | 422.84 | 422.95 | |
| 6 d | 424.13 | 424.13 | |||||
| 7 | 424.55 | 0.6(2) | 424.55 | 0.37(3) | 424.78 | 424.30 | |
| 8 | 425.99 | ||||||
| 9 d | 426.6 | 426.60 | |||||
| 10 | 426.88(1) | 1.6(3) | 426.97 | 426.66 | |||
| 10 | 426.92(1) | 0.76(3) | 426.78 | ||||
| 11 | 428.74(3) | 0.15 | 428.63 | 428.615 | |||
| 12 | 429.07(6) | 0.12 | 429.18 | 428.80 | |||
| 13 | 429.61(2) | 0.2 | 429.34 | 429.46 | |||
| 14 | 430.20(2) | 0.1 | e | ||||
| 15 | 430.81(5) | 0.25 | 431.13 | 430.57 | |||
| 16 d | 431.56(7) | 0.55 | |||||
| 17 | 431.72(1) | 0.45 | f | 431.40 | |||
| 18 d | 433.19 | ||||||
| 19 | 433.58(1) | 0.26 | f | 433.18 | |||
| 20 | 434.41 | 0.1 | f | 434.09 | |||
| 21 | 434.93 | 0.11 | e | ||||
| 22 | 435.32 | e | |||||
| 23 d | 435.63 | ||||||
| 24 d | 435.95 |
Publisher’s Note: MDPI stays neutral with regard to jurisdictional claims in published maps and institutional affiliations. |
© 2021 by the authors. Licensee MDPI, Basel, Switzerland. This article is an open access article distributed under the terms and conditions of the Creative Commons Attribution (CC BY) license (https://creativecommons.org/licenses/by/4.0/).
Share and Cite
Mosnier, J.-P.; Kennedy, E.T.; Bizau, J.-M.; Cubaynes, D.; Guilbaud, S.; Blancard, C.; McLaughlin, B.M. Photoionization Cross-Sections of Carbon-Like N+ Near the K-Edge (390–440 eV). Atoms 2021, 9, 27. https://doi.org/10.3390/atoms9020027
Mosnier J-P, Kennedy ET, Bizau J-M, Cubaynes D, Guilbaud S, Blancard C, McLaughlin BM. Photoionization Cross-Sections of Carbon-Like N+ Near the K-Edge (390–440 eV). Atoms. 2021; 9(2):27. https://doi.org/10.3390/atoms9020027
Chicago/Turabian StyleMosnier, Jean-Paul, Eugene T. Kennedy, Jean-Marc Bizau, Denis Cubaynes, Ségolène Guilbaud, Christophe Blancard, and Brendan M. McLaughlin. 2021. "Photoionization Cross-Sections of Carbon-Like N+ Near the K-Edge (390–440 eV)" Atoms 9, no. 2: 27. https://doi.org/10.3390/atoms9020027