
Abstract
The impact of changing surface condition on plasma dynamics and electron heating is investigated by means of numerical simulations, based on a semi-kinetic fluid model approach, and compared with measurements of the nanosecond electron dynamics in the plasma-surface interface region using phase resolved optical emission spectroscopy (PROES). The simulations are conducted in a one-dimensional domain and account for a geometrical asymmetry comparable to the experimental setup of a radio-frequency driven capacitively coupled plasma in a gaseous electronics conference reference cell. A simple reaction scheme is considered, including electrons,  positive ions,
  negative ions and
  metastable singlet delta oxygen (SDO) as individual species. The role of surface loss and effective lifetime of SDO is discussed. To simulate different surface conditions, the SDO surface loss probability and the secondary electron emission coefficient were varied in the model. It is found that a change in surface condition significantly influences the metastable concentration, electronegativity, spatial particle distributions and densities as well as the ionization and electron heating dynamics. The excitation dynamics obtained from simulations are compared with PROES measurements. This allows to determine experimentally relevant SDO surface loss probabilities and secondary electron emission coefficient values in-situ and is demonstrated for two different surface materials, namely aluminum and Teflon.
Export citation and abstract BibTeX RIS

Content from this work may be used under the terms of the Creative Commons Attribution 3.0 licence. Any further distribution of this work must maintain attribution to the author(s) and the title of the work, journal citation and DOI.
For more information on this article, see LabTalk
1. Introduction
Non-equilibrium capacitively coupled plasmas (CCP) at low pressure are well established in many technological applications, particularly for etching and deposition processes in the semiconductor industry. The increasing complexity of industrial plasma processing of nano-structures demands new strategies for process control and monitoring. The energy transport mechanisms in the plasma-surface interface region are of particular importance, because they can have a significant effect on the process outcome. Without detailed comprehension of power dissipation mechanisms under industrially relevant conditions, plasma processes can only be optimized empirically, but not predictively on a scientific basis. The measurement of in-situ surface conditions, which strongly affect the plasma-surface interaction, is therefore of key importance but extremely challenging. In general, surface conditions are difficult to quantify experimentally and theoretically and represent a large uncertainty in modern technological applications. Particularly, the surface loss probability of radical and metastable particles [1–3] and the secondary electron emission through impacting ions can strongly influence the plasma [4, 5].
New concepts for advanced process control and plasma monitoring have been developed based on the combination of numerical simulations and plasma diagnostics [6–12]. These approaches provide not only more accurate results, but also give the opportunity to gain information on important surface processes involving radical and metastable species for different discharge conditions as will be shown. This information can then be used to obtain the optimal operational conditions under which the composition of these species can be tailored for a specific application.
In numerical simulations, the plasma-surface interaction processes involving particle surface loss probabilities and secondary electron emission are often neglected or based on unrealistic concepts. Here, we present a one-dimensional numerical study of a capacitively coupled oxygen RF discharge, where the surface loss probability of metastable molecular oxygen (SDO) and the secondary electron emission coefficient is varied to investigate the corresponding impact on the plasma dynamics. Subsequently, we discuss how the measurement of the plasma dynamics in combination with the numerical simulation can be used as an in-situ method for determining the actual surface condition.
2. Numerical simulation
A self-consistent one-dimensional (1D) fluid model, including a semi-kinetic treatment of electrons and an improved treatment of ion mobilities is applied. The model and its applicability in the investigated pressure regime are described in detail in [13]. However, the model used in this work incorporates an extended reaction scheme which includes metastable molecular oxygen as individual species to account appropriately for its surface and volume losses. This approach combines the specific advantages of both fully-kinetic and fluid-only simulations, accounting for a local non-Maxwellian electron energy distribution function (EEDF) and a computationally efficient treatment of heavy-particles. The two-term approximation Boltzmann solver BOLSIG+ [14] is used to calculate, in advance, the following quantities for a sequence of reduced electrical field values: (non-Maxwellian) EEDF, mean electron energy, electron mobility and diffusion coefficients, and electron-impact reaction rates, all on the basis of recommended cross-section data for the elastic and dominant inelastic collision processes. The resulting data is then implemented in the form of look-up tables into the fluid model to account for the individual spatial and temporal dependence of each quantity in a computationally efficient way.
2.1. Geometric considerations
The 1D numerical simulation aims to describe a capacitively coupled RF plasma across a 40 mm electrode gap, which is generated in an inductively coupled gaseous electronics conference (GEC) reference cell [15] by grounding the top coil (normally powered) and powering the standard (not extended) lower electrode (normally grounded). The plasma exhibits a geometrical asymmetry, since the whole grounded chamber wall acts as an additional, comparably far away, but large electrode surface. In the simulation the actual electrode geometry (complex, but of cylindrical symmetry) is approximated by spherical shell segments according to Lieberman et al [16], as illustrated in figure 1. This approximation offers the significant computational advantage of reducing the calculation to the axial dimension (spherical r-coordinate) only, since the plasma is radially homogeneous (spherical  and
and  coordinates) with respect to the central discharge axis.

Figure 1. Illustration of discharge geometry in the spherical shell model approximation.
Download figure:
Standard image High-resolution imageThe powered electrode is located at  from the center of the sphere, the grounded electrode is situated at
  , thus exhibiting an overall larger effective surface area than the powered electrode. The asymmetry is given by the ratio of both electrode surface areas (
 ,
,  ) and was chosen to be
  , which is a reasonable assumption for the standard GEC reference cell based on the actual chamber geometry and the experimental observations. The dc self-bias as a result of the asymmetry is deduced self-consistently from the balance of the charged particle wall losses.
2.2. Model and reaction scheme
Detailed information on the governing equations as well as the used boundary conditions can be found in [13]. The species accounted for in the model are electrons ( ), the molecular oxygen background gas (
 ), positive molecular oxygen ions (
 ), negative atomic oxygen ions (
 ) and singlet delta molecular oxygen (
 ), the latter abbreviated as SDO. The background gas temperature is assumed to be 300 K.
Here, we want to emphasize that SDO is explicitly included as individual fluid species. This allows for a systematic study of the effect of the SDO surface loss probability on both the SDO density and the corresponding discharge dynamics. This is in contrast to commonly used approaches which either assume a fixed SDO density (e.g. 12% Gudmundsson et al [17] or 16.6% Bronold et al [18]) or a fixed surface loss probability (e.g. Gudmundsson et al [19, 20], Tinck and Bogaerts [21] or Rajendiran et al [22]). In order to assume a fixed SDO density the surface-to-volume ratio and the SDO surface loss probability must be estimated, although the value of the latter quantity is typically not well known.
The reaction scheme used, listed in table 1, results from an analysis of several detailed reaction schemes [23, 24] and takes into account the dominant species under the investigated conditions [25]. Reactions R1 to R8 describe electron momentum transfer (R1), dominant charged heavy particles volume production processes (R2 and R4) as well as their electron-induced destruction (R3, R5). Heavy particle interaction is described by ion neutralization (R6) and associative detachment (R7, R8). For the explicit treatment of SDO, the dominant collisional processes are added in the form of reactions R9–R14: Electron momentum transfer (R9), the main volume production reaction (R10), and volume destruction through collisions with electrons (R11–R14). Collisions with negative ions are already included in R8. The latter set of reactions includes the production of negative atomic oxygen ions and positive molecular oxygen ions as well as de-excitation and dissociation of SDO into ground state and excited atomic oxygen. This allows for a self-consistent calculation of the SDO density in the investigated parameter regime. We neglect atomic oxygen in the model as another negative ion destruction channel considering a comparable rate coefficient as in case of SDO [26], and reported atomic oxygen number densities of at least one order of magnitude lower than for SDO in a very similar experimental set up [27]. The reaction rate coefficient for R8 has recently been revised towards slightly smaller values by two independent groups. Belostotsky et al report a value of  m
m s
s [26], and Midey et al report a value of
  m
m s
s [28] with an almost linear temperature dependence [29]. All three reported values agree within the combined uncertainties of the rate constant measurements.
Table 1. Elementary reactions and corresponding rate coefficients.
| No. | Reaction | Rate coefficient |
Reference |
|---|---|---|---|
| R1 |  |
 |
[14] |
| R2 |  |
 |
[14] |
| R3 |  O O |
 ) ) |
[30] |
| R4 |  |
 |
[31] |
| R5 |  |
 |
[18] |
| R6 |  |
 |
[32] |
| R7 |  |
 |
[32] |
| R8 |  |
 |
[24] |
| R9 |  |
 ) ) |
[24] |
| R10 |  |
 ) ) |
[24] |
| R11 |  |
 ) ) |
[24] |
| R12 |  |
 ) ) |
[24] |
| R13 |  |
 ) ) |
[24] |
| R14 |  |
 ) ) |
[24] |
aUnits: Rate coefficients in m s
s ; gas temperature
  in K; relative gas temperature
  .
b
.
b ) indicates that the rate coefficients are obtained from the EEDF calculated with Boltzmann solver BOLSIG + using cross section data. Additionally, electron-impact excitation of
  into rotational, vibrational and metastable states is accounted for in the EEDF calculation.
c
into rotational, vibrational and metastable states is accounted for in the EEDF calculation.
c denotes O atoms in the ground state or in the excited
  and
and  states, respectively.
The used transport coefficients are listed in table 2. The values for mobility  and diffusion coefficient
  are given for zero electric field
  , constant gas temperature of
  K and constant oxygen background gas pressure of
  Pa. In the regions of high electrical field above
  Td, like the sheath regions [33], the mobilities are scaled down from the zero field value
  according to the rigid sphere model (
 ). In the low field region
  Td, experimentally measured ion mobilities are used [34]. The combination of electric field dependent ion mobilities, the generalized Einstein relation [35] and Wannier's formulation [36] allow for a relatively simple extension of the fluid model for the high values of
  present in the plasma sheath while avoiding the complexity of incorporating the full ion energy equation. The validity and limits of this approach are discussed in [13].


2.3. SDO surface loss
To calculate the effects of the surface loss on the local SDO densities in the simulations, diffusion theory is applied using the concept of a 'linear extrapolation length' derived by Chantry [37] under the assumption that  :
:
Here,  is the SDO specific surface loss probability,
  the thermal velocity and
  the density of SDO.
An actual value for the SDO surface loss probability at the chamber walls is very difficult to assess either experimentally or theoretically. Generally, the loss probability for any species hitting the chamber walls depends not only on the specific species itself, but also on the surface material, temperature, or roughness, which can vary substantially. The literature value for the SDO surface loss probability varies over several orders of magnitude from  [32] to
  [38]. To analyze the fundamental influence of the SDO surface loss probability on the plasma dynamics, it was varied in the model over the reported range.
3. Results
In this section 1D simulation results for a capacitively coupled electronegative oxygen plasma with a discharge gap of 40 mm are presented. In the investigated parameter regime ( –100 Pa,
  –500 V amplitude,
  MHz) we find similar quantitative trends [39]. In the following, we exemplarily discuss the results obtained for a pressure of 40 Pa and a voltage amplitude of 300 V. Emphasis is put on the impact of the SDO surface loss probability and the secondary electron emission coefficient on the plasma dynamics and electron heating. At first, we discuss the effective SDO lifetime and present general trends of the resulting electronegativity and SDO content for a wide range of SDO surface loss probabilities. Secondly, two different SDO surface loss probability values were chosen, the corresponding spatial distributions of the charged particles, and the phase and space resolved ionization process rate are examined and compared. Thirdly, the dependence of the charged species densities on both the SDO surface loss probability and secondary electron emission is analyzed. Next, the impact on collisional and collisionless electron heating is discussed. Finally, excitation features for different SDO surface loss probabilities and secondary electron emission coefficients are simulated in order to select the one that matches the experimentally obtained excitation features most appropriately. We believe that the resulting values describe the actual surface condition in qualitative and effective terms that are relevant for technological plasma process control.
3.1. Effective SDO lifetime
The natural radiative lifetime of SDO is 64.4 min ( 3900 s) and it is therefore often assumed that SDO has no effect on the fast plasma dynamics within the RF cycle [40]. This includes that changes in the surface loss probability are usually believed to have no significant influence on the plasma dynamics. This is true for recombination dominated discharges as treated in the literature by Lichtenberg et al [41, 42] or Gudmundsson et al [17, 43]. However, in the present case of a detachment dominated discharge, in which SDO is the main collision partner for negative ions, that assumption is not valid.
The effective SDO lifetime, i.e. the reduction of the natural lifetime due to loss processes, is mainly determined by two processes, namely wall losses and volume destruction through electrons and negative ions. Figure 2 shows the surface and volume averaged effective SDO loss rates as a function of the actual SDO surface loss probability on a double logarithmic scale.

Figure 2. Effective SDO loss rate in the plasma volume and at the surface. ( Pa,
Pa,  V).
V).
Download figure:
Standard image High-resolution imageThe effective SDO volume loss rate increases monotonically from 1 s to about 2.5 s
 for high SDO surface loss probabilities, which corresponds to an effective lifetime of 400 ms. This is more than three orders of magnitudes lower than the natural lifetime. The trend of increasing effective loss rates is due to increasing negative ion densities that contribute to the volume loss of SDO.
The effective SDO surface loss rate exhibits an over-linear dependence on the SDO surface loss probability. The maximum effective loss rate, following the volume losses trend and a SDO surface loss probability of  , can be estimated as 250 s
 , which would correspond to an effective lifetime of 4 ms. Nevertheless, even for the lowest considered SDO surface loss probability and respective volume loss rate the effective lifetime at the surfaces is still considerably shorter than the natural lifetime.
The SDO volume loss rate for an SDO surface loss probability of  is illustrated in figure 3.

Figure 3. SDO volume loss rate due to destruction processes through electrons and negative ions. ( Pa,
Pa,  V, powered electrode at
  ).
).
Download figure:
Standard image High-resolution imageThe SDO volume loss rate distribution is slightly asymmetric due to the geometric asymmetry of the discharge and follows the combined electron and negative ion spatial distributions. In the plasma bulk, where volume processes are dominant, the loss rate lies above 1 s . Towards the plasma sheath edges these volume processes become less dominant, so that the effective loss rate decreases in the sheath regions. Within the sheath region free diffusion, which subsequently leads to a wall loss, becomes the dominant SDO destruction process.
Although, the effective SDO lifetime changes significantly, the SDO distribution across the discharge gap can practically be regarded as homogeneous, apart from a marginal drop in the close vicinity of the electrodes. Accordingly, the SDO loss rate is relatively small so that the effective lifetime is still long enough (thousands of RF cycles) to allow a build-up of significant SDO densities in  discharges as observed experimentally [27] and theoretically [1]. Nonetheless, due to the relatively small effective SDO lifetime, SDO densities can respond to surface changes on a timescale below seconds that are likely to occur in plasma processing applications.
3.2. General trends
It was found that the SDO surface loss probability has a major impact on the electronegativity, which is defined here as ratio of global negative atomic oxygen ion density versus electron density ( ), as well as on the global SDO concentration, as shown in figure 4. Here, the SDO surface loss probability was varied from
  to
to  to cover the range of literature values (see section 2.3), while the secondary electron emission coefficient was kept constant at
  .
.

Figure 4. Dependence of global SDO content and electronegativity on SDO surface loss probability. ( Pa,
Pa,  V,
V,  ). Reprinted with permission from [39] Greb et al 2013 Appl. Phys. Lett. 103 244101. Copyright 2013, AIP Publishing LLC.
Download figure:
Standard image High-resolution imageThe electronegativity shows a clear dependence on the SDO surface loss probability, significantly increasing with the SDO surface loss probability. This is due to the dominant volume destruction of  through SDO, whereas the electron density stays approximately constant (see figure 5(a)).

Figure 5. Global particle densities of (a) electrons, (b) negative atomic oxygen ions, and (c) positive molecular oxygen ions as a function of SDO surface loss probability and secondary electron emission coefficient  (
( ). Arrows indicate the direction of strongest correlation. (
 Pa,
Pa,  V).
V).
Download figure:
Standard image High-resolution imageThe SDO content shows the opposite trend, significantly dropping from about 15% (at  ) to below 1% (at
  ). This can be explained (qualitatively) when considering the global SDO particle balance:
where  is the reaction rate coefficient of the dominant SDO production channel (
 ),
),  the SDO surface loss rate, and
  the effective SDO lifetime mainly due to SDO volume loss processes. The first term in the bracket (on RHS of equation (2)) stays approximately constant independent of the SDO surface loss probability in the investigated parameter space. Generally, the SDO content follows the trend governed by effective SDO volume loss rate, as shown in figure 2, expressed in terms of the effective SDO lifetime. However, this trend is further strongly enhanced by the flux gradient
  , which is equivalent to the second derivative of the density profile. Here, the SDO flux gradient is always positive and increases over-linearly with the surface loss probabilities. For an ideally homogeneous SDO distribution without density gradient (
 ), the SDO content would only drop to about 6% in case of an SDO surface loss probability of
  . However, due to the additional contribution from the flux gradient it drops to an almost 15 times smaller value of 0.45%. This makes the flux gradient the dominant factor determining the SDO content in the discharge for increasing SDO surface loss probabilities (
 ).
).
Typically, the SDO content is assumed to be within the range of about 12%–17% for stainless steel or aluminum electrodes on the basis of an SDO surface loss probability of  [38, 44]. In contrast, our simulations imply an SDO surface loss probability of below
  for our particular system.
3.3. Global densities of charged species
In the case of a changing surface condition, e.g. occurring withing a plasma treatment step, it is justified to assume that not only the SDO surface loss probability but also the secondary electron emission coefficient will change. In the simulations, we therefore also varied the value of the secondary electron coefficients within the range from 0 to 0.2. This range is motivated by a semi empirical formula, which takes into account the ionization threshold of the impacting ion and the work function of the material [16]. It was found, as expected, that the secondary electron emission coefficient affects the global electron density and, as will be shown later, the spatio-temporal ionization features within the sheath region.
Figure 5 shows the global density of the different charged particles as a function of the SDO surface loss probability and the secondary electron emission coefficient  (
( ). Arrows indicate the direction of strongest dependence. The global electron density mainly depends on
  (
( ), see figure 5(a), especially at higher SDO surface loss probabilities. SDO is affecting the densities of the negative atomic ions and subsequently the positive molecular ions in the sheath regions, rather than the global bulk-dominated electron density. The density of negative ions, see figure 5(b), increases with increasing SDO surface loss probability by almost a factor of 5. This reflects the dominant role of SDO in the destruction of
  as described in section 3.2. The
  density, shown in figure 5(c), exhibits a mixed correlation (indicated by the tilted arrow), since both changes in negative ion density and electron density have to be compensated for sustaining quasineutrality in the plasma bulk region.
3.4. Spatial distribution of charged particles and ionization features
The impact of the surface condition on the spatial distribution of the charged particles is discussed by comparing the corresponding simulation results obtained for two different SDO surface loss probabilities:  and
and  . In contrast to the spatial homogeneity of the SDO distribution, the global SDO content varies significantly, see figure 4. For the considered pressure of 40 Pa, an SDO surface loss probability of
  corresponds to an SDO content of 11.8%, whereas for the larger surface loss probability of
  the SDO concentration is significantly smaller with 3.6%.
Figure 6 shows the time-averaged spatial profiles of the electron and ion densities for both SDO surface loss probability values, while keeping the secondary electron emission coefficient equal to 0.05. The corresponding values for the global SDO content and the global electronegativity (denoted as en) are indicated, respectively.
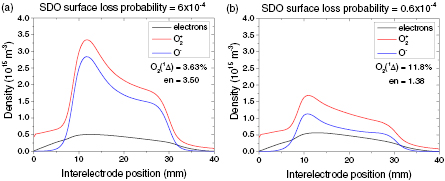
Figure 6. Time averaged spatial distribution of electrons,  and
and  for SDO surface loss probability of (a)
  and (b)
  , en denotes the global electronegativity. (
 Pa,
Pa,  V,
V,  ).
).
Download figure:
Standard image High-resolution imageIn both cases the ion density distributions exhibit a similar shoulder-like structure with a maximum near the powered electrode, as expected for an asymmetric discharge. The mean electron density distribution is found rather flat and almost independent of the SDO surface loss probability, whereas the negative ion density increases with increasing surface loss probability. The overall increased negative charge density is balanced by an increased positive molecular oxygen ion density. Since the electron density stays almost constant, while the charged negative particle densities increase, the electronegativity of the system increases. The found global electronegativity values of  and
and  are in reasonable agreement with independent measurements [27, 45] in view of the differences in discharge design and operational parameters.
Apart from the spatial distributions the ionization features are also affected by the SDO surface loss probability. Figure 7 shows the phase and space resolved direct electron-impact ionization rate of  (R2, table 1) for two different SDO surface loss probability values. The abscissa covers a full RF cycle (
 73.75 ns) and the ordinate the whole inter-electrode gap, from powered electrode at the bottom to the grounded electrode at the top. The roman letters in figure 7 denote the expected three distinct ionization features associated with: (I) sheath expansion, (II) sheath collapse and (III) induced by secondary electrons which are released from the surface due to ion impact. The sheath edge positions, as obtained according to the 'equivalent sharp electron step criterion' [46], are indicated by white dashed lines.

Figure 7. Phase and space resolved electron-impact ionization rate of  (
( m
m s
s ) for SDO surface loss probability of (a)
  and (b)
  on a common false color scale. Dashed lines indicate the sheath edge positions. (
 Pa,
Pa,  V,
V,  ).
).
Download figure:
Standard image High-resolution imageSince the gamma coefficient is kept constant in both figures 7(a) and (b), the contribution of secondary electrons (feature III) to the total ionization stays practically the same, keeping in mind that the electron density in the sheath regions (at the same background gas density) is similar for both cases and not affected by negative ions, because those are effectively confined in the plasma bulk (compare with figure 6). In particular, the weighting of the two ionization features during the sheath expansion and sheath collapse phases, apart from their individual spatio-temporal position and shape, turns out to depend strongly on the SDO surface loss probability. For low SDO surface loss probability the dominant ionization takes place during the sheath expansion phase (feature I). With increasing SDO surface loss probability the magnitude of the sheath expansion feature (I) remains approximately the same, while the sheath collapse feature (II) becomes more significant. This trend reflects the increase in global electronegativity, which leads to a correspondingly deeper extension of the ionization features into the plasma bulk, as also shown in [47, 48].
3.5. Electron heating mechanisms
We analyzed the impact of the SDO surface loss probability and secondary electron emission coefficient on the electron heating mechanisms in the plasma. For this purpose, we follow a similar approach to that of Lafleur et al [49] in determining the contributions of collisional (ohmic) and collisionless (in this case pressure induced) electron heating. As discussed in [13], the drift-diffusion approximation for electron momentum conservation ( ) is valid under the investigated conditions. Rearranging this equation for the electric field,
  , and multiplying by the electron conduction current density (
 ) gives an expression for the instantaneous mean power absorbed by electrons per unit volume:
Substituting  and
and  gives the following expression:
where  is the dc conductivity of the plasma [16].
  denotes the electron temperature,
  the Boltzmann constant,
  the electron momentum transfer collision frequency, and
  is the mean electron velocity. The first term in equations (3) and (4) (being proportional to
  ) represents collisional (or ohmic) electron heating. The second term, proportional to the electron density gradient, reflects collisionless heating occurring through the compression or pressure heating of the electron fluid [50, 51].
Figure 8 shows (a) the collisional and (b) the collisionless time averaged and space integrated electron heating power density in dependence of SDO surface loss probability and secondary electron emission coefficient as calculated by equation (3). It is evident that collisional heating is the dominant time averaged and space integrated electron heating mechanism, far exceeding the collisionless heating for all investigated combinations of SDO surface loss probability and secondary electron emission coefficient. This is consistent with the results of independent investigations carried out in the same pressure regime [49, 52, 53]. Both electron heating mechanisms exhibit a similar increasing trend with increasing secondary electron emission coefficient. This is due to the fact that the electron density increases as well, as shown in figure 5(a). In the case of collisional heating, this allows for higher conduction current densities and therefore higher power absorption. For collisionless heating, the important factor is the gradient in the electron density at the plasma sheath edge (see figure 6). This gradient necessarily increases at higher bulk electron densities, as a greater increase in electron density must occur in the sheath edge region. However, for constant secondary electron emission coefficient, the collisional and collisionless heating show opposing trends with regard to a change in SDO surface loss probability. Collisional heating increases, whereas collisionless heating decreases with increasing SDO surface loss probability. The increase in collisional heating occurs because the sum of all charged particle fluxes onto the electrodes must be equal. As the negative ions are largely confined to the plasma bulk, the electron flux must compensate the positive ion flux at the electrodes over the RF cycle. Since the positive ion density increases significantly as the SDO surface loss probability is increased and the electron density remains almost constant (see figures 5(a) and (c)), the mean electron velocity increases on average, to compensate the higher positive ion flux. As a result, the current density increases, along with the collisional heating, according to equation (4). The decrease in time averaged and spatially integrated collisionless heating with increasing SDO surface loss probability will be discussed below in the context of the phase and space resolved electron heating.

Figure 8. Time averaged and space integrated (a) collisional electron heating, and (b) collisionless electron heating power density (Wm ) in dependence of SDO surface loss probability and secondary electron emission coefficient
  (
( ). (
). ( Pa,
Pa,  V).
V).
Download figure:
Standard image High-resolution imageAlthough the averaged collisionless heating is small compared to the averaged collisional heating, it should not be neglected, because it is responsible for significant electron heating within the RF cycle. Figure 9 exemplarily shows (a), (c) the collisional and (b),(d) the collisionless phase and space resolved electron heating power density for two SDO surface loss probabilities ( ,
,  ), and a common gamma-coefficient (
 ) on an identical false color scale.
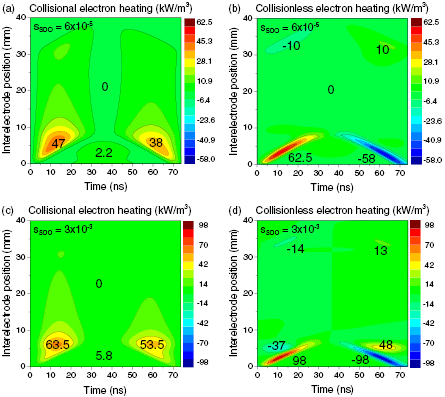
Figure 9. Phase and space resolved (a), (c) collisional electron heating, and (b), (d) collisionless electron heating for two different SDO surface loss probabilities. The annotated numbers represent approximate values in their respective regions. ( Pa,
Pa,  V,
V,  ).
).
Download figure:
Standard image High-resolution imageThe collisional electron heating in figures 9(a) shows the highest contribution close to the sheath edge during the sheath expansion and sheath collapse phases and a minor positive contribution inside the sheath. Similar electron heating structures have been simulated previously [8, 54, 55].
The collisionless electron heating in figures 9(b) has a higher positive heating power density at the sheath edge during sheath expansion than the collisional heating. Furthermore, it can be seen that a highly negative electron heating power density (or cooling) occurs at the sheath edge during the sheath collapse phase. This can be explained by analyzing the second term in equation (4) in more detail. The electron density gradient is always pointing inwards towards the bulk plasma, i.e. positive for the sheath at the powered electrode (compare figure 6), however the electron flux, and thus the mean electron velocity, changes direction within the RF cycle. The mean electron velocity at the plasma sheath edge, where the collisionless heating structures are located, is directly related to the sheath edge velocity, which changes direction during the RF cycle. During sheath expansion, the sheath edge velocity is positive indicating the acceleration of electrons into the plasma bulk and resulting in electron heating. During the sheath collapse, the sheath edge velocity is negative, resulting in electron cooling. The same is true for the grounded electrode, however the corresponding electron heating power densities are much lower due to the strong geometrical asymmetry of the discharge. Adding together the two electron heating contributions for  , it is clear that electron heating on sheath expansion is dominant over electron heating on sheath collapse. This agrees well with the dominant ionization at sheath expansion shown in figure 7(a) under the same surface conditions.
As a result of the changing direction of the sheath velocity throughout the RF cycle the collisionless heating on average is small, because the positive and negative contributions effectively cancel out. However, the collisionless heating on sheath expansion ( 62 kWm
 ) is actually greater than the collisional heating at the same phase of the RF cycle (
 47 kWm
 ). It is obvious that ionization and excitation occurring as a result of collisionless heating at the sheath expansion will not be reversed at the sheath collapse. Thus, the fact that the time averaged and spatially integrated collisionless heating is small does not reflect its importance to the dynamics and sustainment of the plasma. This is an important factor to consider, particularly when evaluating models which do not include an explicit time dependence within the RF cycle.
The collisional and collisionless phase and space resolved electron heating power density for the larger SDO surface loss probability of  are shown in figures 9(c) and (d), respectively. It can be seen that the maxima in collisional electron heating power density during sheath expansion and collapse are higher for
  than
than  (figure 9(a)). This is in agreement with the trend in averaged collisional heating seen in figure 8(a). However, the maxima in the phase and space resolved collisionless electron heating are also greater for
  than
than  (figure 9(b)). This is in contrast to the trend in averaged collisionless heating seen in figure 8(b). It is obvious that a higher maximum electron heating leads to higher local ionization and excitation rates. Thus, the fact that the time averaged and spatially integrated electron heating decreases with increasing SDO surface loss probability is misleading when considering the end consequences (ionization and excitation) of electron heating in the plasma. This further emphasizes the importance of studying collisionless electron heating within the RF cycle. It is notable, that in the case where
  collisionless heating and cooling are also seen outside of the immediate sheath edge region at an interelectrode position of 5 mm at times of 10 ns and 65 ns. These structures result from electron density gradients due to the build-up of electrons between the maximum sheath edge position and the powered electrode. These electron density gradients occur when the plasma is highly electronegative. In such cases quasineutrality is preserved in the bulk plasma mainly by negative ions, however, the high inertia of these ions means that they cannot respond to the rapidly varying field of the sheath. As a result they are largely confined between the maxima in the sheath edge positions. Thus, electrons, which can respond to the rapidly varying field, build-up to preserve quasineutrality in the regions between the maximum of the sheath edge and the electrodes. The electron densities in these regions are higher than in the discharge center and as such an electron density gradient is formed causing additional collisionless electron heating. This heating contributes towards the high ionization and excitation rates seen in simulations and observed experimentally at the sheath collapse in highly electronegative plasmas (see figures 7(b) and 10(d)). Similar electron heating and excitation phenomena have been simulated and observed previously in highly electronegative CF
 plasmas [8, 55].
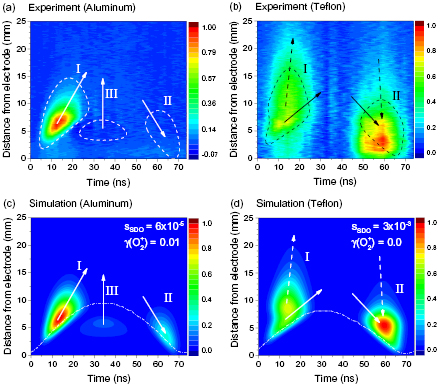
Figure 10. Phase and space resolved excitation rate of the  nm optical emission line as obtained experimentally for different electrode materials: (a) aluminum and (b) Teflon (false color images). (c) and (d) are corresponding simulations matching the experimental observation for the indicated set of SDO surface loss probability and secondary electron emission coefficient. Black dashed contour lines indicate the shape of the simulated excitation features. Dashed white lines indicate the sheath edge positions. (
 Pa,
Pa,  V). (b) and (d) reprinted with permission from [39] Greb et al 2013 Appl. Phys. Lett. 103 244101. Copyright 2013, AIP Publishing LLC.
Download figure:
Standard image High-resolution image3.6. Comparison with phase resolved optical emission spectroscopy
The presented modeling approach opens the opportunity to gain a better understanding of various plasma parameters by comparing the numerical simulation with corresponding measurements. This enables us to link fundamental plasma parameters to the actual surface condition.
In industrial applications intrusive diagnostic methods are mostly avoided. Instead, passive diagnostic methods, like phase resolved optical emission spectroscopy (PROES), are preferred. Using this technique the dynamics of plasma ionization induced by energetic electrons can be probed by observing the phase resolved optical emission intensity and deconvoluting it with the effective lifetime, as shown in [56]. Here, we utilize this approach by measuring the optical emission of the  nm atomic oxygen line, then deriving the spatio-temporal features of the corresponding excitation rate, and finally comparing them with the results of the numerical simulations.
The experimental setup includes a standard inductively-coupled GEC reference cell, which was operated in a capacitive coupled mode by powering the lower planar electrode at 13.56 MHz radio frequency and grounding the (normally powered) coil as well as the chamber itself. The 844.6 nm optical emission line is spectrally separated by a 0.5 m imaging Czerny-Turner-Spectrograph (Andor Shamrock 500i, 1200 l mm grating) and detected by an intensified charged coupled device (ICCD) camera (Andor DH334T-18U-73). The phase and space resolved optical emission signal was captured with 2 ns phase resolution and 42
  m spatial resolution. The actual effective excitation rate of the optical emission line is calculated as described in the literature, see [57]. Only dissociative excitation is taken into account, because this is known to be the dominant excitation processes under the investigated conditions [58], since the atomic oxygen density is small [59].
For the same operational parameters, a variation of the SDO surface loss probability and the secondary electron emission coefficient was conducted in the model to find the best match between model and experiment. Figure 10 shows the calculated excitation rate from the measured  nm optical emission line intensity along the radial center axis of the discharge on a normalized false color scale and the best matching simulated excitation pattern, for two different electrode materials, namely aluminum and Teflon. It should be noted that figure 10 only shows the lower part (from 0–25 mm) of the total discharge gap (extending to 40 mm), which is relevant for the comparison.
For both electrode materials, there is a very good agreement in spatio-temporal position and shape between simulation and experiment for excitation features I, II, and in case of aluminum for feature III as well. The simulation matching the experimental observation for the aluminum electrode indicates a relatively low SDO surface loss probability ( ), which corresponds to an SDO content of 11.4% and an electronegativity of
  . For Teflon as electrode material the best match results in an SDO surface loss probability of
  , which is almost two orders of magnitude higher than for the aluminum electrode. Thereby, the SDO content is suppressed to less than 1% and the discharge becomes highly electronegative (
 ). The secondary electron emission coefficient is approximately 0.01 for aluminum and negligible for Teflon, because no excitation from secondary electrons is observed in the latter case. From this follows that Teflon appears to be much more efficient in de-exciting SDO than aluminum.
The arrows shown in figure 10 indicate the expansion velocity of the excitation features. The expansion of the secondary electron driven excitation feature (III) is much faster than for the other excitation mechanisms. The obvious reason is that there are the two distinct electron groups of energetic beam-like released gamma electrons and thermal bulk electrons in the near-electrode regions. Their interaction and progressive thermalization within the sheath regions can only be described properly in the frame of a fully-kinetic model, which would require a computational effort far beyond the needs of our approach.
Another interesting observation is that in case of an increasing SDO surface loss probability the sheath expansion excitation (I) takes place on different time scales (compare dashed and solid arrows in figure 10(d)). This can be explained due to the increased electronegativity and higher present electric field in the bulk than for the discharge with lower electronegativity [60–62]. This creates relatively high electric fields in the quasi-neutral bulk and enhanced excitation in this region due to significantly larger electron acceleration. The same applies for the sheath collapse phase (II), where a stronger electric field reversal was identified due to the higher electronegativity [63].
3.7. Impact of surface condition on plasma parameters and dynamics
Figure 11 illustrates how the actual surface condition affects particles within the discharge and how these particles in turn affect the plasma dynamics. Generally, an increasing surface loss probability of SDO evokes in the first place a reduction of the total SDO concentration in the system (right branch in figure 11). A quasi-reciprocal dependence of the concentration on the surface loss probability has been observed. Furthermore, the numerical simulations yield that SDO is the main destruction partner for  . Thus, a decreasing total SDO concentration implies an increasing negative atomic oxygen ion density. The negative ions on their part will affect other charged particles. In order to compensate the increased negative net charge in the plasma, the positive ion density will increase as well. On time average, only electrons are minorly affected by the changes of the SDO surface loss properties, thus leading to an increasing electronegativity in the system, because
  becomes successively more dominant over electrons. It was shown that the global electron density is significantly affected by the secondary electron emission coefficient. This means, that the secondary electron emission coefficient has a direct impact on the electron dynamics (left branch in figure 11).

Figure 11. Illustration of impact of actual surface condition on plasma parameters and plasma dynamics.
Download figure:
Standard image High-resolution image
4. Conclusions
A one-dimensional model was used to investigate the impact of changing surface loss probabilities of metastable singlet delta oxygen (SDO) and secondary emission yield induced by positive ions in low-pressure electronegative oxygen capacitively coupled radio-frequency plasmas. Both quantities are found to have a major influence on the plasma dynamics, thus representing important indicators for the actual surface condition. However, the surface condition is often neglected or wrongly treated in simulations due to absence of consistent data. Here, modeling a set of different surface loss probabilities and secondary electron emission coefficients was used to gain further insight on their fundamental impact on plasma properties in quantitative terms.
It was determined that the SDO surface loss probability and secondary electron emission coefficient both influence the electron heating in the plasma. Both collisional and collisionless electron heating increased with increasing secondary electron emission coefficient as a result of increasing electron density. The SDO surface loss probability was found to have a less significant effect on the time averaged and spatially integrated electron heating. However, it is important to note that, as the SDO surface loss probability was increases, the time averaged and spatially integrated collisional and collisionless heating show opposing trends, with the collisional heating increasing and the collisionless heating decreasing. It was determined that both the absolute value of the time averaged and spatially integrated collisionless heating and the trend with increasing SDO surface loss probability are misleading. This is because the maximum value of the phase and space resolved collisionless heating was seen to be greater than the equivalent collisional heating and also increased with increasing SDO surface loss probability, contrary to the time averaged and spatially integrated values. As such, in order to fully describe the importance of the individual electron heating mechanisms it is important to take into account an explicit time dependence within the RF cycle.
Moreover, the time and space resolved electron dynamics is to a greater extent affected by changing the SDO surface loss probability and the secondary electron emission coefficient. It was shown that, on the one hand, the increasing loss of SDO at the surfaces leads to a successively more pronounced ionization during the sheath collapse phase. This is explained by the increasing electronegativity, which promotes electrons to be accelerated to higher extent during sheath collapse due to larger present electric fields, thus ionizing more particles on their path. On the other hand, the ionization dynamics from secondary electrons only changes with varying secondary electron emission coefficients because this influences the production of secondary electrons and their possibility to ionize molecular oxygen on their path towards the plasma bulk.
Phase resolved optical emission spectroscopy was applied to investigate the dissociative excitation of the  nm atomic oxygen optical emission line. A set of different surface loss probabilities and secondary electron emission coefficients was simulated to draw conclusions on the surface condition by assigning absolute values to the two quantities.
By linking experimental observations to numerical simulations, the presented approach can equivalently be used to derive effective values for these or similar surface parameters for a variety of specific plasma systems and chemistries. Thus, allowing to modify ad hoc experimental setups more efficiently to achieve advanced real-time process control and monitoring.
Acknowledgments
The authors would like to thank Intel Ireland (Ltd.) for financial suppport and the UK Engineering and Physical Sciences Research Council (EPSRC) for support through the EPSRC Manufacturing Grant (EP/K018388/1) and the EPSRC Career Acceleration Fellowship (EP/H003797/1). One of the authors (A R Gibson) acknowledges funding through a Northern Ireland Department of Employment and Learning (NI DEL) studentship. Collaboration and valuable discussions with W G Graham from the Queen's University Belfast are also gratefully acknowledged.