

Abstract
Biomedical applications of non-equilibrium atmospheric pressure plasmas have attracted intense interest in the past few years. Many plasma sources of diverse design have been proposed for these applications, but the relationship between source characteristics and application performance is not well-understood, and indeed many sources are poorly characterized. This circumstance is an impediment to progress in application development. A reference source with well-understood and highly reproducible characteristics may be an important tool in this context. Researchers around the world should be able to compare the characteristics of their own sources and also their results with this device. In this paper, we describe such a reference source, developed from the simple and robust micro-scaled atmospheric pressure plasma jet (μ-APPJ) concept. This development occurred under the auspices of COST Action MP1101 'Biomedical Applications of Atmospheric Pressure Plasmas'. Gas contamination and power measurement are shown to be major causes of irreproducible results in earlier source designs. These problems are resolved in the reference source by refinement of the mechanical and electrical design and by specifying an operating protocol. These measures are shown to be absolutely necessary for reproducible operation. They include the integration of current and voltage probes into the jet. The usual combination of matching unit and power supply is replaced by an integrated LC power coupling circuit and a 5 W single frequency generator. The design specification and operating protocol for the reference source are being made freely available.
Export citation and abstract BibTeX RIS

Original content from this work may be used under the terms of the Creative Commons Attribution 3.0 licence. Any further distribution of this work must maintain attribution to the author(s) and the title of the work, journal citation and DOI.
1. Introduction
Microplasmas operated at atmospheric pressure have gained very high attention. A series of review papers and topical issues of leading scientific journals have discussed their technological and biomedical promise as well as their scientific challenges [1–3]. A major part of the research on cold atmospheric pressure microplasmas aims at the development and optimization of plasmas for the production of reactive species from a molecular precursor gas. Reactive microplasmas have been developed for the deposition of functional organic or inorganic coatings and thin films. Other surface treated materials range from polymers to living tissue in the emerging and particularly promising field of plasma medicine. These applications include cancer treatment, sterilization and wound healing [4–10]. So-called 'jet' devices are especially suited for biomedical applications because they are small enough to be easily handled and emit a cold gas stream. This gas stream contains a multitude of reactive species which can be directed towards a target surface. There, a localized interaction can take place due to the small dimensions of the devices. However, many groups around the world are investigating different, mostly self-made atmospheric pressure plasma jets for biomedical applications [11–14]. Since each device behaves differently, a comparison between the results is complicated [15]. This leads to a huge delay in scientific progress. This progress could be improved by correlating the results from different groups. Consequently, the basic understanding of atmospheric pressure plasmas and their interaction with biological tissue is often lagging behind. This impedes their scaling and prevents the approval of processes by authorities [10].
To solve these problems, within the European COST (Cooperation in Science and Technology) Action MP1011 on 'Biomedical Applications of Atmospheric Pressure Plasma Technology' [16], a group was formed to discuss the possibilities of defining a device that could be used as a reference source for all groups doing research in the field of plasma medicine. Researchers around the world should be able to compare the characteristics of their own sources and also their results with this device.
A list of key requirements for a reference source was defined. This list included:
- The design should be simple, robust, and inexpensive;
- The device should be usable in different laboratories using standard electrical equipment and gas connectors;
- The device should be air-tight to minimize the influence of ambient air;
- The device components should be composed of inert or medically certified (accepted) materials;
- Internal probes should be included to allow a continuous monitoring of operation conditions;
- The device should be electrically safe and low in electromagnetic radiation;
- The design should be openly available to all interested researchers.
Considering these requirements, the micro-scaled atmospheric pressure plasma jet (μ-APPJ) developed by Schulz-von der Gathen and co-workers [17] was selected as the basis for the development of a reference source. Here, we present the outcome of this development: a reference device for research purposes—the COST Reference Microplasma Jet. We briefly introduce the technical details and then show a basic characterization that can be used to demonstrate the reproducibility of power, optical emission spectroscopy (OES), and gas temperature measurements.
2. State of the art radio-frequency excited micro-scaled atmospheric pressure plasma jet
The micro-scaled atmospheric pressure plasma jet (μ-APPJ) is based on the original APPJ as introduced by the group of Hicks and Selwyn [18]. The μ-APPJ is a capacitively coupled 13.56 MHz RF-discharge with symmetric, co-planar, stainless steel electrodes enclosed by two quartz panes and a discharge volume of  mm, particularly designed for optimized optical diagnostic access [19]. The standard operation condition is a homogeneous α-glow mode with a noble gas flow (typically 1.4 slpm He) containing a small molecular admixture of oxygen or nitrogen (typically 0.5%) [20, 21].
The μ-APPJ has been and is actively investigated at several institutes. Up to today, about 40 articles on experimental measurements as well as on models and simulations have been published. These results include spatially resolved diagnostics of reactive species such as radicals (e.g. atomic oxygen and nitrogen, ozone, metastable oxygen molecules), gas temperatures, flow patterns, etc in the discharge region and in the effluent [19, 22–26]. The emission was investigated down to the vacuum ultraviolet as a potentially important contributor to biomedical processes [27]. The investigations also comprise a variety of biomedical experiments [28–32].
Several modeling investigations have been carried out, taking advantage of the simple geometry of the device. One-dimensional models were used to describe the electron excitation within the electrode gap [33–36]. One- and two-dimensional simulations have been used to investigate the generation of reactive species [37–40] as well as power modulation [41]. The μ-APPJ continues to be actively investigated.
In preparing the specification for the COST Reference Microplasma Jet, several drawbacks of the original design were identified that needed an improvement to cover the goals of the source.
3. Design of the COST Reference Microplasma Jet
The COST Reference Microplasma Jet (COST-Jet or COST-RMJ) was developed based on the original μ-APPJ concept. The complete device (see figure 1) consists of two main components: (i) the 'head' that comprises the electrode stack with quartz panes, the gas connector and the gas tubing, and (ii) the housing, that holds the head, provides the electrical connections, and internal current and voltage probes. Both components will be described in detail below.
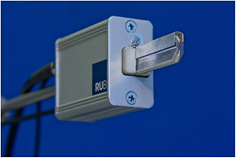
Figure 1. Photograph of the ignited COST Reference Microplasma Jet (COST-Jet). The homogeneous discharge is formed between the plane-parallel electrodes of the electrode assembly that extends from the housing.
Download figure:
Standard image High-resolution image3.1. Head
The head (see figure 2) includes the electrode assembly composed of a quartz pane / metal electrode / quartz pane stack. This assembly forms the discharge channel. Using a two-component glue suitable for high-vacuum applications (TorrSeal®), the assembly is glued into a ceramic gas connector that attaches the  inch stainless steel gas tubing to the head.

Figure 2. Detailed sketch of the head showing the two symmetric, stainless steel electrodes with connection wings and quartz panes covering the symmetric plasma electrodes. The blue line at the circumference indicates seal made from TorrSeal® inside the groove formed between the panes and the electrode.
Download figure:
Standard image High-resolution image3.1.1. Electrode assembly.
The two metal electrodes of the head (see figure 2) are symmetric and separated by a 1 mm gap. The 52.5 mm long, 12 mm wide and 1 mm thick electrodes are made of medical stainless steel (SS 316) and form the gas channel which features three different zones: (i) A region of about 11.5 mm length that is fully covered by quartz panes. In this region, the electrode faces are widely spaced so that no discharge is ever ignited. Here, gas from the supply redistributes before entering the main discharge volume of the head. This premix volume is 5 mm wide. (ii) The subsequent part extends over 30 mm of length of closely spaced electrodes each being 4.5 mm high, defining the 1 mm wide discharge channel. At the exit region, the electrode width is reduced to 1 mm. (iii) The safety zone is formed by the quartz panes and prevents contact with the electrodes.
These quartz panes (Corning 7980) are windows that allow direct, broadband observation of the discharge down to a wavelength of about 200 nm. They are 1.5 mm thick and cover the electrodes over a length of 50 mm. They extend slightly beyond the electrode configuration, forming 1 mm deep grooves at its outer side. These grooves are used to tightly glue together the entire stack with TorrSeal® while preventing any contact between the feed gas and plasma with the glue. During assembly, the stack is pressed together to minimize any space between the electrode and pane and thus preventing air intrusion during operation. The glue extends from the wing of the electrode up to the flat exit as indicated by the blue boundary lines in figure 2. The width of the quartz panes decreases symmetrically to 5 mm over a length of 3.5 mm, thus forming a flat exit in combination with the electrodes. This wedge shape conveniently enables the insertion of the assembled tip into the cavities of a 24 well titer plate.
The 1 mm safety gap formed by the extension of the quartz panes beyond the electrode tip serves three purposes: (i) the powered electrodes cannot be directly touched, (ii) electrical contact with the target is prevented and (iii) even when coming in contact with a surface, the gas flow is not shut off immediately, thus preventing irregular operation of the device.
3.1.2. Gas configuration.
The electrode assembly is glued into a slot of a cube of machinable ceramic that forms an electrically isolated connection to the gas line (see figure 2). A  inch stainless steel tube is inserted into a drilled hole on the opposite side of this gas connector and tightly glued. The gas is fed from the steel tube through a 1 mm diameter drilling in the gas connector into the discharge channel. By selecting these materials, we ensure that only stainless steel, quartz, and alumina ceramic come in contact with the gas and the plasma. Typically, the feed gas tube has a length of 60 mm, but can also be shorter or longer than that, depending on the requirements. It can be connected to standard gas fittings using an O-ring-to-standard fitting adapter (right of figure 3). Thus, the complete head can be separated from the housing into which it is inserted for operation.
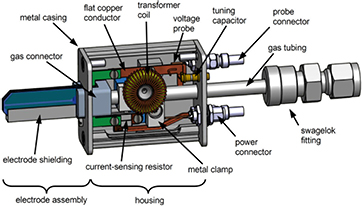
Figure 3. Sketch of the complete assembly consisting of head, housing and adapter to external tubing. In the housing, the fastening and guidance of the head, the electrical power connections with matching coil and capacitor and both internal probes are illustrated.
Download figure:
Standard image High-resolution image3.2. Housing
The housing (see figure 3) consists of a rigid metal casing (Fischer Elektronik, AKG412450ME) of  mm. The casing is made of anodized aluminum and is therefore electrically insulated, so that incidental electrical contact is prevented. The complete head is inserted into the housing from the front side with the
  inch tubing. It is guided and mounted by a metal clamp. This provides stable support and excellent grounding to the device. The electrode wings are screwed with M2 threads into a flat copper conductor for connection to the power supply. The complete COST-Jet device can be installed on an optical post by using the M5 thread in the bottom of the housing.
The front and back cover are tightly connected to the main body of the housing. The front cover includes a slot for the head and a thread to mount an electrode shielding for the grounded electrode. All electrical connectors are combined into the back cover of the housing. Here, the power connector (SMA), two probe connectors (SMC), and the adjustable tuning capacitor are located. To improve discernibility, different connectors for power and probes have been selected.
The external connection to the power supply is provided by a low loss coax cable (H-155 PE Low Loss) with a damping of 0.46 dB m−1at 2 GHz. The cable is fitted with a female SMA connector on the assembly side and a BNC connector on the supply side.
Based on the work by Marinov and Braithwaite [42], an internal resonance coupling is used (see figure 4). Thus, there is no need for an external tuning network (matchbox).
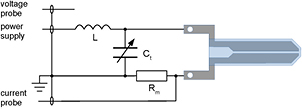
Figure 4. Electrical circuit scheme including LC circuit for matching, the capacitive voltage pick-up probe and  for current measurements.
Download figure:
Standard image High-resolution imageFor this purpose, an LC circuit with a tunable capacitor (Sprague Goodman  –8 pF) and an inductor (
 μ H, Amidon T68-2 core, 41 windings) was used to tune the circuit into resonance at a frequency of 13.56 MHz. The capacitor is installed in parallel to the electrode stack. This LC circuit has a Q-factor of about 30. This means it provides a thirty-fold increase of the applied voltage. Thus, a power supply capable of delivering 7 V is enough to ignite the discharge.
3.2.1. Probes.
For an easy control of experimental conditions, two probes are integrated into the housing of the COST Reference Microplasma Jet.
Voltage probe.
The voltage probe is a pin of 5 mm length positioned 4 mm below the powered flat copper conductor leading to the electrode. The voltage probe is capacitively coupled to the electrode. Once calibrated using an external voltage probe, the voltage between the electrodes is obtained using an oscilloscope. The calibration procedure is described in more detail in section 4.1.
Current probe.
The current is measured via a resistive current measurement. The precision film resistor (
 ) is positioned between the ground-side electrode and ground. The voltage drop over this resistor is proportional to the discharge current via Ohm's law. To ensure that the current probe only measures the current that crosses the discharge channel, a grounded shielding is fixed around the ground-side of the electrode assembly (see figures 1 and 3). Both probes are connected to standard SMC sockets.
3.3. Power supply
The concept of the COST Reference Microplasma Jet presented here is accompanied by the development of a simple, tailored, miniaturized power supply for 13.56 MHz (see figure 5). It delivers the required voltage for the LC circuit to safely operate the COST-Jet in helium with a 0.5% admixture of oxygen. The maximum output power of the amplifier is 5 W. For reference purposes, the power can be fixed to a single power setting. This power supply can be replaced by any power generator capable of delivering this voltage range, when the required matching to the LC circuitry can be achieved.
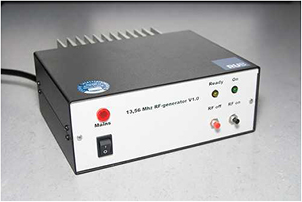
Figure 5. Image of the home-made 'on/off' 13.56 MHz power supply tailored to the LC resonance circuit.
Download figure:
Standard image High-resolution image3.4. OES reference cover, reference fiber spacer
A second possibility to control experimental conditions is OES using an optical fiber. To ensure reproducible OES measurements, we introduced two simple accessories for the COST-Jet: (i) The OES reference cover and (ii) the reference fiber spacer.
The OES reference cover is made of black cardboard and encloses the electrode assembly completely. It has a rectangular hole with a size of  mm positioned at the center of the discharge.
The fiber-spacer is made of opaque plastic. The spacer was manufactured for optical fiber with SMA termination and ensures a fixed distance of 5 mm between the fiber entrance and glass pane of the COST-Jet. It has a core drilling of 3 mm diameter that fits to the rectangular hole in the OES reference cover. The fiber spacer prevents any electric disturbance of the COST-Jet operation by metallic fiber jacketing. The combination of the OES reference cover and fiber spacer ensures a reproducible positioning of the observation hole in the center of the discharge and prevents the collection of stray light by the fiber.
4. Basic characterization
To demonstrate the performance of the COST Reference Microplasma Jet, a basic characterization was conducted at the Ruhr-Universität Bochum. This characterization includes electrical measurements, such as voltage, current and power measurements, as well as OES and temperature measurements. The built-in probes of the COST Reference Microplasma Jet allow simple monitoring of electrode voltage and plasma current of the device. Here, the results are presented.
For all measurements, the COST-Jet was operated at a helium gas flow of 1.0 slpm of helium (purity 99.999%) and an oxygen admixture of 0.5% (purity 99.998%). This gas flow ensures a low gas temperature and yet keeps the flow low enough to avoid or reduce evaporation with biological substrates. The results of current and voltage measurements are presented in rms values, unless denoted otherwise.
4.1. Voltage probe calibration
Prior to measurements, the internal voltage probe has to be calibrated.
To calibrate the internal voltage probe, a commercial voltage probe (see table 1 for detailed description of equipment) was connected to the electrodes of the COST-Jet. The probe was properly matched to the oscilloscope (see table 1) to ensure high fidelity in the 13.56 MHz region. This was done by connecting it to the calibration signal of the scope. This adjustment can make a significant difference especially with higher attenuation probes.
Table 1. Equipment used for basic electrical and optical characterization.
| Oscilloscope type | Voltage probe | Spectrometer |
|---|---|---|
| LeCroy WavePro 735Zi | Tektronix P5100A | Ocean optics HR4000 |
| (40 GS s−1, 3.5 GHz) | (100x) | |
| Tektronix DPO 2024 | Tektronix P5100A | Ocean optics HR4000 |
| (1 Gs s−1, 200 MHz) | (100x) |
The internal voltage and current probes were connected to two different oscilloscopes using a 
 termination to minimize signal reflection.
Comparing absolute amplitude values of the voltage measured with the commercial and the internal voltage probe, we calculated a calibration factor for the internal probe. Internal and commercial voltage probe measurements showed a linear correlation (see figure 6). Therefore, a single calibration factor could be calculated by a linear regression curve. The calibration was done multiple times using two different oscilloscopes. The calibration factor from internal to commercial probe voltage was  . The differences in calibration factors can most likely be attributed to imprecise calibration of the commercial voltage probe. This inaccuracy cannot be entirely avoided.

Figure 6. Comparison of internal probe to commercial probe (Tektronix P5100A). The linear regression curve provides a calibration factor for the internal voltage probe. Each individual COST-Jet has to be calibrated due to small manufacturing differences. The legend indicates the used equipment. For the measurement represented by the square symbols only one value out of 20 is shown.
Download figure:
Standard image High-resolution imageIt has to be noted that this calibration factor has to be measured and calculated for each COST-Jet. This recalibration is necessary due to variations of probe positioning inside the housing.
The discharge current was calculated from the voltage measured by the internal current probe. Since the internal current probe measures the voltage drop,  , over a resistor of
 (see figure 4) and is connected to the oscilloscope using a termination of
 , the current can be calculated via Ohm's law:
4.2. Power measurement
The power, that is dissipated in the plasma can be obtained using current, voltage and the phase shift between them.

The current and voltage signals are measured at different locations and with different cables and therefore have a different phase than the signals at the electrode. Hence, it is necessary to have a reference at which the value of the phase is known. Without the discharge, the COST-Jet electrodes basically form a capacitor and the active power should be equal to 0 W. Therefore, the phase between current and voltage without a discharge is 90°. The change in phase from this reference can then be used to calculate the power, using equation (2). For the power measurements, an oscilloscope with a minimum sampling rate of 1 GS s−1 is recommended.
Voltage, current and power were measured using the described method. At a voltage of approximately 150 V, breakdown occurred and the discharge was ignited (see figure 7). A stable operation of the device in a homogeneous mode was possible in a voltage range of 155–335 V. This corresponds to an active power of 0.2 W–1.7 W. This power range agrees very well with model calculations by Waskoenig et al [43]. At higher voltages, a transition to a constricted mode was observed. With the transition to this mode, the voltage dropped and the power consumption strongly increased. In the constricted mode, the plasma is located in a small area at the very tip of the electrodes close to the exit. The gas temperature considerably exceeds room temperature and might even damage the COST-Jet if operated longer than a few seconds.
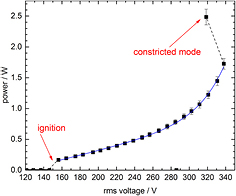
Figure 7. Active power from ignition through the transition to constricted mode.
Download figure:
Standard image High-resolution imageAt approximately 240 V and 0.45 W (see figure 7), a change in the power-voltage-curve was observed. For voltages lower than 240 V, the power rises linearly with voltage. For higher voltages, an additional exponential trend becomes dominant. This change corresponds to a transition of the discharge from an α-like mode to a γ-like mode. This transition has been discussed previously [35, 44].
4.3. Optical characterization
OES allows for the estimation of stability and reproducibility of the operation as well as the influence of impurities in the different devices. To study the response of the plasma chemistry to different plasma parameters, we investigated the plasma emission using a broad band spectrometer (Ocean Optics HR 4000, 200 nm–1100 nm, 3648 pixels) and fiber optics (Ocean Optics QP 600-2-UV-BX). To ensure a defined distance between fiber optics and discharge, we used the fiber distance spacer and the OES reference cover (see section 3.4). If not stated otherwise, all results were obtained at an active power of 0.4 W (212 V) and a gas flow of 1 slpm helium and admixture of 5 sccm oxygen.
Notably, atomic oxygen lines (777 nm, 844 nm) were the most prominent emission lines in the emission spectrum (see figure 8). The helium atomic lines (706 nm, 587 nm, 668 nm) were less pronounced. The weak molecular nitrogen emission of the second positive band (336 nm, 357 nm) as well as the hydroxide emission (308 nm) can be attributed to impurities in the gas supply. Impurities from leakages or backflow are unlikely due to steel tubing and high gas flow. The low impurity level in the spectrum was obtained using stainless steel tubing and flushing with helium prior to ignition of the discharge. This procedure has been shown to reduce humidity in the gas supply due to water attached to the gas tubing [45]. Control of impurities is essential for reproducible results and thus is a major issue in atmospheric pressure plasmas.
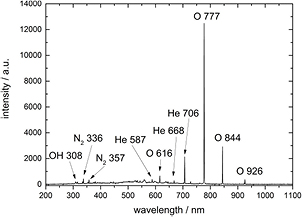
Figure 8. Atomic oxygen lines (777 nm, 844 nm) are most prominent in the survey spectrum measured at 0.4 W (212 V), 1 slpm helium and 5 sccm O2.
Download figure:
Standard image High-resolution imageFor flow variations (see figure 9), the value at 1 slpm helium flow was selected as the normalization point. Figure 9 shows the behavior of the strongest atomic lines (ratio of the 844 nm O line and the 706 nm He line) for a flow variation from 0.25 slpm to 1.5 slpm. The error bars represent an upper limit of 5% deviation of the absolute line intensity and are shown only for the first measurement point. The ratio of the two lines slightly decreases by about 5% for increasing flow. This relative reduction of the oxygen contribution can be attributed to the decreasing residence time up to the measurement point at higher flows [19]. The ratio of the oxygen line to the emission of the 357 nm molecular nitrogen band of the second positive system gives an indication of the impurities in the device. An increase in the He/N2 ratio was observed with rising flow. This is explained by an apparent decrease in nitrogen contribution either from the gas system or back flow through the exit. The back flow argument is supported by the steeper increase at the lowest flow of 0.25 slpm. For any further interpretation, it has to be kept in mind that the emission is influenced by the number of species as well as the energy distribution of the exciting electrons.

Figure 9. Intensity ratios of oxygen 844 nm, helium 706 nm and molecular nitrogen (357 nm) emission for a flow variation measured in the center at a power of 0.4 W (212 V).
Download figure:
Standard image High-resolution image5. Gas temperature
A crucial parameter for biomedical applications with living tissue and to a lesser extent interactions with temperature sensitive materials is the gas temperature of the effluent. Since increased temperatures above 37 °C can damage living tissue, it is crucial to control the heat impact. Therefore, the heating of the effluent gas needs to be low.
The gas temperature of the effluent was measured using an RF-insulated thermocouple in a distance of 3 mm of the electrode tip (see figure 10); this is also a typical distance used for biomedical application interactions. Note that the 0 mm position represents the COST-Jet exit, i.e. the tip of the electrodes. Since investigations usually cover both the discharge region and the effluent, it was chosen that positive '+' coordinates point into the effluent and negative '-' values into the discharge region, with zero defined at the electrode edge.

Figure 10. Change in line intensity and effluent temperature in the first 60 min after discharge ignition, measured at 0.2 W, 1 slpm helium, 5 sccm O2 at +3 mm distance.
Download figure:
Standard image High-resolution imageTemperature rises at an active power of 0.2 W within the first 5 min from ambient temperature of 19.9 °C (not displayed here) to 30.5 °C. After this increase, the temperature reaches a steady state of approximately 32.5 °C within 30 min. This corresponds to the typical heat-up time of the complete system [46] and partially motivates our recommended warm-up time for the system. The error bars for the temperature represent a 0.5 °C uncertainty. In figure 10, the development of the emission lines of the most prominent atomic lines of helium and oxygen is shown. The intensities for these measurements were averaged over 4 min. The error bars represent the standard deviation of the mean value. Here, the intensities of the observed lines increase by a few percent until they reach a steady state after about 30 min. The increase corresponds partially to the rise in temperature mentioned before. Another reason for this behavior is the reduction of impurities, mainly water and nitrogen, in the gas tubing. The duration of the reduction process and the intensity change of the emission lines strongly depends on the initial amount of impurities in the gas tubing.
In figure 11, we show the dependence of the steady state temperature on a power variation from 0.1 W to 1 W measured under otherwise identical conditions at +3 mm distance. Again, the error bars for the line intensities represent an upper limit of 5% deviation and are exemplarily shown for the strongest atomic oxygen line (777 nm). The error for temperature measurement is 0.5 °C. The temperature of the effluent showed a linear correlation to the active power in the discharge rising from 30 °C to 75 °C. For powers below 0.25 W, the temperature remains below 37 °C and hence is well-suited for the treatment of heat-sensitive biological tissue. At 1.0 W, the effluent temperature was above 70 °C. This has to be kept in mind when conducting biomedical research.

Figure 11. Effluent temperature measured at +3 mm distance and line intensity under variation of the power. Effluent temperature and the atomic oxygen lines at 777 nm and 844 nm show a linear correlation to the active power.
Download figure:
Standard image High-resolution image
The intensities of the prominent atomic oxygen lines showed a linear correlation to the power dissipated in the discharge (see figure 11). This corresponds to the linear increase of atomic oxygen with rising (generator) power that has been observed by two-photon absorption laser-induced fluorescence spectroscopy in the original μ-APPJ [20]. The intensity of the most prominent helium line at 706 nm increased exponentially with increased power since the helium emission follows the electron excitation (see figure 7).
6. Protocols
Based on various investigations of the COST-Jet, several additional decisions have been made on operation protocols:
- Gas tubing should consist of stainless steel tubing. Any plastic tubing is prone to introduce impurities into the feed gas by diffusion [45].
- Prior to any reproducible measurement, the COST-Jet should be operated for at least 30 min continuously (see figure 10). This allows the temperature of the device to stabilize [46] and removes a good part of the humidity stored in the tubing.
- Valves closing the tubing should be installed as close as possible to the COST-Jet to minimize humidity entering the tubing.
- Humidity and temperature in the laboratory should be recorded.
- When presenting results obtained with the COST-Jet, the standard coordinate system should be used. In this coordinate system, the origin represents the end of the discharge channel, i.e. the tip of the electrodes. Positive coordinates are in the space outside the discharge channel.
7. Further developments
Within the cooperation, a printed circuit board was designed for the COST-Jet that replaces the voltage and current probes. The circuitry yields a direct measure of the plasma power. Details of the device are described in a publication by Beijer et al [47]. Another publication presents a modified set of COST-Jets to separate species and radiation components of the plasma [48].
8. Summary and conclusions
Based on the μ-APPJ, a reference source was developed to improve reproducibility and comparability of results obtained by different research groups. The simple, inexpensive and robust COST Reference Microplasma Jet was presented and described in detail. Two probes integrated into the device allow a measurement of current and voltage. With high enough temporal resolution, these measurements yield the input power into the electrode system of the COST Reference Microplasma Jet. This is a vast improvement compared to the usually available generator readings for the power input. Those are measured at the entrance and not at the exit of the matching network and are hence influenced by cables, matching elements and so on.
A set of basic power, temperature and OES measurements was described that will be used for the comparison of different devices.
The complete technical drawings of the COST-Jet and information on acquisition or assembly will be available on request online (www.cost-jet.eu). We would like to invite any researcher interested in performing measurements using a COST Reference Microplasma Jet to contact us.
To demonstrate the reproducibility of the performance of the COST Reference Microplasma Jet, two sets of the basic characterizations described above are presently being performed with a total number of five COST Reference Microplasma Jets. One set describes the comparison of the results at one institute, while the second set expands on the comparison of measurements at the participating institutes. The results of these investigations will be presented in a successive publication. A further planned publication will give details on the bio-medical protocols.
Acknowledgments
This project was initiated within the EU COST action MP1101 'Biomedical Applications of Atmospheric Pressure Plasma Technology'. The development and investigations presented here were supported by the 'German Research Foundation' (DFG) in the frame of the 'Package project PAK 816: Plasma to Cell Interaction in Dermatology' and the 'Research Unit FOR 1123: Physics of Microplasmas' within the Research Department 'Plasmas with Complex Interaction' of the Ruhr-Universität Bochum. This work was also funded by the UK Engineering and Physical Sciences Research Council (EPSRC) grant numbers EP/ K018388 and EP/H003797. We would like to thank V Scharf for proofreading the manuscript and her continuous support, as well as S Burhenn and B Biskup for experimental support and photography. Data created during this research is available at the following DOI:10.15124/8ee73b0c-4bbf-4d28-a860-287944a0bfb4 and on the project's website www.cost-jet.eu.