
Biogas Produced by Anaerobic Digestion Process and Biodiesel from Date Seeds


School of Mechanical & Manufacturing Engineering, Dublin City University, 9 Dublin, Ireland
*
Author to whom correspondence should be addressed.
Energies 2021, 14(16), 4851; https://doi.org/10.3390/en14164851
Submission received: 2 July 2021
/
Revised: 28 July 2021
/
Accepted: 2 August 2021
/
Published: 9 August 2021
(This article belongs to the Special Issue Residual Resource Recovery for Bioenergy and Biomolecule Production in a Circular Economy: Sustainable Process Design and Technoeconomic Feasibility)
Abstract
:Dates are an important food source in many countries that produce different types of dates. Dates have a significant amount of waste, either from planting or eating them. A large amount of seeds are produced from eating it. This study is considered to explore the quantity and the quality of biogas produced from the Sagai date seeds through the anaerobic digestion process (AD) before and after oil extraction and exploitation of oil in biodiesel production. In addition, the study aims to tests the resulted digestate from the AD process. This test was performed to ensure that the digestate contains the three basics elements (N, P and K) to be used in agriculture. In its preparation, the date seeds were ground after washing via a grinding machine without exposure to any other treatment process. Design of Experiments (DOE) was applied in determining the effect of temperature, volatile solid and sludge quantity on the resulted biogas. The energy balance at the optimum results was calculated. The highest biogas volumes from the AD of date seed before and after oil extraction were 4140 cc and 3534 cc, respectively, at 37 °C, 4.2 g-VS and 50% sludge quantity. While the highest methane/g-VS were 1143.8 cc/g-VS and 949.6 cc/g-VS, respectively, at 37 °C, 1.1 g-VS and 50% sludge quantity. The oil obtained using the Soxhlet method at 70 °C, 1:4 ratio of date seeds to n-hexane solvent and 5 h reaction time was 16% of the date seed mass (79% biodiesel and 9% glycerine). Therefore, the resultant effect from the main findings indicated that the study supports the investigation of the possibility of exploiting date seeds in the production of biogas, biodiesel and bio-fertiliser.
1. Introduction
The palm tree existed more than 5000 years ago. It grows in extreme climatic conditions, which normally not ideal for the growth of many other plants [1,2]. It can grow and survive in arid, semi-arid and hot climate regions [1]. A palm date is scientifically known as “phoenix dactylifera L.”. It is an essential food for many countries such as the Middle East, North Africa. It is one of the oldest and main staple food in this region due to its content of several nutrients [2]. Its composition and other contents of vitamins and minerals make it a highly nutritional and health value products. A lot of people in many countries where it is being produced depend on it for their daily diet as a source of food. Even though dates are rich in sugars, the Glycaemic Index of date is low and therefore, their regular consumption do not lead to health worries [3]. Some of the well-known types of dates are Sagai, Ajwa and Sukkary [4]. Dates are processed in mass production to produce many products such as date syrup and date paste [5,6]. The seed is one of the wastes produced from the date, which annually estimated at more than 960,000 tons. It is a solid rectangular body inside the dates, tends to be brown in colour [7,8]. The date seed is used as a source of energy, nutritious drinks and polymer components [9,10,11]. In addition, some studies extract oil from the date seed in order to produce biodiesel [12,13,14,15]. Date Seed Oil is also used in cosmetic industries such as creams, shampoos and soaps [16]. It consists of more than 90% carbohydrate, protein and lipids and this enhances its use as a source of biogas production through the AD process [17]. This high carbohydrate percentage is a catalyst for microbial fermentation in the AD process [18]. Date palm tree produces many other wastes such as leaves and fibre [19]. Date palm fibre can be used as a filler and reinforcement material [20,21].
The annual production of dates in 2004 was estimated at approximately 7,000,000 ton, while the value of the resulting waste was estimated at 2,000,000 ton [22]. The total production reached more than 9,000,000 tons annually in 2019, which harvested in approximately 1,400,000 ha [23]. The disposal of these wastes in landfill has contributed to increasing the harmful emissions into space, resulting in the increment of global warming across the globe [24]. The structure of date fruit is known to consist of three parts: seed, skin, date flesh (pulp) and endocarp. The largest share of date seed weight is for the skin while the seed represents 10–15% [5] of the whole date weight. The seed is the main waste of dates and is often used as animal feed [5,25]. Egypt, Iran, Saudi Arabia, Algeria and Iraq are the most prolific producers of dates in 2012. The total production of dates in the world was estimated at 7,500,000 mt (metric ton). The share of the five countries of total production was about two third of the world’s production. [23,26]. In 2018, Egypt, Saudi Arabia and Iran produced nearly half of the world’s production, by an increase of about 25%. In contrast, Tunisia is the world’s largest exporter of dates, with more than 17.5% of global production in 2018 [11].
Jaafar [27] showed that the amount of biogas produced from AD in thermophilic conditions at 55 °C was estimated to be 570 cc/g-VS. The methane percentage was found to be 67%. Zahdi Date Seed was treated by boiling it in water and then allowed to cool down wherein the resulted feedstock was washed and filtered twice. Lattieff [24] found that 15% of Digal Date Seed/water produced the highest amount of biogas of 182 cc/g-VS at 37 °C and for 28 days. The biogas volume was increased to 203 cc/g-VS when using recycled digestate waste. In his study, the pre-treatment process for date seed was not discussed in detail. The researcher mentioned that the date seed were pitted and shredded before the AD process.
The studies on AD of oil-extracted dates are scarce, where only one study looked at the production of biogas from extracted oil of two types (Khalas and Khudari) of date seed [28]. There are some studies which researched extracting oil from date seeds to produce biodiesel [24,27]. In one study [28] of biogas production from raw and oil-spent date palm seeds, two types of date seeds (Khalas and Khudari) were mixed with wastewater treatment sludge. The seeds were washed by water to remove the remains and dried in oven for 24 h at 50 °C. The seeds were crushed using a steel hammer, then ground by using a household mixer and sieved into three different sizes 1.18–3.75, 0.6–1.18 and 0.425–0.6 mm. Grounded date seeds co-digested with wastewater sludge at seed/sludge total solids ratios of 0%, 2.5%, 5%, 7.5%, 10%, 20% and 40%. The incubation period for the reactors was 14 weeks. There was no significant effect of the date seed grain size on the biogas volume produced, although the smallest grains size produced slightly more biogas. The study found that there was no significant difference in the biogas produced from the raw date seeds and extracted oil date seeds. The highest biogas volume reached was 390 cc/g-VS when the seed/sludge ratios were 0–10%. Mixtures containing higher percentages of date seeds/sludge (20% and 40%), they provided higher amounts of VS, however the yield of biogas was lower than that for the sludge alone. The reason for this, was due to inhibition and acid accumulating which was determined as a result of low pH. The oil extracting process improved digestion efficiency and decreases the inhibition of biogas production. The average methane ratio from the total biogas was about 65%. A Soxhlet extraction method was used to extract oil from the date seeds with a solvent mixture with methanol, chloroform and water volume ratio of 2:1:0.8, respectively [28].
The increasing demand for energy in addition to environmental pollutants from fossil fuels has contributed to the search for more environmentally friendly and less harmful fuel. Many countries have turned to produce biofuels in different quantities [29]. Therefore, biodiesel may be considered as one of the appropriate solutions to these damages [30]. Biodiesel is a fuel that could be derived from vegetable oil, animal oil and fats and cooking oil waste. It is renewable and suitable for diesel engines [31,32,33,34]. It is non-toxic, biodegradable and does not contain sulphur and aromatics [35]. Biodiesel has fewer CO2 emissions compared to conventional diesel, so it contributes to environmental conservation. Therefore, it is expected that the dependence on it will be significant in the future [36,37]. Clean and inexpensive biodiesel is produced by conversion technologies from bio-waste oils [38]. The cost of substrates, i.e., bio-waste oils, the produced energy efficiency and the conversion process time are some of the most important challenges and factors in determining the cost of biodiesel [39,40]. The cost of substrates accounts about 75% of the total cost of producing biodiesel, the use of low-cost substrate reduces the process cost [41,42]. About 350 substrates have been identified for the production of biodiesel that is extracted from crop oils, algae oils, waste cooking oil and animal fats [34]. There are several techniques for extracting oil from the seeds; mechanical, chemical and enzymatic techniques. Mechanical and chemical techniques are the most used. The seeds are separated from the fruits and then dried either in the oven or by placing them in the air before the extraction process [34]. Soxhlet extraction is an extraction method used widely in several studies [12,13,43,44].
Amani et al. (2013) [43] found that the properties of biodiesel extracted from date seed oil were optimal when the cetane number was 60.3, the iodine value was 46, the viscosity was 3.48 mm/s and at a flashpoint temperature of 140 °C. The biodiesel resulting from this study was affected by its high pouring point which was −1 °C, which limits its use in cold regions. In this study the seeds were ground using a heavy-duty grinder. The oil was extracted by using a Soxhlet extractor and n-hexane solvent for 4 h. The solvent was separated from the resulting oil by using a rotary evaporator and passing it through a filter for purification. Methanol and sodium hydroxide were added to the date seed oil and reacted for two hours at 60–65 °C using reflux and constant stirring. The reaction resulted in a mixture of biodiesel and glycerine that was separated by a separating funnel based on their different densities. To remove impurities from biodiesel, it was washed with hot water at (70 °C) and dried with a rotary evaporator.
Jamil et al. (2016) [44] found during their study in producing biodiesel from date seed oil that the highest yield of date seed oil was 16.5% (the weight difference between a pre-dried sample and extracted sample divided by dried sample). The date seeds were washed to remove impurities and dried in air for 6–7 days, prior being dried in the oven for 12 h at 70 °C. The date seeds were ground in a mechanical grinder to obtain the required particles sizes of 250–300 nm. The optimal conditions for producing oil, whilst using the Soxhlet device, were at a reaction temperature of 70 °C, a ratio of solvent to seeds 4:1 and for 7 h of extraction. To produce biodiesel, a reaction was conducted using methanol for one hour at 65 °C, where the ratio of methanol to oil was 6:1. It was found that the biodiesel produced had a cetane number of 58.23, density of 870 kg/m3, cloud point of 4 °C, pour point of −1 °C and viscosity of 3.97 mm2/s at 40 °C.
Ali et al. (2015) [12] studied the effect of particles size of Zahdi date seed on the oil produced volume. They used the Soxhlet device with several solvents to extract the oil. The study found that the highest percentage of oil was 8.5% (the weight of oil extracted divided by weight of date seed used) for 2 h, when the particles size of the date seed was 0.425 mm and using n-hexane as a solvent. The seeds were washed, dried in the air and milled using a mechanical grinder to several sizes (0.425 and less, 1 mm and less and 1.2 mm and less). Five different solvents (n-hexane, methanol, 2-propanol, chloroform and toluene) were used to find the best solvent that provided the highest oil percentage and for extraction time 1, 2, 4 and 6 h. In a study by Elnjjar et al. (2018) [13] in the production of biodiesel from the seeds using the Khalas and Allig date, the Soxhlet and Folch methods were used to extracted oil from the date seeds. Date seeds were washed and dried in the oven at 80 °C for 12 h. The date seeds were then milled to five different sizes (300 nm, 0.1–0.3 mm, 0.3–0.85 mm, 0.85–1.18 mm and >1.18 mm) and compared to the whole date seeds. The study found that the particle size of the date seed has a noticeable effect on the percentage of oil produced. Where the oil percentage produced increased with the decreasing date seed particles size, except for the particles sizes of 300 nm. The oil produced from both date seeds using the Soxhlet method was 10.4% and 10.5% of the date seed mass, while the ratio was 9.0% and 9.7% using the Foch method. The percentage of oil produced was determined by dividing the mass of extracted oil by the mass of dried sample used. They also found that the Soxhlet extraction method was more productive than the Folch method, for all particle sizes and both date seeds types. Table 1 illustrates the biodiesel characteristics of different date seed types.
Producing biodiesel from natural oils, also produces glycerol as a by-product of up to 10% [45]. Many previous studies indicated that the percentage of glycerine from the biodiesel transesterification process ranges between 9–9.6% of the total product [46,47,48,49,50]. Glycerol or as typically known as glycerine is formed during the transesterification process with ethanol or methanol [51]. Glycerine is environmentally friendly, harmless to human health, soluble in water and is colourless and odourless [52]. Glycerol does not mix with biodiesel, it polymerises at high temperatures resulting in the emission of a toxic gas [53]. Therefore, it is more expedient to exploit the glycerol produced from the production of biodiesel [54]. Glycerine is available in different forms: Crude, Purified and commercial [55]. The purity of glycerine affects its final use. Crude glycerine is less preferred in use, so it is sold to large refineries to purify it. Purified glycerine is preferred in food, pharmaceutical and cosmetic manufactures, while commercial glycerine is considered optimal in medical usages [29,56].
The aim of this study is to explore the quantity and quality of biogas produced from date seed after grinding pre-treatment without exposing them to any other treatment such as heating or crushing. The effect of oil extraction from the date seed on biogas quality and quantity will also be examined. The ability of biodiesel and glycerine from dates seed oil to enhance the AD process will be investigated as well in this study. Moreover, the effect of oil extraction on the resulting digestate will be clarified as well, to gain more knowledge about its components and suitability for agriculture applications. The effect of some factors affecting AD process, such as temperature, volatile solid concentration and sludge quantity, were attested during this study. The effect of interaction of these factors on the biogas produced were analysed to reach to the optimal composition to maximise the biogas and methane (CH4) percentage and to calculate the energy balance at the optimal settings.
2. Material and Methods
2.1. Feedstock and Inoculum
Sagai dates seed was brought from Saudi Arabia. A kilogram of Sagai Date Seed was prepared and washed with water to remove impurities and flush. It was left for three days in the air to dry. The date seed were then ground by using a grinding machine. The grinding process was performed without any additional process to soften the seeds such as heating or hammering to ensure that the seeds are not affected by any external factors as well as to reduce the operational costs. The grinding process resulted in a powdered date with a practical range of 800–355 μm, post sieving. The oil extraction process for the production of biodiesel and glycerine was carried out using the Soxhlet device, according to the AOCS official method Am 2–93 [57]. Each time 20 g of date seed powder was placed in a paper thimble and covered with a piece of cotton to prevent the feedstock from leaking into the extraction device. The n-hexane organic solvent was used for the extraction process at a ratio of 1:4 (seed/n-hexane). The mixture was left to react at 70 °C for 5 h under reflux and continuous stirring. The n-hexane solvent was separated from the oil by a rotary evaporator. To produce biodiesel and glycerine, Amani (2013) [43] method was followed. The date seed oil was heated at 60 °C, then methanol was added to the oil at a ratio of 1:5 (methanol to oil) and approximately 0.4 g of sodium hydroxide. The components were left to react for 2 h under constant stirring and reflux. After producing the biodiesel and glycerine, the alcohol was extracted from the mixture using a rotary evaporator. Biodiesel and glycerine were placed in a separating funnel to separate them from each other due to their differences in densities. The impurities and remaining glycerine were removed from biodiesel using hot water and then dried in a rotary evaporator [43,44].
The inoculum sludge was brought on the same day of performing the experiment in a 20 L container from Green Generation Ltd., Numey, Ireland. The total solid (TS) of the sludge was found equal 6.5% while the volatile solid was equal 4.51%. The pH of the inoculum was measure and found to be equal to 8.1. Sigma Aldrich Ireland provided chemicals used in the study such as (n-hexane and methanol).
Total Solid and Volatile Solid
According to standard methods (NREL/MRI LAP 1994, 2008), the TS and volatile solid were measured and adjusted as designed in the experiment matrix [58]. The volatile solid value of the grounded date seeds was calculated by taking three samples and placing them in the oven at 105 °C. The MS and the TS of all the samples were calculated then they were burned in the oven at 575 °C for 4 h. Thereafter, the volatile solid was determined based on the resulting ash weight. Consequently, based on the previous studies [23,27,28] and the preliminary experiments, found that the optimal value of the volatile solid lies between 1.1 and. 4.2 g-VS.
It was noticed that each gram of extracted oil date seed powder would give 0.867 g-VS. Accordingly, the volatile solid of extracted oil date seed was measured and adjusted [58] as designed in the experiment matrix as follows: 4.85 g of date seed powder to yield 4.2 g-VS. As well, 3.06 g of date seed powder gave 2.65 g-VS, and 1.27 g of the date seed powder provided 1.1 g-VS. Date seed powders were placed in a 500 mL flask and sludge was added to the flask at different quantities (25%, 37.5% and 50%) from the total of 400 mL. Water was added to the mixture in a variable ratio to raise the flask to 400 mL. The moisture content and the TS were calculated as shown in Table 2.
2.2. Anaerobic Digestion of Date Seed
For each reactor a specific amount of date seed powder, which would give the required amount of volatile solid was placed in a 500 mL flask. This was carried out according to experiments matrices. Sludge was added to the mixture with different percentages (25%, 37.5% and 50%) from the total sample size of 400 mL. Then, completing the volume to 400 mL by adding water. The flasks were connected to aluminium gasbags to form the reactor. Then the O2 was withdrawn from the reactor by flushing nitrogen gas into it. A vacuum pump was used to pump out the gases from the reactor. This process was repeated twice to ensure that the reactor is nearly free of O2. Reactors were placed in three water baths with three different temperatures. Each sample was replicated three times. The incubation period was set to 21-days. The reactors were shaken on a daily basis. The produced biogas volume was measured using a volumetric cylinder. It uses gas-sampling tubes that were installed in a gas jar with confining liquid. The biogas was measured twice during the experiment period (in day 9 and at the end of the incubation period).
The biogas analyser model biogas5000 Geo-tech was used again to measure percentages of the biogases produced (mainly: CH4, CO2, O2 and others gases). The pH of each reactor was measured at the end of the period using Hanna Precision pH meter. In addition, the residue of the process was tested to determine its validity to be used as an organic fertiliser. This test was carried out at Advance Laboratory Testing Ltd., Newbridge, Ireland.
2.3. Biogas Measurement
The resulting biogas was measured twice during the experiment on day 9 and day 21. Due to that some bags are almost full on the eighth/ninth day. The volumetric flask was filled with a specific amount of water for comparison. An inverted cylinder of 250 mL was placed in the volumetric flask and the biogas is pumped into it. The water level increased to reach a new level. The difference between the two levels represented the volume of the biogas produced.
2.4. Energy Balance
The energy balance based on mechanical processing is calculated using the following formula as shown in Equation [58]:
Bs = (CH4%) × (9.67)
While; Bs is the energy content of biogas produced by CP in [kW h/m3], CH4% is the average of methane percentage of each sample. The value 9.67 is a reference value and indicates the energy quantity of 1 Nm3 of biogas [59]. The energy gained from a gram of volatile solid of CP from the biogas produced is calculated by the following formula:
Ep = Bp × Bs
Furthermore, Ep [Wh/g-VS] is the energy gained from 1 g of volatile solid of CP while Bp is the biogas volume produced from 1 g of volatile solid of CP. The formula to calculate the electricity consumed by pre-treatment to treat a gram of volatile solid of CP is:
Ec = Ept⁄VSm
In the same vein: Ec is the electricity consumed by pre-treatment to treat a gram of volatile solid of CP in [Wh/g-VS] and Ept is the electricity consumed in the pre-treatment process that measured by a prodigit kilowatt-hour meter. The total amount of volatile solid in the machine indicated as VSm. The net energy produced by a gram of volatile solid of treated CP (Net Ep) in [Wh/g-VS] was calculated by the formula:
Net Ep = Ep − Ec
The energy gain percentage is the difference between the energy gained by the biogas from treated CP (Ep-treated) and the energy produced from the biogas from untreated CP (Ep-untreated). When the energy gain % is negative, it indicates that the mechanical pre-treatment of CP caused loss of energy compared to untreated CP. The energy gain % was calculated by the following formula:
Energy balance % = (Net Ep − Ec)/Ec
3. Results and Discussion
3.1. General Results
The p-value of all models throughout this study, indicated the models were significant. The impact of each factor, the interaction between factors and the checked probability (“p-value”) of the model are described in the ANOVA tables (5,6,9,10). These tables illustrate significant model terms. The tables also show that models were adequate as all values of R2, predicted R2 and adjusted R2 were close to 1. For all models the Predicted R2 was in reasonable agreement with the Adjusted R2 as the difference between them was less than 0.2. The model graphs aid in illustrating the behaviour of each response as the factors vary. In Figure 1 and Figure 2 (probability graphs) all of the points were close to the distribution line, this indicates that the distribution was normal and that the adaptation of the model was adequate, which shows the normal probability and predicted volatile solid actual residual values. As the majority of the points did not deviate from the line, the agreement between the actual and predicted response was excellent.
3.2. Date Seed Results
The Biogas, CH4% and CH4 volume produced from sludge given in Table 3 are expanded in Figure 3, Figure 4 and Figure 5, to show the Biogas, CH4% and CH4 produced from sludge and after adding the date seed. The biogas yield increased due to the addition of the date seed to the sludge at all temperatures. The highest biogas was found to have increased by approximately five times at 37 °C, from around 880 cc to 4140 cc as indicated in Figure 3. Figure 4 and Figure 5 show the effect of adding date seed to sludge on the percentage and amount of methane produced. Again the highest rise in methane percentage was found at 37 °C, (from 52.9% to 71.1%). While Figure 5 shows the apparent rise due to the addition of date seeds occurred at all temperatures. The highest increase in the amount of methane was again at 37 °C from 466 cc to 2430 cc.
While the experiment matrix shown in Table 4 presents the conditions of each experiment run and the associated response values. It is clear from run #15 that the highest volume of biogas of 4140 cc was achieved at 37 °C, volatile solid value of 4.2 g-VS and sludge quantity of 50%. While the lowest biogas of 1256 cc was obtained at the same temperature, volatile solid value of 1.1 g-VS and sludge amount of 25% (run #16). In both cases the CH4 percentage was close to each other at 58.7% and 57.9%, respectively. In contrast, if the amount of CH4 per volatile solid is to be considered, then its value of 661 cc/g-VS (run #16) would be higher in the second case due to a lower volatile solid of 1.1 g-VS was used. However, the amount of CH4 per volatile solid in the first case was 579 cc/g-VS (run #15), due to a higher volatile solid of 4.2 g-VS was used.
However, the highest amount of Biogas per g-VS of 1838.9 cc/g-VS was obtained at 37 °C, volatile solid value of 1.1 g-VS and at 50% sludge (run #13). At these conditions the highest CH4/g-VS quantity of 1143.8 cc/g-VS was recorded. On the other hand, the lowest value of Biogas/g-VS from of 749.5 cc/g-VS was reported at 34 °C, 2.65 g-VS and 25% of the sludge (run #12). The minimum CH4/g-VS of 456.4 cc/g-VS was obtained from run #17 at 40 °C, 2.65 g-VS and 25% sludge.
A methane percentage ranged between 51.9% and 71.1% was achieved which is higher than that recorded by Jaffar [27]. While the CO2% was between 13.0% and 26.6% lower than that found in the same study [27]. Table 4 shows the relationship between CH4% and CO2%. It was found that as the CH4% increased the CO2% decreased. The highest CH4% and lowest CO2% was found at the following conditions: 37 °C, 4.2 g-VS and 25% sludge quantity (run #8). In contrast, the lowest CH4% of 51.9% was found from run #1 at the following conditions: 40 °C, 2.65 g-VS and 50% of the sludge. The highest CO2% was found from run #11 at the following conditions: 37 °C, 2.65 g-VS and 37.5% of the sludge.
When comparing the amount of biogas produced in this study with previous studies [24,27], the volume of Biogas/g-VS produced in this study was higher than the amount that recorded by Lattieff [24]. This increase is attributed to the treatment method followed in this study and inoculum used. Furthermore, it was found that the amount of biogas was two times higher than that reported in [27]. This is could be due to the treatment method used on date seed in this study as no boiling or exposing of the date seed to elevated temperatures was conducted (i.e., only grinding). In addition, the difference in the inoculum used may be a reason for the change in the volume of the resulting biogas. However, due to the similarity in the components of most types of dates and their proportions, this study’s results are applicable to other types of date seeds, at different times.
3.2.1. Model Estimation
The ANOVA Table 5 and Table 6 show that models were significant. The coded Equations (6)–(10) are shown below with each response. The influences of volatile solid (B) and sludge quantity (C) were significant for all responses, while there was no significant influence of temperature (A) on the Biogas/g-VS and CH4/g-VS. The interaction of (BC) had a significant influence on the Biogas/g-VS, CH4% and CH4/g-VS responses. In contrast, the CH4% and CO2% were significantly affected by the interaction of temperature and volatile solid (AB). There was no significant influence for the interaction between the temperature and the amount of the sludge (AC) on all responses.
3.2.2. Biogas
As its clear from Figure 6, the highest biogas produced was found at volatile solid of 4.2 g-VS. In addition, it is clear that the biogas produced was directly proportional to the volatile solid and sludge quantity. This is in line with what Igoni et al. [60] mentioned that the volume of biogas increased with an increase in the volatile value in the batch reactor. The biogas produced was slightly affected by temperature variation as shown in Figure 6. This differs from what was stated in Lattieff [24], where the volume of biogas produced decreased by 27% when the temperature changed from 37 °C to 55 °C. This difference may be due to that the reaction changed from mesophilic to thermophilic condition and recycled digestate used. Figure 7 illustrates that the highest biogas produced was at volatile solid of 4.2 g-VS and at any temperatures. The coded Equation (6) demonstrates that the most factor affect the biogas volume was the volatile solid followed by sludge quantity and temperature. The effect of these factors on the biogas yield were a positive effect. However, this effect was on the quantity of biogas only. The effect of the factors on the quality of the biogas will be discussed later.
The coded Equation (6) for Biogas is:
Biogas = 2619.21 + 6.75A + 1018.00B + 393.00C − 145.97A2 + 102.53
3.2.3. Biogas/g-VS
According to Figure 8 it can be seen that, the highest amount of Biogas per gram volatile solid produced was found at volatile solid of 1.1 g-VS. The reason for that when calculating the amount of Biogas/g-VS the biogas produced (divided by the volatile solid value). The higher the volatile solid value, the less volume of Biogas/g-VS achieved and vice versa. In contrast, direct proportion between the sludge quantity and the volume of Biogas/g-VS produced. The effect of temperature on Biogas/g-VS remained low. Figure 9 shows the interaction effect between volatile solid and sludge quantity on the response. It is evidence from this figure that, by using volatile solid of 1.1 g-VS, the maximum Biogas/g-VS of 1800 cc/g-VS could be achieved if the sludge quantity is kept at 50%. From Figure 9, using a volatile solid of 4.2 g-VS, the amount of Biogas/g-VS decreased to around 900 c/g-VS, observing that there is no significant difference between both sludge quantities. This is due to the increase of feedstock that lead to inhibit the reaction thus the biogas produced decreased [17]. The effect of the volatile solid and the sludge quantity on the response was illustrated in Figure 10. It shows that the maximum Biogas/g-VS yield was when the volatile solid at its minimum values, sludge quantity more than 45% and 37 °C. The effect of volatile solid was highest on Biogas/g-VS followed by sludge quantity and the interaction between them according to the coded Equation (7). The effect of volatile solid and its interaction with the sludge quantity were negative. While increasing the amount of sludge positively affected the Biogas/g-VS.
The coded Equation (7) for Biogas/g-VS is:
Biogas/g-VS = 987.45 + 29A − 304.56B + 185.14C − 125.95BC + 216.62B2
3.2.4. CH4%
It is evident from Figure 11 that the highest amount of methane percentage was achieved at 25% sludge quantity. The figure shows that the increase of temperature and sludge quantity had a negative effect on the CH4%. An increase in temperature lead to instability in the reaction and an increase in the proportion of ammonia, thereby less methane production [24,61]. The quantities of minerals present in the sludge influences on the methane production. Sludge containing large amounts of Ni and Mo helps in improving the digestion process. While, an increase of Al and Zn proportions in the sludge leads to inhibit the digestion process [62]. The negative effect of sludge quantity remained until it reached the centre value and then rose slightly. From Figure 12 and Figure 13 it can be seen that the two interaction effects between volatile solid and both temperature and sludge quantity. The more volatile solid lead to an increase in CH4%. The ratio of feedstock to inoculum is an important factor in the AD process [63]. Setting this ratio plays a major role in stabilising the digestion process and the biogas yield. Increasing this ratio gives high methane production in a longer incubation period. On the other hand, the intermediate ratio gives a high yield of methane over a shorter time [63]. It is clear from Figure 12 that the methane percentage decreased as the temperature rose given that no difference in percentage of volatile solid at both settings was observed at 40 °C. Figure 13 illustrates that the CH4% reached to its peak at value of 4.2 g-VS and sludge quantity of 25%. This percentage decreased sharply by decreasing the volatile solid value from 4.2 g-VS to 1.1 g-VS. The CH4% was similar at a volatile solid of 1.5 g-VS for both sludge quantities (Figure 13). The coded Equation (8) shows the effect of the interaction between the volatile solid and the sludge quantity were the highest on CH4%. These effects are related to the quality of the biogas not the quantity.
The coded Equation (8) for CH4% is:
CH4% = 54.59 − 3.95A + 2.93B − 3.10C − 3.28AB − 4.17BC + 2.82B2 + 4.37C2
3.2.5. CO2%
Figure 14 demonstrates that the lowest amount of CO2% was achieved at sludge quantity of 25%, proving the inverse relationship between CH4% and CO2%. From the same figure it can be noticed that the CO2% directly proportional with temperature. Furthermore, CO2% increased by increasing the volatile solid and sludge quantity until they reach to the centre values. This was followed by a decreased in the CO2% by increasing of the volatile solid and sludge quantity. Figure 15 shows the effect of interaction between temperature and volatile solid on the response. It is clear from that the lowest CO2% was found when using the volatile solid of 4.2 g-VS at 34 °C. Figure 16 illustrates the wide design space which produced the highest CO2% at volatile solid between 1.7–3.6 g-VS, 37.5% sludge and at temperatures between 37–40 °C. The coded Equation (9) shows the effect of the interaction between temperature and volatile solid followed by the sludge quantity were the highest on CO2%:
CO2% = 25.75 + 1.44A − 1.27B + 1.74C + 1.75AB − 3.54B2 − 5.77C2
3.2.6. CH4/g-VS
The highest methane per gram volatile solid yield was found at the volatile solid of 1.1 g-VS. Figure 17 illustrates the indirect proportion between methane per g-VS and volatile solid. The graph also shows that the CH4/g-VS increased slightly by increasing the sludge quantity. Figure 18 shows the effect of the interaction between volatile solid and sludge quantity on CH4/g-VS. The highest methane per g-VS was found at a volatile solid of 1.1 g-VS and 50% of sludge quantity. In contrast, lower amounts of methane per g-VS were found at volatile solid of 4.0 g-VS and at both sludge quantity percentages. Even though increasing the volatile solid amount increases the volume of biogas produced and the methane percentage, the highest CH4/g-VS was found at lowest volatile solid amount. This is because when calculating the CH4/g-VS, it was divided by amount of volatile solid. Therefore, the more volatile solid amount, the less CH4/g-VS and vice versa. The coded Equation (10) shows the highest indirect effect of volatile solid on CH4/g-VS:
CH4/g-VS = 564.93 − 18.47A − 151.32B + 86.28C − 116.85BC − 53.18A2 + 154.52B2
3.3. Extracted Oil Date Seed Results
Table 7 displays the biogas, CH4% and methane produced from sludge only. Figure 19 illustrates the influence of adding the extracted oil date seed on the biogas quantity. The volume of biogas reached 3534 cc compared to 804 cc before adding date seeds at 37 °C. The same scenario also occurred at 34 °C and 40 °C however with a slightly less increase, as shown in Figure 19. The extracted oil date seed experiment matrix is shown in Table 8. It illustrates the conditions of experiment runs and the values of the responses. From Table 8 it can be seen the highest biogas yield was 3534 cc (run #10) at 37 °C, of 4.2 g-VS and 50% sludge. In contrast the lowest biogas volume was 971 cc (run #4) achieved at 37 °C, 1.1 g-VS and 25% sludge. The difference in CH4% in both cases was quite small at 56.5% and 54.6%, respectively. The CH4/g-VS was 482.5 cc/g-VS (run #4) at the lowest biogas yield, which is a little higher than the first case 475.7 cc/g-VS (run #10). That is due to a lower volatile solid of 1.1 g-VS was used in the second case and the higher volatile solid value (4.2 g-VS) was used in the first case.
Furthermore, the highest amount of biogas/g-VS was 1555.1 cc/g-VS and the highest value of CH4/g-VS was 949.6 cc/g-VS (run #9) were achieved at 37 °C, 1.1 g-VS and 50% sludge. On the other hand, the lowest value of biogas/g-VS was 641.1 cc/g-VS reported at 34 °C, 2.65 g-VS and 25% of the sludge (run #15). The minimum CH4/g-VS was 344.4 cc/g-VS (run #11) was found at 40 °C, 2.65 g-VS and 25% sludge.
Methane percentage ranged between 50.7% and 69.3%, while CO2% was between 15.6% and 27.4%. Table 8 illustrates the indirect relationship between CH4% and CO2%. The highest CH4% and lowest CO2% values were 37 °C, 4.2 g-VS and 25% sludge (run #5). In contrast, the lowest CH4% was found at the following conditions: 40 °C, 2.65 g-VS and 50% of the sludge (run #1). The highest CO2% (run #8) was found at 37 °C, 2.65 g-VS and 37.5% of the sludge.
Figure 20 and Figure 21 display the effect of added extracted oil date seeds on the quality of the resulting biogas. It is evident from Figure 20 that the CH4% reached 69.3% when the date seeds were added compared to approximately 52.3% of sludge only at 37 °C and a little lower values of CH4% at 34 °C. In contrast, at 40 °C, the effect of adding date seeds on CH4% was insignificant. Figure 21 shows the effect of adding date seeds on the methane yield which increased more than five times at 37 °C from 379 cc to 1997 cc.
Comparing the amount of biogas/g-VS that was resulted from this study with the findings of Shanableh and Radeef (2017) [28], it can be seen that the biogas produced from this study was much higher, almost four times. Furthermore, the methane yield from this study was higher approximately by the same proportion. The reason for this may be due to several factors; including the exposure of the date seeds to drying in the oven at 50 °C for 24 h, crushing the date seeds by a steel hammer and different solvent used in the oil extraction process (mixture of methanol, chloroform and water). In addition, the grinding process using a blender did not grind the core of the date seed so it was excluded [28]. The study found no significant difference between the quantities of biogas before and after oil extraction. The use of small quantities of date seed/sludge mixtures (30 mL) may be the reason for the differences in biogas quantities been somewhat similar, especially during the three-week retention time [28].
3.3.1. Model Estimation
The ANOVA Table 9 and Table 10 show that models were significant. The coded Equations (11)–(15) are shown below with each response. The influences of volatile solid (B) and sludge quantity (C) were significant on all responses, while there was no significant influence of temperature (A) on the biogas/g-VS and CH4/g-VS. The interaction of (BC) had a significant influence on the biogas/g-VS, CH4% and CH4/g-VS responses. In contrast, the CO2% were significantly affected by the interaction of temperature and volatile solid (AB). There was significant influence for the interaction between the temperature and the amount of the sludge (AC) only on CH4%.
3.3.2. Biogas
From Figure 22, it can be seen that the highest biogas achieved was found at 4.2 g-VS of volatile solid. The same figure shows that the biogas yield is directly proportional to the volatile solid and sludge quantity. This corresponds to what was stated in Shanableh and Radeef study [28]. At the incubation period of 3 weeks, when the date seeds/inoculum ratio increased, the biogas produced increased. Moreover, the study found that the inhibition decreased at 20% and 40% ratios due to the oil extraction from date seed. In addition, the figure shows the slight effect of temperature increased on the amount of biogas produced. Figure 23 demonstrates that the highest biogas was found at more than 3.7 g-VS of volatile solid, 50% of the sludge and at all temperatures. The coded Equation (11) shows that the highest effect on the biogas volume was the volatile solid followed by sludge quantity. These factors affected positively on the biogas yield and their effect was on the quantity of biogas only. The effect of the factors on the biogas in quality terms will be discussed later in this section.
The coded Equation (11) for Biogas is:
Biogas = +2213.00 + 73.13 A + 865.75 B + 409.88 C + 56.75 AB + 10.00 AC − 0.2500 BC − 5.25 A2 + 55.00 B2 − 15.25 C2
3.3.3. Biogas/g-VS
According to Figure 24, it can be seen that the highest biogas per gram volatile solid was achieved at a volatile solid of 1.1 g-VS, because when calculating the biogas/g-VS, the biogas produced was divided by the volatile solid value. The biogas/g-VS is indirectly proportion with the volatile solid value, so the highest volume of biogas was achieved at the lowest volatile solid value. While the sludge quantity and temperature are directly proportion to the volume of biogas/g-VS produced, the interaction effect between volatile solid and sludge quantity on the biogas/g-VS is illustrated in Figure 25. From that figure it can be seen that by using the lowest amount of volatile solid, the maximum biogas/g-VS of 1600 cc/g-VS was achieved when the sludge quantity was 50%. Figure 25 also shows that at a volatile solid of 4.2 g-VS, the amount of biogas/g-VS drop sharply to around 800 c/g-VS. It can be noted that there was no significant difference between biogas/g-VS values at 4.2 g-VS, 37 °C and both sludge quantities due to the inhibition of the reaction resulting from increased the volatile solid [17]. Figure 26 shows the effect of the volatile solid and the sludge quantity on the biogas/g-VS. The highest biogas/g-VS produced was at a volatile solid of 1.1 g-VS and sludge quantity more than 45%. The coded Equation (12) illustrates that the negative effect of volatile solid (B) was highest on biogas/g-VS followed by the positive effect of sludge quantity (C), the positive effect of the square of volatile solid (B2) and the negative interaction (BC) between them (volatile solid and sludge quantity).
The coded Equation (12) for Biogas/g-VS is:
Biogas/g-VS = +831.67 + 27.14 A − 260.82 B + 190.89 C − 124.02 BC + 172.86 B2
3.3.4. CH4%
The highest methane percentage was formed at 25% of sludge quantity as shown in Figure 27. The figure also illustrates the negative effect on the CH4% when the temperature and the sludge quantity was increased. The amount of ammonia increases with increasing reaction temperature, which also leads to instability of the reaction and thus the production of methane decreases [61]. Likewise, some minerals in the sludge such as Al and Zn inhibit the digestion process. In contrast, the presence of minerals such as Ni and Mo activate the digestion process [62]. The increase in the volatile solid value did not effect on the methane percentage until it reached the centre value, then the methane percentage increased with the increase in the volatile solid value. The negative effect of sludge quantity on the methane percentage remained until it reached centre value and rose slightly. The importance of the date seed/inoculum ratio in controlling the reaction clearly affects the amount of biogas produced. An increase in this ratio leads to higher methane production at a longer incubation time. Setting this ratio at an average value yields high methane production over a shorter incubation time [63]. The interaction effects between all factors are demonstrated in Figure 28, Figure 29 and Figure 30. From Figure 28, it can be seen that the methane percentage decreased with temperature increase, noticing that no difference in this percentage was found at both volatile solid values at 40 °C. Figure 29 shows the impact of low temperature on the CH4% as a methane percentage of 65% was found at 34 °C and 25% of sludge quantity. The CH4% readily decreased by increasing the temperature, noticing, when CH4% reached its lowest value at the highest temperature of 40 °C and at both sludge quantities values. It can also be seen from Figure 30 that the highest CH4% was formed at a volatile solid value of 4.2 g-VS and sludge quantity of 25%. The CH4% clearly declined sharply when the volatile solid value shifted from 4.2 g-VS to 1.1 g-VS. When the volatile solid value was 1.75 g-VS and at both sludge quantities (25% or 50%), the CH4% was 56%, as shown in the same Figure. The 3-D surface plot in Figure 31 shows that the highest methane percentage were achieved at a volatile solid values of 3.7–4.2 g-VS, sludge quantities of 25–27% and at 37 °C. The effect of the interaction between the volatile solid and the sludge quantity was followed by the effect of the temperature were the highest on CH4%, as clarified in the coded Equation (13). These negatively affected the quality of the biogas, rather than the quantity.
The coded Equation (13) for CH4% is:
CH4% = +52.14 − 4.34 A + 2.86 B − 2.38 C − 2.95 AB + 2.98AC − 4.83 BC + 3.64 B2 + 3.97 C2
3.3.5. CO2%
As evidenced by Figure 32, a sludge quantity of 25% produced the lowest amount of CO2% proving the inverse relationship between CH4% and CO2%. The figure shows a direct relationship between the CO2% and temperature. The increase in the volatile solid and sludge quantity led to an increase in the CO2% until they both reached their centre values. The CO2% decreased after the centre values, as in at increasing values of volatile solid and sludge quantity. The effect of the interaction between temperature and volatile solid on the CO2% is demonstrated in Figure 33 which shows, that using a volatile solid of 4.2 g-VS at 34 °C, produced the lowest CO2% achieved. Moreover, the contour plot in Figure 34, shows that when a temperature greater than 36 °C was used and volatile solid values between (1.72–3.5) g-VS, the highest CO2% can produced. The coded Equation (14) illustrates the highest positive effect of the interaction between temperature and volatile solid followed by the sludge quantity on CO2%:
CO2% = +26.42 + 1.25 A − 0.9750 B + 1.65 C + 1.70 AB − 3.30 B2 − 5.10 C2
3.3.6. CH4/g-VS
It can be seen that from Figure 35 that at the volatile solid of 1.1 g-VS, the highest methane per gram volatile solid volume was obtained. The graph also shows that the CH4/g-VS decreased slightly with temperature decrease. The same Figure also shows the indirect proportion between methane per g-VS and volatile solid and the direct relation with that of sludge quantity. The interaction between volatile solid and sludge quantity on CH4/g-VS is illustrated in Figure 36. The highest CH4/g-VS was gained at a volatile solid of 1.1 g-VS and 50% of sludge quantity. In contrast, the lowest amounts of methane per g-VS were found at a volatile solid of 4.2 g-VS for both sludge quantities. The highest yield of methane per gram volatile solid was obtained at the lowest volatile solid value due to the division by the volatile solid value when calculating the methane per gram volatile solid. Figure 37 shows the highest CH4/g-VS can be achieved at 1.1 g-VS, greater than 45%sludge and at 37 °C. The highest indirect effect of volatile solid on CH4/g-VS is clear from the coded Equation (15):
CH4/g-VS = +445.47 − 18.30 A − 125.74 B + 94.31 C − 113.10 BC + 127.32 B2
3.4. Date Seed vs. Extracted Oil Date Seed
Figure 38, Figure 39, Figure 40, Figure 41 and Figure 42 illustrate the differences between the responses of date seeds before and after oil extraction. The figures show the impact of oil extraction on all responses, particularly those concerning the resulting biogas quality. Figure 38 displays the difference in biogas before and after oil extraction, where the largest decrease in biogas volume was 22.7% from sample #9, while the smallest decrease was 6.3%. The highest amount of biogas produced from date seeds (sample #12) before oil extraction was 4140 cc, while it decreased to 3534 cc after oil extraction. Furthermore, the variance in biogas/g-VS was similar to the difference in the biogas, as shown in Figure 39.
Figure 40 shows the highest and lowest differences in CH4% were 10.98% (sample #6) and 1.12% (sample #13), respectively, while the highest and lowest differences in CO2% were 4.14% (sample #15) and −20% (sample #10), respectively, as shown in Figure 41. The highest percentage of methane before and after oil extraction from sample #10 was 71.1% and 69.3%, a decrease of 2.53%. On the other hand, the lowest amount of CO2% reached before oil extraction from sample #10 was 13% and after oil extraction, it rose to 15.6%, by an increase of 16.7%. This indicates the effect of oil removal on biogas quality.
The difference in the amount of CH4/g-VS can be seen in Figure 42, where it found that extracting the oil from date seed led to a decrease in the amount of CH4/g-VS for all sample, with varying percentages ranging from 8.59% to 27%. The highest amount of CH4/g-VS before oil extraction was 1143.8 cc and after oil extraction, this amount decreased to 949.6 cc. The decrease in the highest amounts of CH4/g-VS from date seed to extracted oil date seed was 16.98%, according to sample #11.
3.5. Digestate
Table 11 shows the test result of the digestates produced from the cassava peel, date seed and extracted oil date seed which confirmed its content of the three main nutrients of conventional fertilisers (N, P and K) and its dry matter (DM). The presence of these elements in the resulting digestate enhances the possibility of its usage in different areas such as agriculture, whether in its liquid form or after it has been dried [64,65,66]. The same table shows different N:P:K ratios obtained from each substance. Extracting the oil from the date seed increased the N content and decreased the P and K contents in the digestate.
3.6. Biodiesel
The percentage of oil produced from the date seeds was approximately 16.0 wt.% of the date seed used in the extraction process. The percentage was determined from the mass of extracted oil divided by the mass of the powder date seed used. In other words, each gram of grounded date seed gave approximately 0.202 mL (0.16 g) of oil. This percentage is within the values obtained by Jamil et al. (2016) [44], but it is slightly less than the optimal value obtained, which was 16.5%. This may be due to the use of more reaction time (7 h) [44].
The resulting biodiesel accounted for approximately 79 wt.% of the date seed oil. The separating the biodiesel and glycerine was implemented by placing them in a separating funnel. The properties of the biodiesel produced from the extraction process are given in Table 12 [67,68,69]. The resulting biodiesel was yellowish in colour and had a hazy liquid look. The acid value was measured at 0.01 mg KOH/g, which is in range of the ASTM and EN standard value of maximum 0.5 mg KOH/g. This low acid value indicates that the produced biodiesel is suitable for use in engines. An increase in the acid value of the fuel leads to engine corrosion. Moreover, high acid values impact the low temperature properties of biodiesel due to the high melting points [70]. In addition, the high acid value indicates the inability of biodiesel to store and may cause tank corrosion [15]. The cetane number was calculated at 47.6 as shown in Table 12, which is lies in the range of the ASTM and EN standards. The importance of the cetane number refers to the quality of the fuel in terms of ignition. It depends on the composition of the biodiesel, so it directly affects the engine [71]. The cetane number depends on the chemical compound of the fuel, and it varies from one substance to another. It can affect the engines starting ability, noise level and exhaust emissions [43]. The sulphur content was 0.005% mass, which is a bit higher than the ASTM standard of 0.002% mass, but lower than the EN standard of 0.02% mass. Compared with fossil fuels, one of the most important advantages of biodiesel is its low emissions of sulphur compounds into the atmosphere [72].
The cloud point was measured to be 0 °C which is less than the ASTM standard of −2 to −12 °C, while the pour point of the biodiesel from the study was −2 °C compared to the ASTM standard of −15 to −16 °C. The values of the cloud and pour points as indicated are higher than the standards, which is a disadvantage for the resulting biodiesel. All biodiesels from various sources have high cloud and pour points [43]. The reason for that is because the fatty acids directly affect the cold flow properties of biodiesel. Increasing the carbon atoms in the carbon chain increases the freezing point of the biodiesel, while it decreases with the double bonds [73]. Based on the standard density values of biodiesel for the ASTM and EN standards at 880 kg/m3 and 860–900 kg/m3, respectively, the density of the biodiesel produced from the date seed oil was 890 kg/m3, which is within the ranges of the two standards. The density of biodiesel prevents it from breaking up in the engine upon combustion [74]. The mass of injected fuel increases with increasing fuel density. In addition, the injection timing and the injection spray pattern are directly affected by the density [75]. The penetration of fuel droplets will increase in the combustion chamber with the rise in density. As the density increases, it causes an increase in the fuel droplets diameter [76]. The importance of viscosity lies in its effect on injection in the engine and its spray atomisation after injection. Therefore, the viscosity of biodiesel is high, at 4.11 mm2/s. The viscosity value in the ASTM standard is 1.9–6 mm2/s and 3.5–5 mm2/s in EN standard [77,78]. Moreover, increasing the viscosity value of biodiesel leads to early injection that moves fuel ignition near the top dead centre, which causes an increase in the pressure and temperature in the combustion chamber [75,76].
The temperature at which biodiesel will ignite in contact with air is called the flash point [70]. A low flash point makes the fuel highly volatile, while high flash point leads to carbon deposits in the combustion chambers [71]. The flash point of biodiesel is an important consideration for safety measures in transportation and storage [44]. The flash point is related to the volatility, low volatility with high viscosity leads to misfire, delay in the ignition and poor cold engine starting up [79]. Therefore, the flash point must be at least 130 min according to ASTM D6751 standard or 101 min or more based on EN 14,214 standard [67]. As the flash point in this study was 147 min, it was within range. The biodiesel produced a boiling point of 439 °C which is in the range of the ASTM boiling point between 100–615 °C. The boiling point is related to the volatility of the fatty substances and thus is related to the flash point. Volatility decreases with increasing carbon chain, thus low volatility of flammable materials means higher flash points [80,81,82].
3.7. Glycerine
Glycerine was produced as a brownish and gelatinous at room temperature as a by-product from the biodiesel production process. The dark colour of the crude glycerine produced was due to it containing ash, water and other organic matter other than glycerine [83]. The amount of glycerine obtained was estimated at 9 wt.% of the date seed oil. This percentage is in line with the previous studies [46,47,48,49,50]. The physical properties of glycerine are shown in Table 13. The density of glycerine at 15 °C was 1.047 g/mL, with a flash point of 149.5 °C and a glycerine pH of 9.16 which is in the range of the crude glycerol mentioned in the previous studies [56,83]. The glycerine contained 38% water.
3.8. Optimisation and Energy Evaluation
Tow optimisation criteria were implemented in this study as shown in Table 14. The first criterion is the quality criterion that to maximise CH4 with no restrictions on the AD process factors. The second criterion is the cost criterion also to maximise CH4 with restrictions on the AD process factors to reduce the AD process cost. Table 14 shows the goals and importance set for each criterion. The responses were identified as follows; maximising the biogas/g-VS, CH4%, CH4/g-VS and minimising the CO2% for each criterion. The importance of the CH4% response was set to the highest value (5) for its obvious effect on energy balance calculations. The importance of the rest of responses was set to 3.
In addition, temperatures were minimised in the second criterion in order to reduce the energy costs used in biogas production process. The volatile solid has been set to maximum in order to take advantage of the largest quantity of date seed. The purpose of that is to contribute to the waste management process, waste disposal without dumping it in the landfill and to reduce the food waste, which is the second highest source of waste [84]. Furthermore, applying the gate fees can be used to enhance the AD process [85]. Gate fees are the costs that the provider pays to AD plants for disposing of waste. These costs are lower than the costs of other options of disposing wastes, which provide a profit for both parties [86]. The energy consumed in the grinding process was quite low and thus neglected. The average electric energy consumed by the water baths at the temperature of 34, 37, 40 °C were 51, 62 and 80 kWh, respectively.
Table 15 and Figure 43 and Figure 44 clarified the numerical and graphical optimal results based on the two criteria of date seed. The desired optimal solution by the software only considered in the energy balance calculations. It is clear from Table 15 that the quantity of biogas/g-VS produced by the quality criterion is more than double that of the cost criterion. In contrast, methane in the cost criterion was 73.4%, which is 18% higher than the quality criterion.
As shown in Table 16, the highest energy gain was based on the cost criterion (131.6%) while the energy gain based on the quality criteria was 11.3%. When comparing the two criteria, changing the temperature and sludge quantity goals to “minimise” and the volatile solid to “maximise” resulted in a dramatic rise in energy balance of almost 12 times higher.
Table 17 and Figure 45 and Figure 46 describe the numerical and graphical optimal results based on the two criteria of extracted oil date seed. The optimal solution with the highest desirability that determined by the software was selected in the energy balance calculations. It is clear from Table 17 that the quantity of biogas/g-VS produced by the quality criterion was more than double that of the cost criterion. In contrast, methane in the cost criterion was 71.2%, which was 14.5% higher than the quality criterion.
As shown in Table 18, the highest energy gains were based on the cost criterion at 121.5%, while an energy loss resulted based on the quality criteria at −27.1%. When comparing the criteria, changing the temperature to “minimise”, sludge quantity goals to “minimise” or “in range” and the volatile solid to “maximise” resulted in a dramatic rise in energy balance.
4. Conclusions
The exploitation of date seed in producing bioenergy contributes in increasing bioenergy dependence and thus reducing dependence on biofuels and properly managing waste. In addition to the accumulation of waste in general, fossil fuel emissions and food waste pose environmental and health threats. To obtain the highest quantity and quality biogas, it is necessary to set reaction temperature and sludge/substrate ratio at their optimal values. The energy balance results support AD plants in applying gate fees for accepting the wastes and increasing the contribution of the AD of cassava peels and date seeds with respect to waste management. The results of the digestate tests confirmed the content of the three basic nutrients of fertiliser. The presence of these elements is important if one was to use them in the agricultural field, as the quality of the organic fertilisers are evaluated based on the presence of these elements.
Date seeds increased the biogas yield by an order of five times. The methane percentage increased by 25.6%, reaching 71.1%, compared to 52.9% before adding the date seeds. Not exposing the date seed to the treatment processes before the grinding process increased the biogas yield. The highest energy gain obtained from date seed was at the optimal result of 3325.5 cc of Biogas, 830.5 cc/g-VS of cc/g-VS, 73.4% of CH4%, 13% CO2% and 598.8 cc/g-VS of CH4/g-VS at 36.2 °C, 4.2 g-VS and 101.6 mL of sludge. The highest energy gain from extracted oil date seed was 131.6% for the cost criterion, while the gain from the quality criterion was 11.3%. The addition of extracted oil date seeds to the sludge increased the yield of biogas and methane values. The amount of biogas increased dramatically from 800 cc before adding the date seeds to 3534 cc. The CH4% increased by approximately 26.5% when the extracted oil date seeds were added. The highest biogas volume at the optimum results of the second Criterion was 2818.7 cc, the Biogas/g-VS was 686.9, CH4% was 71.2%, CO2% was 17.5% CH4/g-VS was 473.7 cc/g-VS at 34 °C, 4.2 g-VS and approximately 128 mL of sludge. The energy gain at these values was 121.5%.
Comparing the results of the AD process of date seeds before and after oil extraction led to the following conclusions: The volume of biogas decreased by varying ratios. The difference was 14.4% at the highest biogas values of 4140 cc before extracting oil and 3543 after the extraction process. The highest difference was 22.7%, while the lowest difference was 6.3%. The largest difference in CH4% was 10.98%, while the lowest difference was 1.12%. The difference between the highest values was around 2.53%. In contrast, the percentage of CO2 emissions resulting from the AD of extracted oil date seeds increased to 15.6% compared to 13% before oil extraction. The difference in the amount of CH4/g-VS produced, ranged from 27% to 8.59%. At the highest CH4/g-VS values, the difference was about 17%, as it decreased from 1143.8 cc/g-VS to 949.6 cc/g-VS due to the oil extraction process.
Extracting the dates seed oil using the Soxhlet method at the following conditions: 70 °C, 1:4 ratio of date seeds to the solvent and 5 h of reaction time, resulted in approximately identical quantities to the optimal results of previous studies. The percentage of oil extracted from date seeds was approximately 16% of the mass of date seeds, as each gram of ground date seeds yielded approximately 0.220 mL of oil. The percentage of biodiesel produced was 79% of the oil produced, while the glycerine generated, was up about 9% of the oil volume. The test results of the biodiesel and glycerine samples were largely identical to the standards.
Author Contributions
The authors contributions are as follows. Conceptualisation, methodology, writing—original draft preparation, Software and data curation, A.M.A.; Resources, Software, formal analysis and data curation, R.A.; Software, writing—review and editing, validation, visualisation, formal analysis and investigation, K.Y.B.; project administration, validation, visualisation, supervision and writing—review and editing, J.S.; All authors have read and agreed to the published version of the manuscript.
Funding
This works was funded by Saudi Cultural Bureau in Dublin.
Institutional Review Board Statement
Not applicable.
Informed Consent Statement
Not applicable.
Data Availability Statement
Not applicable.
Acknowledgments
Grateful thanks to the Green Generation Plants, Kildare, Ireland for the provision of sludge during this study and a sincere thanks and appreciation to the Saudi Ministry of Education and the Saudi Cultural Bureau in the Republic of Ireland for their financial support.
Conflicts of Interest
The authors declare no conflict of interest.
Nomenclature
| AD | Anaerobic digestion |
| N | Nitrogen |
| P | Phosphorous |
| K | Potassium |
| DOE | Design of experiment |
| RSM | Response surface methodology |
| α | Significance level |
| VS | Volatile solid |
| TS | Total solid |
| MS | Moisture content |
| ANOVA | Analysis of variance |
| BBD | Box-Behnken design |
| Pred. R2 | Predicted R2 |
| Adj. R2 | Adjusted R2 |
| Adeq. Precision | Adequate Precision |
| Cor total | Total sum of the squares corrected for the mean |
| Df | Degree of freedom |
| Bs | The energy content of biogas produced by CP in [kW h/m3] |
| 9.67 | The energy content of 1 Nm3 (Normal cubic meter) of biogas |
| Ep | The energy gained from a gram of volatile solid of CP from the biogas produced in [Wh/g-VS] |
| Bp | The biogas volume produced from each gram of volatile solid of CP. |
| Ec | The energy consumed by the water bath to digest the gram volatile solid of CP in [Wh/g-VS]. |
| Ept | The electric energy consumed in the digestion process, which was measured by a prodigit kilowatt-hour meter. |
| VSm | The total amount of volatile solid in the water bath |
| Net Ep | The net energy produced by a gram of volatile solid of treated CP in [Wh/g-VS] |
References
- AbdElgawad, H.; Saleh, A.M.; Al Jaouni, S.; Selim, S.; Hassan, M.O.; Wadaan, M.A.; Shuikan, A.M.; Mohamed, H.S.; Hozzein, W.N. Utilisation of actinobacteria to enhance the production and quality of date palm (Phoenix dactylifera L.) fruits in a semi-arid environment. Sci. Total Environ. 2019, 665, 690–697. [Google Scholar] [CrossRef]
- Nasiri, A.; Taheri-Garavand, A.; Zhang, Y.D. Image-based deep learning automated sorting of date fruit. Postharvest Biol. Technol. 2019, 153, 133–141. [Google Scholar] [CrossRef]
- Al-MSSalleM, M.Q. The Role of Date Palm Fruit in Improving Human Health. J. Clin. Diagn. Res. 2020, 14, 1–6. [Google Scholar] [CrossRef]
- Hossain, M.S.; Muhammad, G.; Amin, S.U. Improving consumer satisfaction in smart cities using edge computing and caching: A case study of date fruits classification. Future Gener. Comput. Syst. 2018, 88, 333–341. [Google Scholar] [CrossRef]
- Ghnimi, S.; Umer, S.; Karim, A.; Kamal-Eldin, A. Date fruit (Phoenix dactylifera L.): An underutilised food seeking industrial valorisation. NFS J. 2017, 6, 1–10. [Google Scholar] [CrossRef] [Green Version]
- Lockwood, R. Dates: Production, Processing, Food, and Medicinal Values (Medicinal and Aromatic Plants–Industrial Profiles); Manickavasagan, A., Essa, M.M., Sukumar, E., Eds.; CRC Press: Boca Raton, FL, USA, 2012; p. 153. [Google Scholar]
- Abdulsada, S.A.; Al-Mosawi, A.I.; Hashim, A.A. Date Waste as Environmentally Friendly Composites. J. Mater. Metall. Eng. 2018, 8, 25–30. [Google Scholar]
- Najafi, M.B. Date seeds: A novel and inexpensive source of dietary fiber. Int. Conf. Food Eng. Biotechnol. IPCBEF 2011, 9, 323–326. [Google Scholar]
- Mirghani, M.E. Processing of date palm kernel (DPK) for production of nutritious drink. Adv. Nat. Appl. Sci. 2012, 6, 575–582. [Google Scholar]
- Alsewailem, F.D.; Binkhder, Y.A. Preparation and characterisation of polymer/date pits composites. J. Reinf. Plast. Compos. 2010, 29, 1743–1749. [Google Scholar] [CrossRef]
- Mrabet, A.; Jiménez-Araujo, A.; Guillén-Bejarano, R.; Rodríguez-Arcos, R.; Sindic, M. Date seeds: A promising source of oil with functional properties. Foods 2020, 9, 787. [Google Scholar] [CrossRef] [PubMed]
- Ali, M.A.; Al-Hattab, T.A.; Al-Hydary, I.A. Extraction of date palm seed oil (Phoenix dactylifera) by Soxhlet apparatus. Int. J. Adv. Eng. Technol. 2015, 8, 261. [Google Scholar]
- Elnajjar, E.; Hasan, S.; Alnaqbi, A.H.; Al Omari, S.A.; Al-Zuhair, S. Optimising the Extraction of Oils from Date Seeds for Biodiesel Production. Int. J. Environ. Res. 2018, 12, 101–108. [Google Scholar] [CrossRef]
- Azeem, M.W.; Hanif, M.A.; Al-Sabahi, J.N.; Khan, A.A.; Naz, S.; Ijaz, A. Production of biodiesel from low priced, renewable and abundant date seed oil. Renew. Energy 2016, 86, 124–132. [Google Scholar] [CrossRef]
- Ala’a, H.; Jamil, F.; Al-Haj, L.; Myint, M.T.; Mahmoud, E.; Ahmad, M.N.; Hasan, A.O.; Rafiq, S. Biodiesel production over a catalyst prepared from biomass-derived waste date pits. Biotechnol. Rep. 2018, 20, e00284. [Google Scholar]
- Al-Farsi, M.A.; Lee, C.Y. Usage of Date (Phoenix dactylifera L.) Seeds in Human Health and Animal Feed, Nuts and Seeds in Health and Disease Prevention; Elsevier: Amsterdam, The Netherlands, 2011; pp. 447–452. [Google Scholar]
- Radeef, W.; Shanableh, A.; Merabtene, T. Biogas production through co-digestion of date palm seeds and wastewater treatment sludge. In Proceedings of the 2015 International Conference on Water, Energy, and the Environment, Sharjah, United Arab Emirates, 24–26 March 2015. [Google Scholar]
- Gupta, N.; Kushwaha, H. Date Palm as a Source of Bioethanol Producing Microorganisms. Date Palm Biotechnology; Springer: Berlin/Heidelberg, Germany, 2011; pp. 711–727. [Google Scholar]
- Hussain, A.; Farooq, A.; Bassyouni, M.I.; Sait, H.H.; El-Wafa, M.A.; Hasan, S.W.; Ani, F.N. Pyrolysis of Saudi Arabian date palm waste: A viable option for converting waste into wealth. Life Sci. J. 2014, 12, 667–671. [Google Scholar]
- Kriker, A.; Debicki, G.; Bali, A.; Khenfer, M.M.; Chabannet, M. Mechanical properties of date palm fibres and concrete reinforced with date palm fibres in hot-dry climate. Cem. Concr. Compos. 2005, 27, 554–564. [Google Scholar] [CrossRef]
- Augustia, V.; Chafidz, A.; Chafidz, A.; Setyaningsih, L.; Rizal, M.; Kaavessina, M.; Al Zahrani, S.M. Effect of Date Palm Fiber Loadings on the Mechanical Properties of High Density Polyethylene/Date Palm Fiber Composites. Key Eng. Mater. 2018, 773, 94–99. [Google Scholar] [CrossRef]
- Besbes, S.; Drira, L.; Blecker, C.; Deroanne, C.; Attia, H. Adding value to hard date (Phoenix dactylifera L.): Compositional, functional and sensory characteristics of date jam. Food Chem. 2009, 112, 406–411. [Google Scholar] [CrossRef]
- FAOSTAT. Food and Agricultural Organisation of the United Nations. 2019. Available online: http://www.fao.org/faostat/en/#data/QCL (accessed on 4 June 2021).
- Lattieff, F.A. A study of biogas production from date palm fruit wastes. J. Clean. Prod. 2016, 139, 1191–1195. [Google Scholar] [CrossRef]
- Shafiei, M.; Karimi, K.; Taherzadeh, M.J. Palm date fibers: Analysis and enzymatic hydrolysis. Int. J. Mol. Sci. 2010, 11, 4285–4296. [Google Scholar] [CrossRef] [PubMed] [Green Version]
- Al-Khayri, J.M.; Jain, S.M.; Johnson, D.V. Date Palm Genetic Resources and Utilisation; Springer: Berlin/Heidelberg, Germany, 2015; Volume 1. [Google Scholar]
- Jaafar, K.A. Biogas production by anaerobic digestion of date palm pulp waste. Al-Khwarizmi Eng. J. 2010, 6, 14–20. [Google Scholar]
- Shanableh, A.; Radeef, W. Biogas production from raw and oil-spent date palm seeds mixed with wastewater treatment sludge. Biofuels 2017, 11, 1–8. [Google Scholar] [CrossRef]
- Chong, C.C.; Aqsha, A.; Ayoub, M.; Sajid, M.; Abdullah, A.Z.; Yusup, S.; Abdullah, B. A review over the role of catalysts for selective short-chain polyglycerol production from biodiesel derived waste glycerol. Environ. Technol. Innov. 2020, 19, 100859. [Google Scholar] [CrossRef]
- Pölczmann, G.; Tóth, O.; Beck, Á.; Hancsók, J. Investigation of storage stability of diesel fuels containing biodiesel produced from waste cooking oil. J. Clean. Prod. 2016, 111, 85–92. [Google Scholar] [CrossRef]
- Ramadhas, A.S.; Muraleedharan, C.; Jayaraj, S. Performance and emission evaluation of a diesel engine fueled with methyl esters of rubber seed oil. Renew. Energy 2005, 30, 1789–1800. [Google Scholar] [CrossRef]
- Kawentar, W.A.; Budiman, A. Synthesis of biodiesel from second-used cooking oil. Energy Procedia 2013, 32, 190–199. [Google Scholar] [CrossRef] [Green Version]
- Balasubramanian, D.; Kamaraj, S.; Krishnamoorthy, R. Synthesis of Biodiesel from Waste Cooking Oil by Alkali Doped Calcinated Waste Egg Shell Powder Catalyst and Optimisation of Process Parameters to Improve Biodiesel Conversion. SAE Technical Paper. Available online: https://www.sae.org/publications/technical-papers/content/2020-01-0341 (accessed on 21 June 2021).
- Mahmudul, H.M.; Hagos, F.Y.; Mamat, R.; Adam, A.A.; Ishak, W.F.; Alenezi, R. Production, characterisation and performance of biodiesel as an alternative fuel in diesel engines–A review. Renew. Sustain. Energy Rev. 2017, 72, 497–509. [Google Scholar] [CrossRef]
- Chuah, L.F.; Klemeš, J.J.; Yusup, S.; Bokhari, A.; Akbar, M.M. A review of cleaner intensification technologies in biodiesel production. J. Clean. Prod. 2017, 146, 181–193. [Google Scholar] [CrossRef]
- Atabani, A.E.; Silitonga, A.S.; Badruddin, I.A.; Mahlia, T.M.; Masjuki, H.H.; Mekhilef, S. A comprehensive review on biodiesel as an alternative energy resource and its characteristics. Renew. Sustain. Energy Rev. 2012, 16, 2070–2093. [Google Scholar] [CrossRef]
- Alaswad, A.; Dassisti, M.; Prescott, T.; Olabi, A.G. Technologies and developments of third generation biofuel production. Renew. Sustain. Energy Rev. 2015, 51, 1446–1460. [Google Scholar] [CrossRef]
- Borugadda, V.B.; Goud, V.V. Improved thermo-oxidative stability of structurally modified waste cooking oil methyl esters for bio-lubricant application. J. Clean. Prod. 2016, 112, 4515–4524. [Google Scholar] [CrossRef]
- Ghayal, D.; Pandit, A.B.; Rathod, V.K. Optimisation of biodiesel production in a hydrodynamic cavitation reactor using used frying oil. Ultrason. Sonochem. 2013, 20, 322–328. [Google Scholar] [CrossRef]
- Chuah, L.F.; Yusup, S.; AzizAbdul, R.A.; Klemeš, J.J.; Bokhari, A.; Abdullah, M.Z. Influence of fatty acids content in non-edible oil for biodiesel properties. Clean Technol. Environ. Policy 2016, 18, 473–482. [Google Scholar] [CrossRef]
- Lin, L.; Cunshan, Z.; Vittayapadung, S.; Xiangqian, S.; Mingdong, D. Opportunities and challenges for biodiesel fuel. Appl. Energy 2011, 88, 1020–1031. [Google Scholar] [CrossRef]
- Muanruksa, P.; Kaewkannetra, P. Combination of fatty acids extraction and enzymatic esterification for biodiesel production using sludge palm oil as a low-cost substrate. Renew. Energy 2020, 146, 901–906. [Google Scholar] [CrossRef]
- Amani, M.A.; Davoudi, M.S.; Tahvildari, K.; Nabavi, S.M.; Davoudi, M.S. Biodiesel production from Phoenix dactylifera as a new feedstock. Ind. Crop. Prod. 2013, 43, 40–43. [Google Scholar] [CrossRef]
- Jamil, F.; Ala’a, H.; Al-Haj, L.; Al-Hinai, M.A.; Hellier, P.; Rashid, U. Optimisation of oil extraction from waste “Date pits” for biodiesel production. Energy Convers. Manag. 2016, 117, 264–272. [Google Scholar] [CrossRef]
- Lu, J.; Liu, Z.; Zhang, Y.; Li, B.; Lu, Q.; Ma, Y.; Shen, R.; Zhu, Z. Improved production and quality of biocrude oil from low-lipid high-ash macroalgae Enteromorpha prolifera via addition of crude glycerol. J. Clean. Prod. 2017, 142, 749–757. [Google Scholar] [CrossRef]
- Duncan, J. Costs of Biodiesel Production; Energy Efficiency and Conservation Authority: New Zealand, 2003. Available online: http://www.globalbioenergy.org/uploads/media/0305_Duncan_-_Cost-of-biodiesel-production.pdf. (accessed on 18 June 2021).
- Hájek, M.; Skopal, F. Treatment of glycerol phase formed by biodiesel production. Bioresour. Technol. 2010, 101, 3242–3245. [Google Scholar] [CrossRef] [PubMed] [Green Version]
- Baabad, M.; Ismail, M. Biodiesel production using potassium based heterogeneous catalyst on γ-alumina support. In Proceedings of the 15th Regional Symposium on Chemical Engineering (RSCE) in Conjunction with the 22nd Symposium of Malaysian Chemical Engineers (SOMChe), Kuala Lumpur, Malaysia, 2–3 December 2008; pp. 911–916. [Google Scholar]
- Thompson, J.C.; He, B.B. Characterisation of crude glycerol from biodiesel production from multiple feedstocks. Appl. Eng. Agric. 2006, 22, 261–265. [Google Scholar] [CrossRef]
- Isahak, W.N.R.W.; Ismail, M.; Yarmo, M.A.; Jahim, J.M.; Salimon, J. Crude glycerol purification and treatment for bio-lubricant preparation. In Proceedings of the Proceedings on Chemical Engineering (RSCE), Manila, Philippines, 1–2 December 2009. [Google Scholar]
- Hammond, G.P.; Li, B. Environmental and resource burdens associated with world biofuel production out to 2050: Footprint components from carbon emissions and land use to waste arisings and water consumption. GCB Bioenergy 2016, 8, 894–908. [Google Scholar] [CrossRef] [Green Version]
- Guerrero-Urbaneja, P.; García-Sancho, C.; Moreno-Tost, R.; Mérida-Robles, J.; Santamaría-González, J.; Jiménez-López, A.; Maireles-Torres, P. Glycerol valorization by etherification to polyglycerols by using metal oxides derived from MgFe hydrotalcites. Appl. Catal. Gen. 2014, 470, 199–207. [Google Scholar] [CrossRef]
- Siew, K.W.; Lee, H.C.; Gimbun, J.; Chin, S.Y.; Khan, M.R.; Taufiq-Yap, Y.H.; Cheng, C.K. Syngas production from glycerol-dry (CO2) reforming over La-promoted Ni/Al2O3 catalyst. Renew. Energy 2015, 74, 441–447. [Google Scholar] [CrossRef] [Green Version]
- Jamil, F.; Saxena, S.K.; Ala’a, H.; Baawain, M.; Al-Abri, M.; Viswanadham, N.; Kumar, G.; Abu-Jrai, A.M. Valorisation of waste “date seeds” bio-glycerol for synthesising oxidative green fuel additive. J. Clean. Prod. 2017, 165, 1090–1096. [Google Scholar] [CrossRef]
- Zhang, M.; Wu, H. Effect of major impurities in crude glycerol on solubility and properties of glycerol/methanol/bio-oil blends. Fuel 2015, 159, 118–127. [Google Scholar] [CrossRef]
- Wan Isahak, W.N.R.; Che Ramli, Z.A.; Ismail, M.; Mohd Jahim, J.; Yarmo, M.A. Recovery and purification of crude glycerol from vegetable oil transesterification. Sep. Purif. Rev. 2015, 44, 250–267. [Google Scholar] [CrossRef]
- American Oil Chemist’ Society. Official Methods and Recommended Practices of the American Oil Chemists’ Society, 4th ed.; Gunstone, F., Ed.; AOCS Press: Champaign, IL, USA, 1993. [Google Scholar]
- Montingelli, M.E.; Benyounis, K.Y.; Quilty, B.; Stokes, J.; Olabi, A.G. Influence of mechanical pre-treatment and organic concentration of Irish brown seaweed for methane production. Energy 2017, 118, 1079–1089. [Google Scholar] [CrossRef] [Green Version]
- Montingelli, M.; Benyounis, K.Y.; Stokes, J.; Olabi, A. Pretreatment of macroalgal biomass for biogas production. Energy Convers. Manag. 2016, 108, 8. [Google Scholar] [CrossRef]
- Igoni, A.H.; Abowei, M.F.N.; Ayotamuno, M.J.; Eze, C.L. Effect of total solids concentration of municipal solid waste on the biogas produced in an anaerobic continuous digester. Agric. Eng. Int. CIGR J. 2008, X, 1–11. [Google Scholar]
- Deublein, D.; Steinhauser, A. Biogas from Waste and Renewable Resources: An Introduction; John Wiley & Sons: Hoboken, NJ, USA, 2011. [Google Scholar]
- Srisowmeya, G.; Chakravarthy, M.; Devi, G.N. Critical considerations in two-stage anaerobic digestion of food waste–A review. Renew. Sustain. Energy Rev. 2019, 119, 109587. [Google Scholar] [CrossRef]
- Hobbs, S.R.; Landis, A.E.; Rittmann, B.E.; Young, M.N.; Parameswaran, P. Enhancing anaerobic digestion of food waste through biochemical methane potential assays at different substrate: Inoculum ratios. Waste Manag. 2018, 71, 612–617. [Google Scholar] [CrossRef] [Green Version]
- Dahlin, J.; Herbes, C.; Nelles, M. Biogas digestate marketing: Qualitative insights into the supply side. Resour. Conserv. Recycl. 2015, 104, 152–161. [Google Scholar] [CrossRef]
- Alrefai, A.M.; Alrefai, R.; Benyounis, K.Y.; Stokes, J. The Environmental Challenges Associated With the Anaerobic Digestion Process when Applied Extensively. Encycl. Renew. Sustain. Mater. 2019, 1, 279–286. [Google Scholar]
- Alrefai, R.; Alrefai, A.M.; Benyounis, K.Y.; Stokes, J. The Production of Biogas, Biodiesel as High-Value Bio-Based Product and Multiple Bio-Products through an Integration Approach of the Anaerobic Digestion and Fermentation Processes. Encycl. Renew. Sustain. Mater. 2019, 1, 686–694. [Google Scholar]
- Sakthivel, R.; Ramesh, K.; Purnachandran, R.; Shameer, P.M. A review on the properties, performance and emission aspects of the third generation biodiesels. Renew. Sustain. Energy Rev. 2018, 82, 2970–2992. [Google Scholar] [CrossRef]
- ASTM D6751-20a. Standard Specification for Biodiesel Fuel Blend Stock (B100) for Middle Distillate Fuels; ASTM International West Conshohocken: Conshohocken, PA, USA, 2020. [Google Scholar]
- European Standard EN 14214. Automotive Fuels. Fatty Acid Methylesters (FAME) for Diesel Engines, Requirements Test Methods; BSI: London, UK, 2008. [Google Scholar]
- Knothe, G.; Dunn, R.O.; Bagby, M.O. Biodiesel: The Use of Vegetable Oils and Their Derivatives as Alternative Diesel Fuels; ACS Publications; American Chemical Society: Washington, DC, USA, 1997. [Google Scholar]
- Rashid, U.; Anwar, F.; Knothe, G. Biodiesel from Milo (Thespesia populnea L.) seed oil. Biomass Bioenergy 2011, 35, 4034–4039. [Google Scholar] [CrossRef]
- de Oliveira Filho, W.P.; Borges, D.L.; Saint’Pierre, T.D.; Dupim, M.; Vale, F.; Marques, B.; Medeiros, F.R. Assessment of the equivalence and correlation between total sulfur determination methods in biodiesel: An use of isotope dilution inductively coupled plasma mass spectrometry. Fuel 2017, 202, 227–232. [Google Scholar] [CrossRef]
- Canakci, M.; Sanli, H. Biodiesel production from various feedstocks and their effects on the fuel properties. J. Ind. Microbiol. Biotechnol. 2008, 35, 431–441. [Google Scholar] [CrossRef]
- Ahmad, J.; Yusup, S.; Bokhari, A.; Kamil, R.N.M. Study of fuel properties of rubber seed oil based biodiesel. Energy Convers. Manag. 2014, 78, 266–275. [Google Scholar] [CrossRef]
- Lee, S.W.; Tanaka, D.; Kusaka, J.; Daisho, Y. Effects of diesel fuel characteristics on spray and combustion in a diesel engine. JSAE Rev. 2002, 23, 407–414. [Google Scholar] [CrossRef]
- Choi, C.Y.; Reitz, R.D. A numerical analysis of the emissions characteristics of biodiesel blended fuels. J. Eng. Gas. Turbines Power 1999, 121, 31–37. [Google Scholar] [CrossRef]
- Saidur, R.; BoroumandJazi, G.; Mekhilef, S.; Mohammed, H.A. A review on exergy analysis of biomass based fuels. Renew. Sustain. Energy Rev. 2012, 16, 1217–1222. [Google Scholar] [CrossRef]
- Saxena, R.C.; Adhikari, D.K.; Goyal, H.B. Biomass-based energy fuel through biochemical routes: A review. Renew. Sustain. Energy Rev. 2009, 13, 167–178. [Google Scholar] [CrossRef]
- Szybist, J.P.; Song, J.; Alam, M.; Boehman, A.L. Biodiesel combustion, emissions and emission control. Fuel Process. Technol. 2007, 88, 679–691. [Google Scholar] [CrossRef]
- Catoire, L.; Paulmier, S.; Naudet, V. Estimation of closed cup flash points of combustible solvent blends. J. Phys. Chem. Ref. Data 2006, 35, 9–14. [Google Scholar] [CrossRef]
- Catoire, L.; Paulmier, S.; Naudet, V. Experimental determination and estimation of closed cup flash points of mixtures of flammable solvents. Process. Saf. Prog. 2006, 25, 33–39. [Google Scholar] [CrossRef]
- do Nascimento, D.C.; Carareto, N.D.D.; Neto, A.M.B.; Gerbaud, V.; da Costa, M.C. Flash point prediction with UNIFAC type models of ethylic biodiesel and binary/ternary mixtures of FAEEs. Fuel 2020, 281, 118717. [Google Scholar]
- Saifuddin, N.; Refal, H.; Kumaran, P. Rapid purification of glycerol by-product from biodiesel production through combined process of microwave assisted acidification and adsorption via chitosan immobilised with yeast. Res. J. Appl. Sci. Eng. Technol. 2014, 7, 593–602. [Google Scholar] [CrossRef]
- Gowe, C. Review on potential use of fruit and vegetables by-products as a valuable source of natural food additives. Food Sci. Qual. Manag. 2015, 45, 47–61. [Google Scholar]
- Scotland, Zero Waste. Digestate Market Development in Scotland; Mouat, A., Barclay, A., Mistry, P., Webb, J., Eds.; Zero Waste Scotland: Stirling, UK, 2010. [Google Scholar]
- Braun, R.; Wellinger, A. Potential of Co-Digestion; International Energy Agency (IEA): Paris, France, 2003. [Google Scholar]
Figure 1.
Normal probability and predicted versus actual residuals plot of Biogas produced from date seed.
Figure 1.
Normal probability and predicted versus actual residuals plot of Biogas produced from date seed.

Figure 2.
Normal probability and predicted vs. actual residuals plot of biogas/g-VS produced from extracted oil date seed.
Figure 2.
Normal probability and predicted vs. actual residuals plot of biogas/g-VS produced from extracted oil date seed.

Figure 3.
Biogas yield from sludge only and after adding date seed.

Figure 4.
CH4% variance when adding date seed to the sludge.

Figure 5.
The changing in methane quantity following to add date seed to the sludge.

Figure 6.
Perturbation plot shows the effect of all factors on Biogas volume.

Figure 7.
Contour plot views the effect of Temperature and Volatile solid on Biogas volume at sludge quantity of 37.5%.
Figure 7.
Contour plot views the effect of Temperature and Volatile solid on Biogas volume at sludge quantity of 37.5%.

Figure 8.
Perturbation plot illustrates the effect of all factors on Biogas/g-VS.

Figure 9.
Interaction plot clarifies the effect of interaction between volatile solid and sludge quantity on Biogas/g-VS.
Figure 9.
Interaction plot clarifies the effect of interaction between volatile solid and sludge quantity on Biogas/g-VS.

Figure 10.
3-D surface plot displays the effect of volatile solid and sludge quantity on Biogas/g-VS at 37 °C.
Figure 10.
3-D surface plot displays the effect of volatile solid and sludge quantity on Biogas/g-VS at 37 °C.

Figure 11.
Perturbation plot clarifies the effect of all factors on CH4%.

Figure 12.
Interaction plot illustrates the effect of interaction between temperature and volatile solid on CH4%.
Figure 12.
Interaction plot illustrates the effect of interaction between temperature and volatile solid on CH4%.

Figure 13.
Interaction plot illustrates the effect of interaction between volatile solid and sludge quantity on CH4%.
Figure 13.
Interaction plot illustrates the effect of interaction between volatile solid and sludge quantity on CH4%.

Figure 14.
Perturbation plot shows the effect of all factors on CO2%.

Figure 15.
Interaction plot illustrates the effect of interaction between temperature and volatile solid on CO2%.
Figure 15.
Interaction plot illustrates the effect of interaction between temperature and volatile solid on CO2%.

Figure 16.
3-D surface plot presents the effect of temperature and volatile solid on CO2% at sludge quantity of 37.5%.
Figure 16.
3-D surface plot presents the effect of temperature and volatile solid on CO2% at sludge quantity of 37.5%.

Figure 17.
Perturbation plot presents the effect of all factors on CH4/g-VS.

Figure 18.
Interaction plot shows the effect of interaction between volatile solid and sludge quantity on CH4/g-VS.
Figure 18.
Interaction plot shows the effect of interaction between volatile solid and sludge quantity on CH4/g-VS.

Figure 19.
The considerable increase in biogas yield by adding extracted oil date seed.

Figure 20.
Different CH4% after adding date seed.

Figure 21.
The effect of adding extracted oil date seed on methane volume.

Figure 22.
Perturbation plot views the effect of all factors on the biogas volume.

Figure 23.
3-D surface Plot shows the effect of Temperature and Volatile solid on the Biogas yield at sludge quantity of 50%.
Figure 23.
3-D surface Plot shows the effect of Temperature and Volatile solid on the Biogas yield at sludge quantity of 50%.

Figure 24.
Perturbation plot illustrates the effect of all factors on the biogas/g-VS.

Figure 25.
Interaction Plot clarifies the effect of interaction between volatile solid and sludge quantity on biogas/g-VS.
Figure 25.
Interaction Plot clarifies the effect of interaction between volatile solid and sludge quantity on biogas/g-VS.

Figure 26.
Contour Plot displays the effect of volatile solid and sludge quantity on the Biogas/g-VS at 37 °C.
Figure 26.
Contour Plot displays the effect of volatile solid and sludge quantity on the Biogas/g-VS at 37 °C.

Figure 27.
Perturbation plot clarifies the effect of all factors on CH4%.

Figure 28.
Interaction Plot shows the effect of interaction between temperature and volatile solid.

Figure 29.
Interaction Plot views the effect of interaction between temperature and sludge quantity on CH4 percentage.
Figure 29.
Interaction Plot views the effect of interaction between temperature and sludge quantity on CH4 percentage.

Figure 30.
Interaction Plot illustrates the effect of interaction between volatile solid and sludge quantity on CH4 percentage.
Figure 30.
Interaction Plot illustrates the effect of interaction between volatile solid and sludge quantity on CH4 percentage.

Figure 31.
3-D surface Plot shows the effect of volatile solid and sludge quantity on the CH4% at 37 °C.
Figure 31.
3-D surface Plot shows the effect of volatile solid and sludge quantity on the CH4% at 37 °C.

Figure 32.
Perturbation plot shows the effect of all factors on CO2%.

Figure 33.
Interaction Plot views the effect of interaction between temperature and volatile solid on CO2%.
Figure 33.
Interaction Plot views the effect of interaction between temperature and volatile solid on CO2%.

Figure 34.
Contour Plot presents the effect of temperature and volatile solid on CO2% at sludge quantity of 37.5%.
Figure 34.
Contour Plot presents the effect of temperature and volatile solid on CO2% at sludge quantity of 37.5%.

Figure 35.
Perturbation plot presents the effect of all factors on CH4/g-VS.

Figure 36.
Interaction Plot illustrates the effect of interaction between volatile solid and sludge quantity on CH4/g-VS.
Figure 36.
Interaction Plot illustrates the effect of interaction between volatile solid and sludge quantity on CH4/g-VS.

Figure 37.
3-D surface Plot illustrates the effect of volatile solid and sludge quantity on CH4/g-VS% at 37 °C.
Figure 37.
3-D surface Plot illustrates the effect of volatile solid and sludge quantity on CH4/g-VS% at 37 °C.

Figure 38.
The difference in the biogas volume produced before and after oil extraction from the date seeds.
Figure 38.
The difference in the biogas volume produced before and after oil extraction from the date seeds.

Figure 39.
The variation in the Biogas/g-VS quantity of date seed and extracted oil date seed.

Figure 40.
CH4% of date seed and extracted oil date seed.

Figure 41.
The alteration in CO2% between date seed and extracted oil date seed.

Figure 42.
CH4/g-VS yields before and after date seed oil extraction.

Figure 43.
Overlay plot based on the first criterion for date seed.

Figure 44.
Overlay plot based on the second criterion for date seed.

Figure 45.
The first criterion overlay figure for extracted oil date seed.

Figure 46.
The second criterion overlay figure for extracted oil date seed.


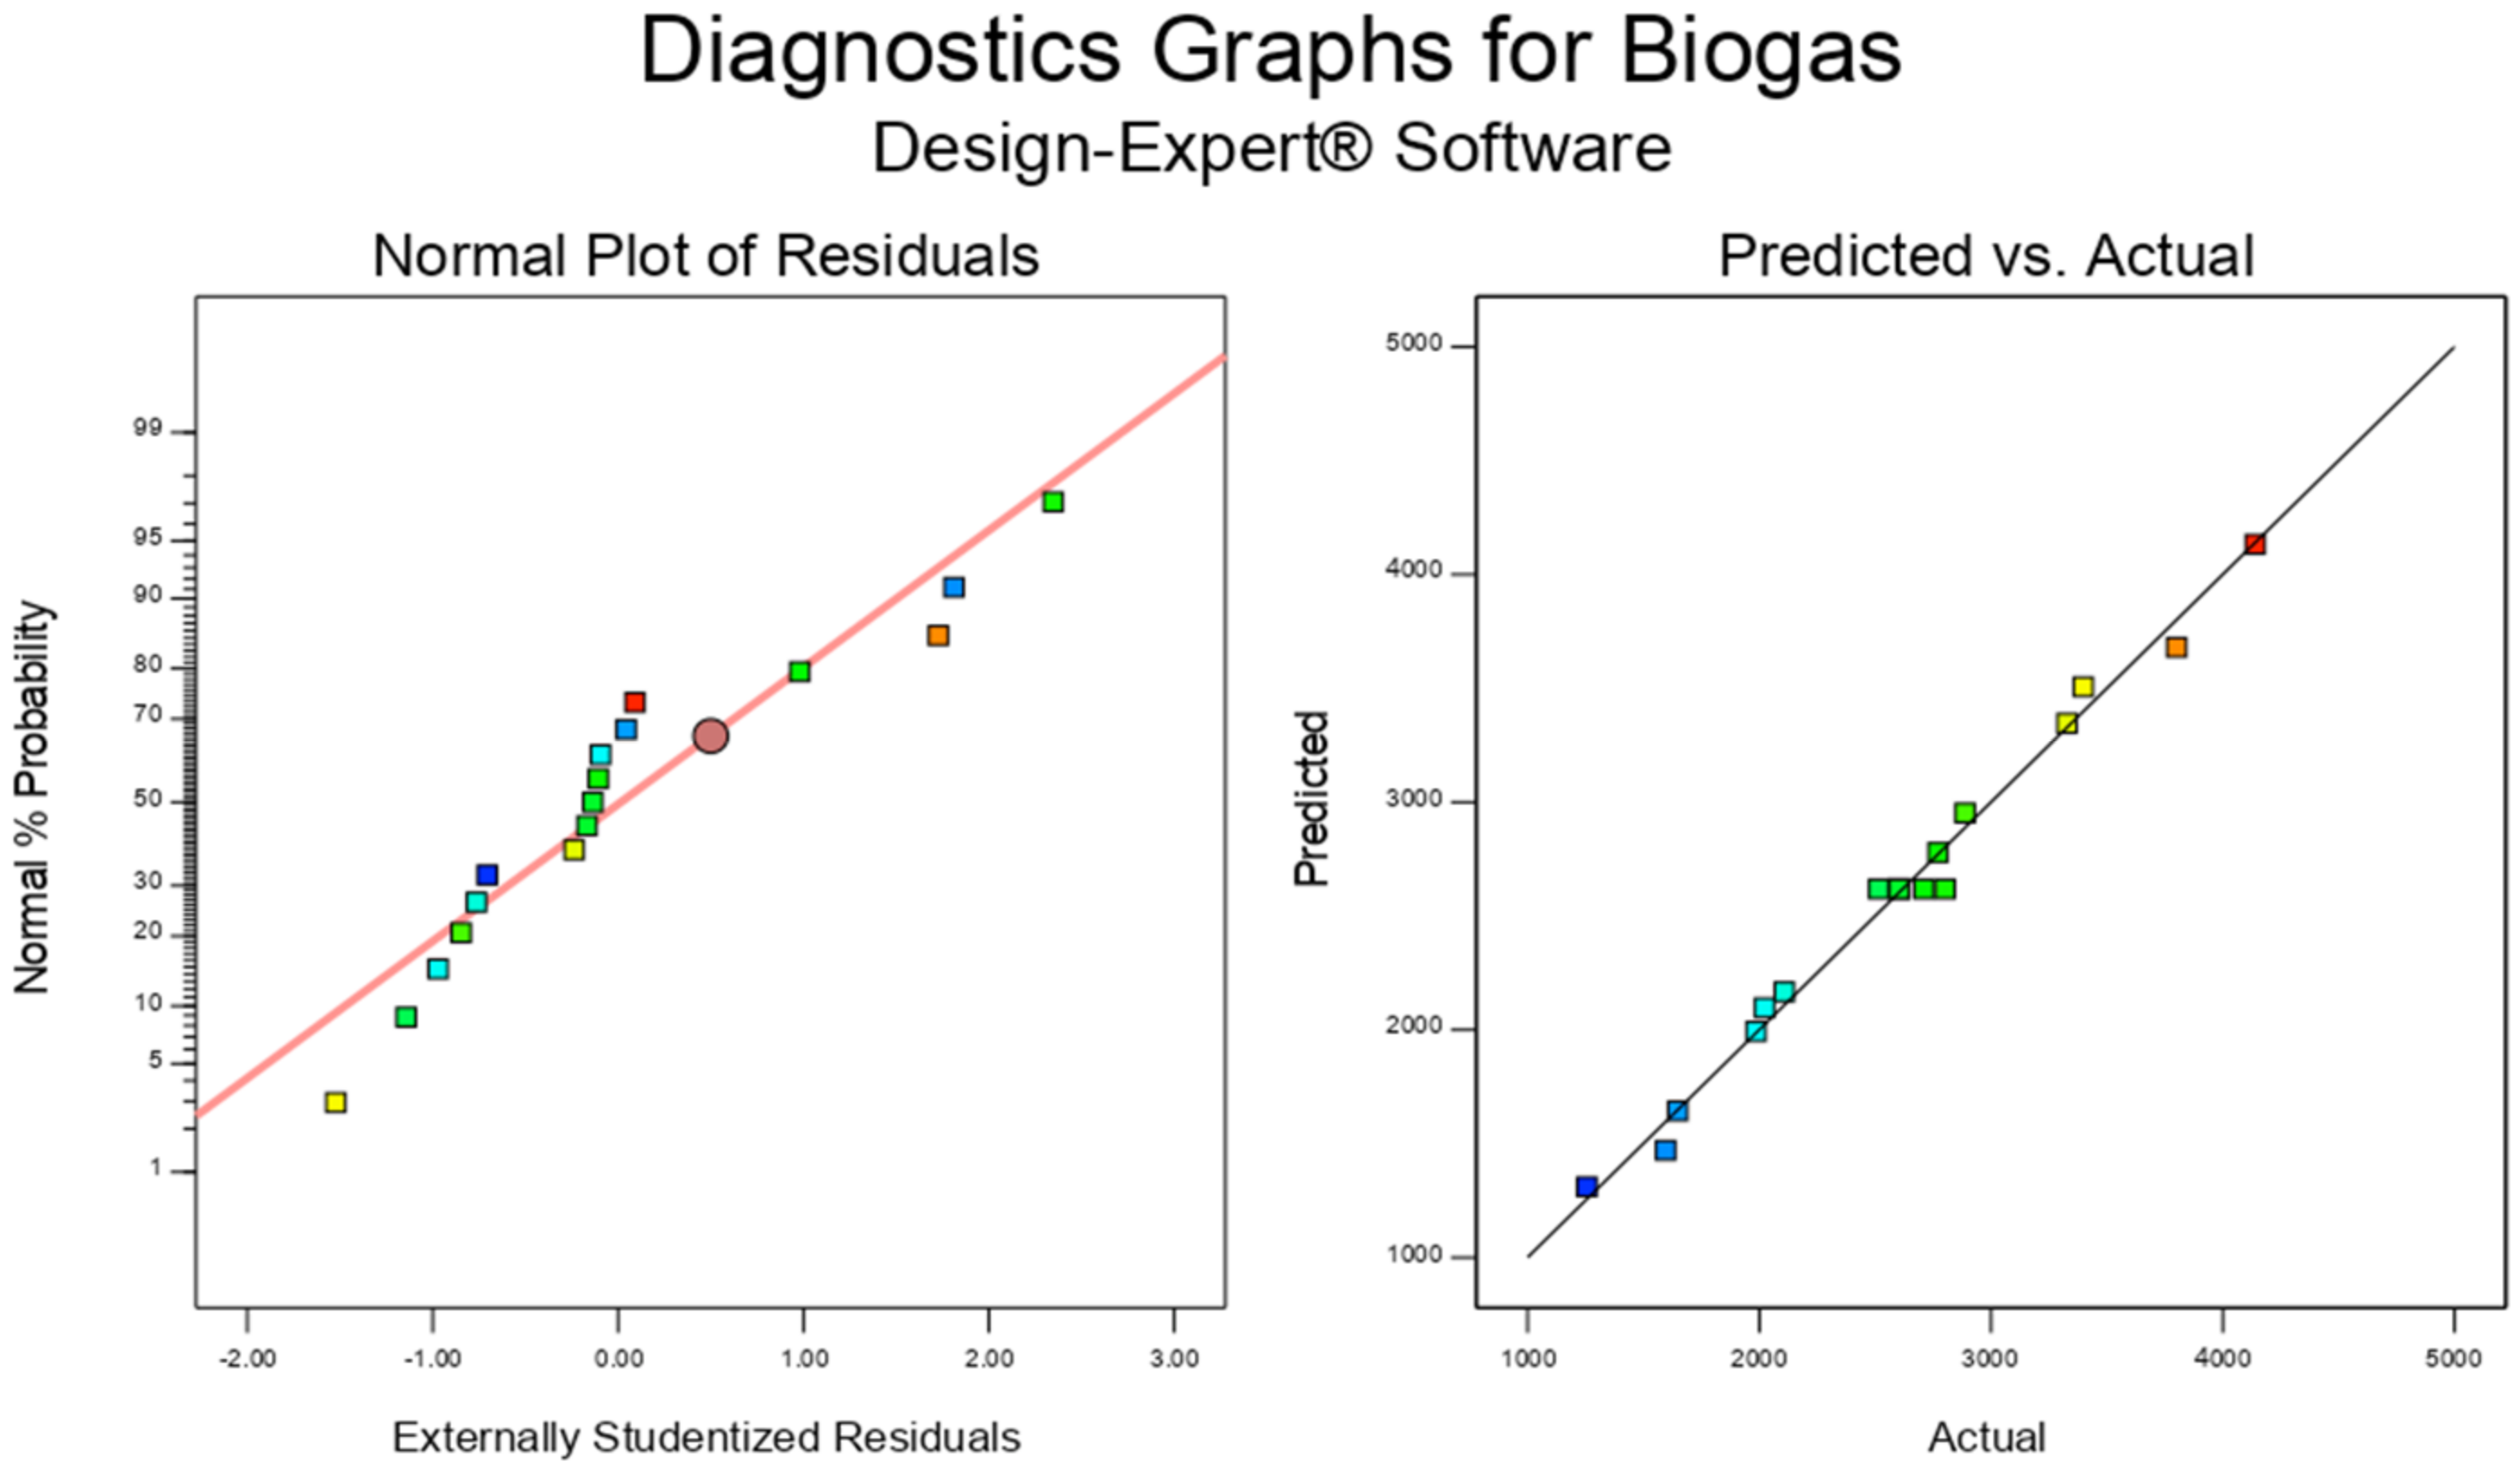
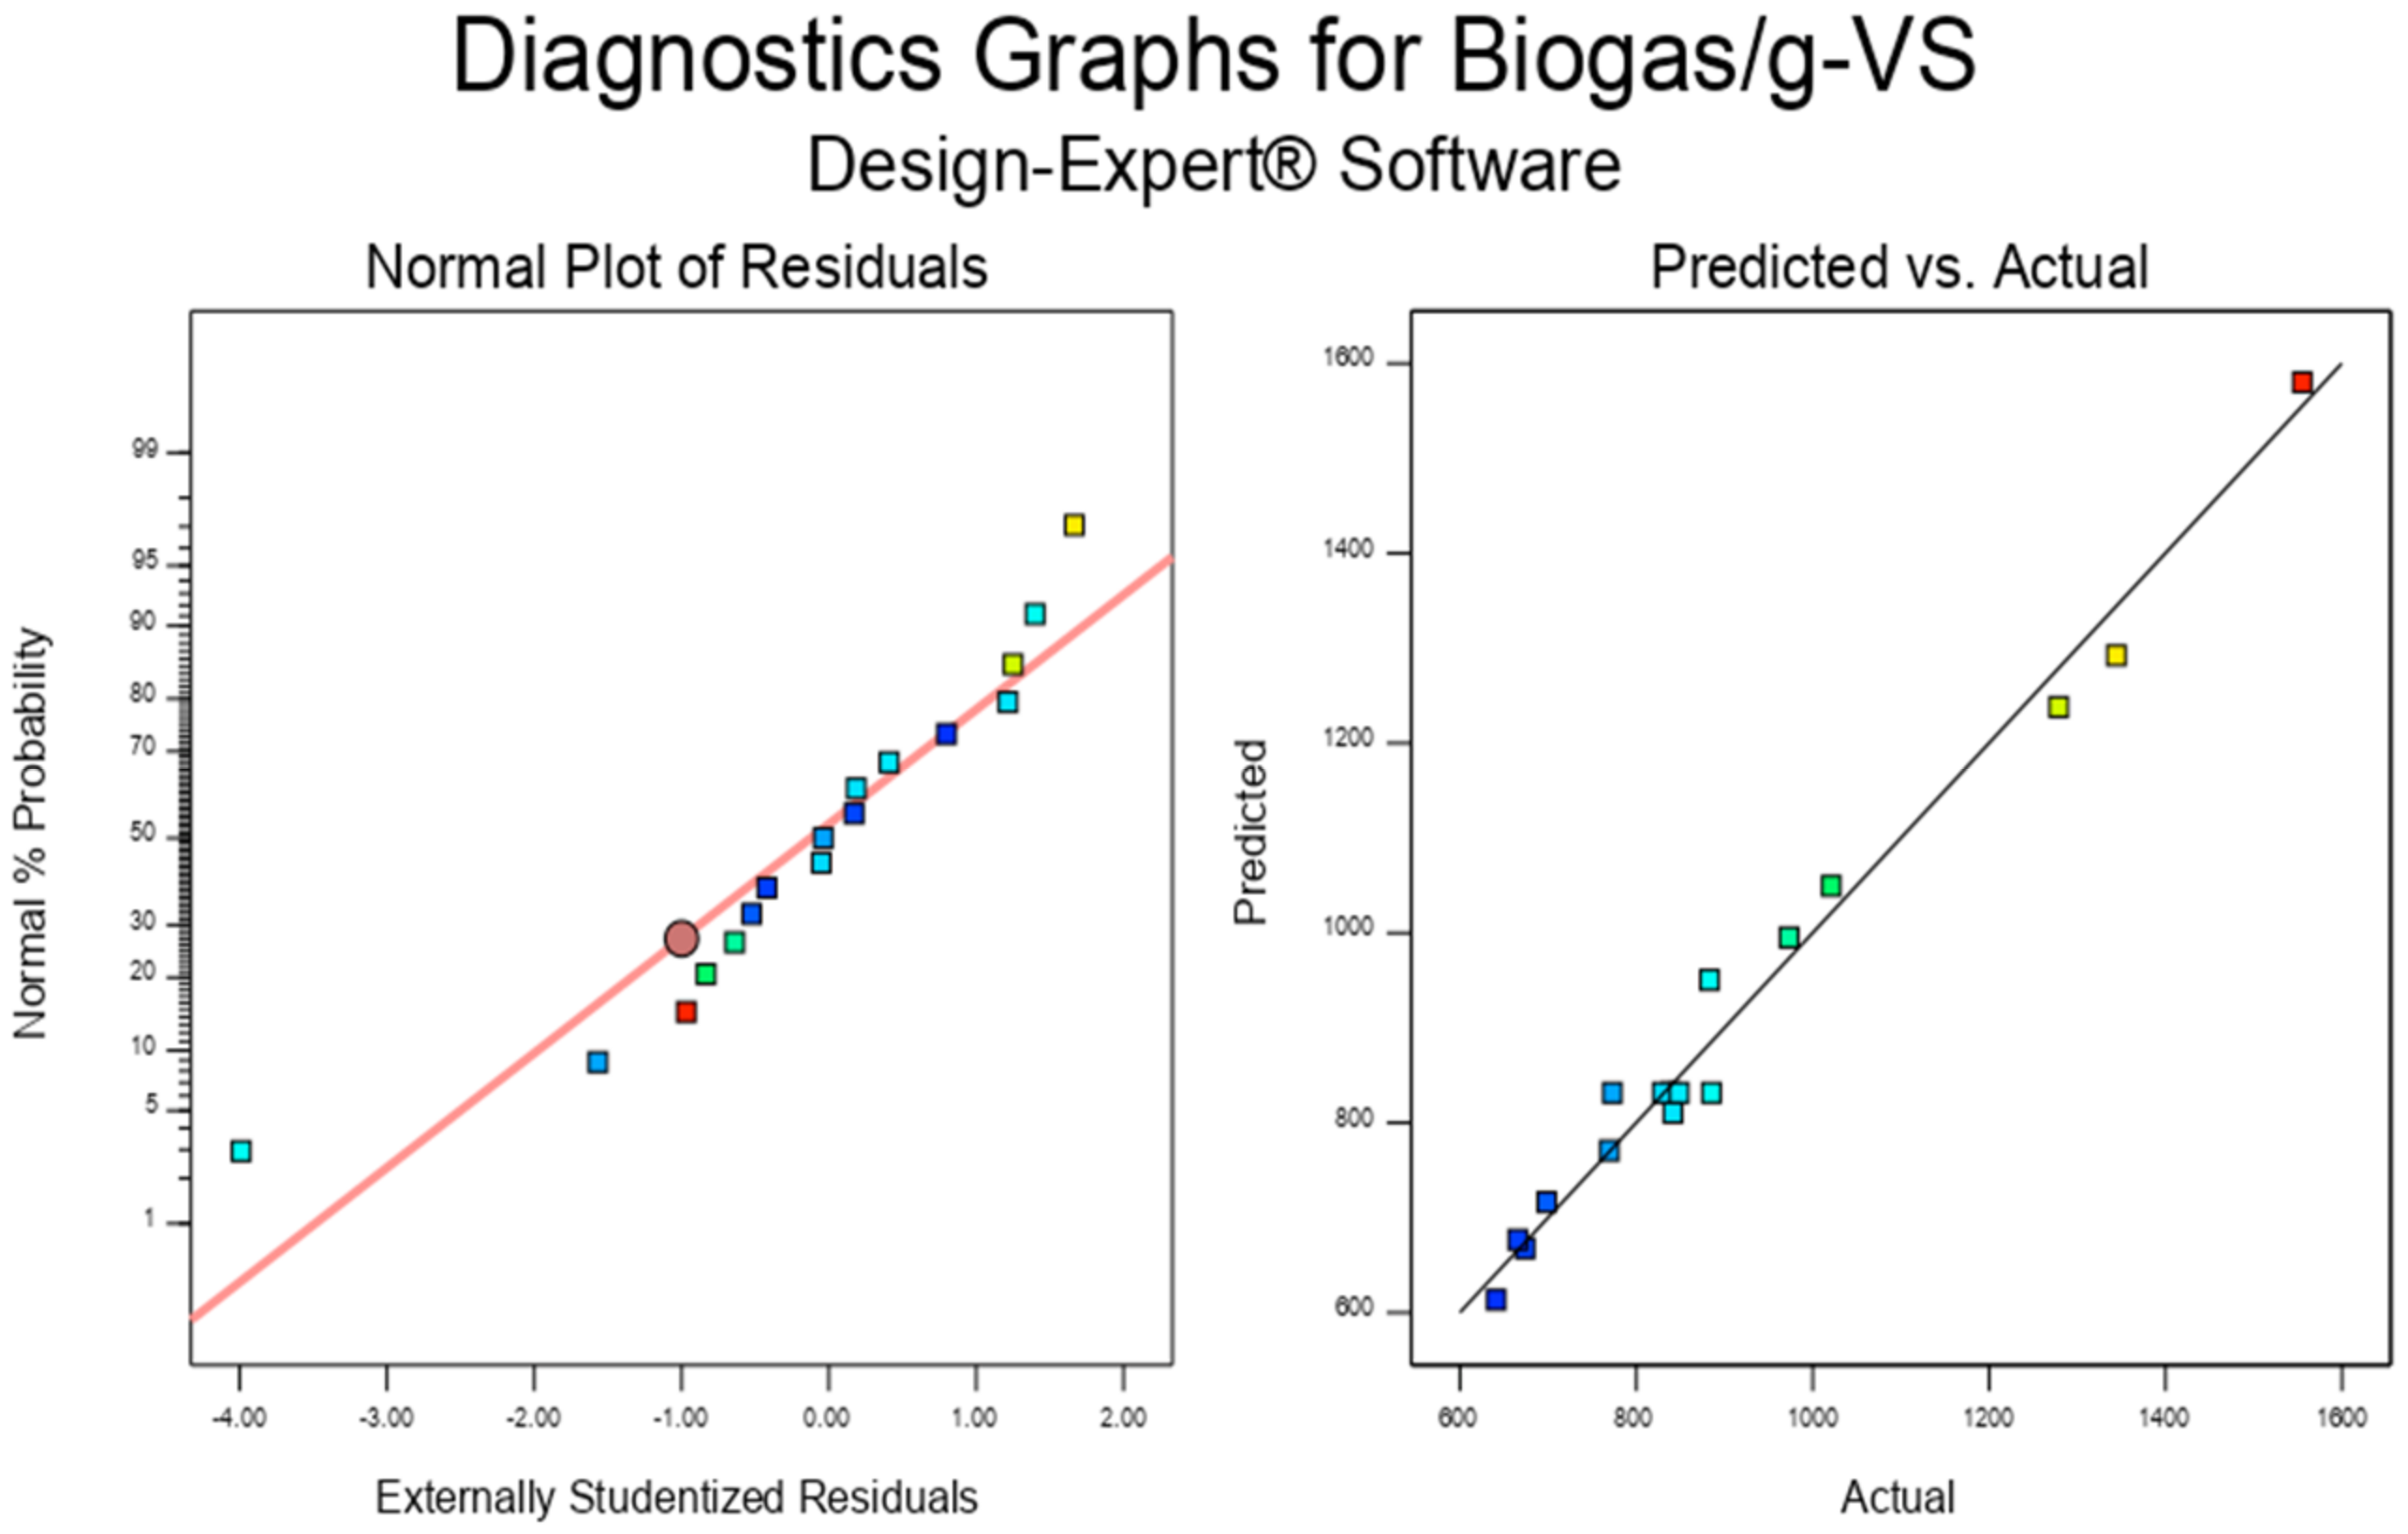
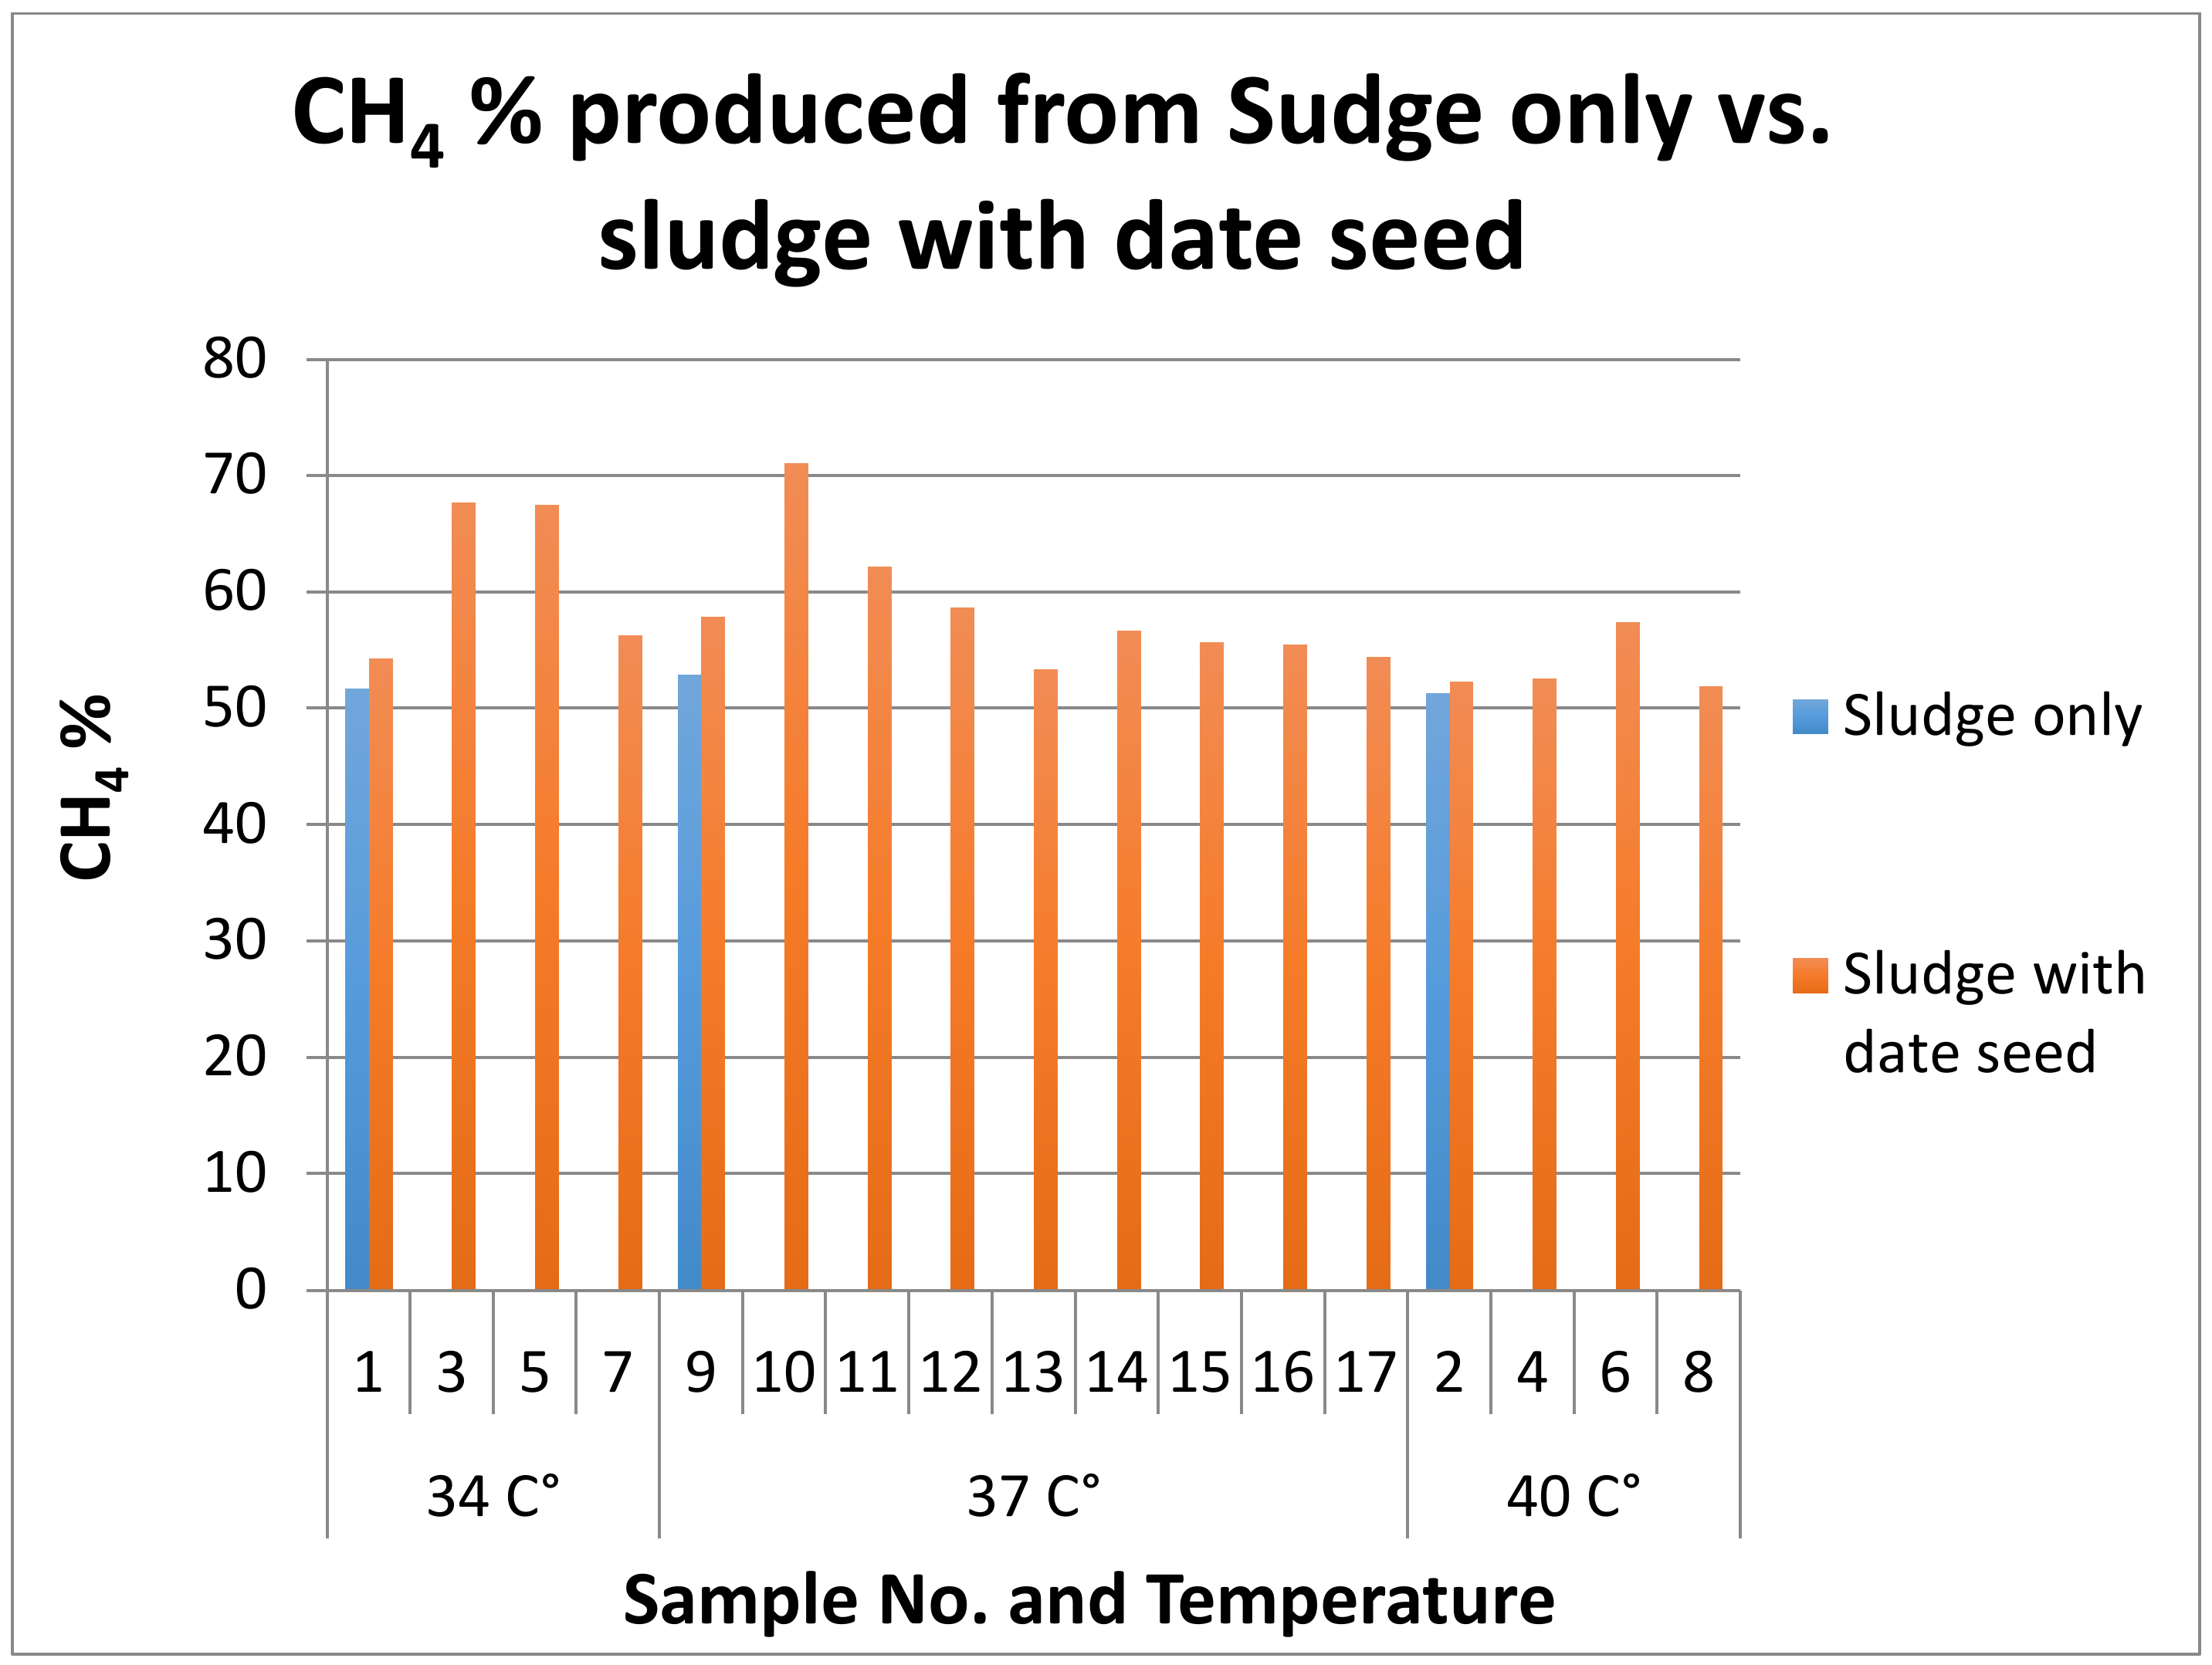
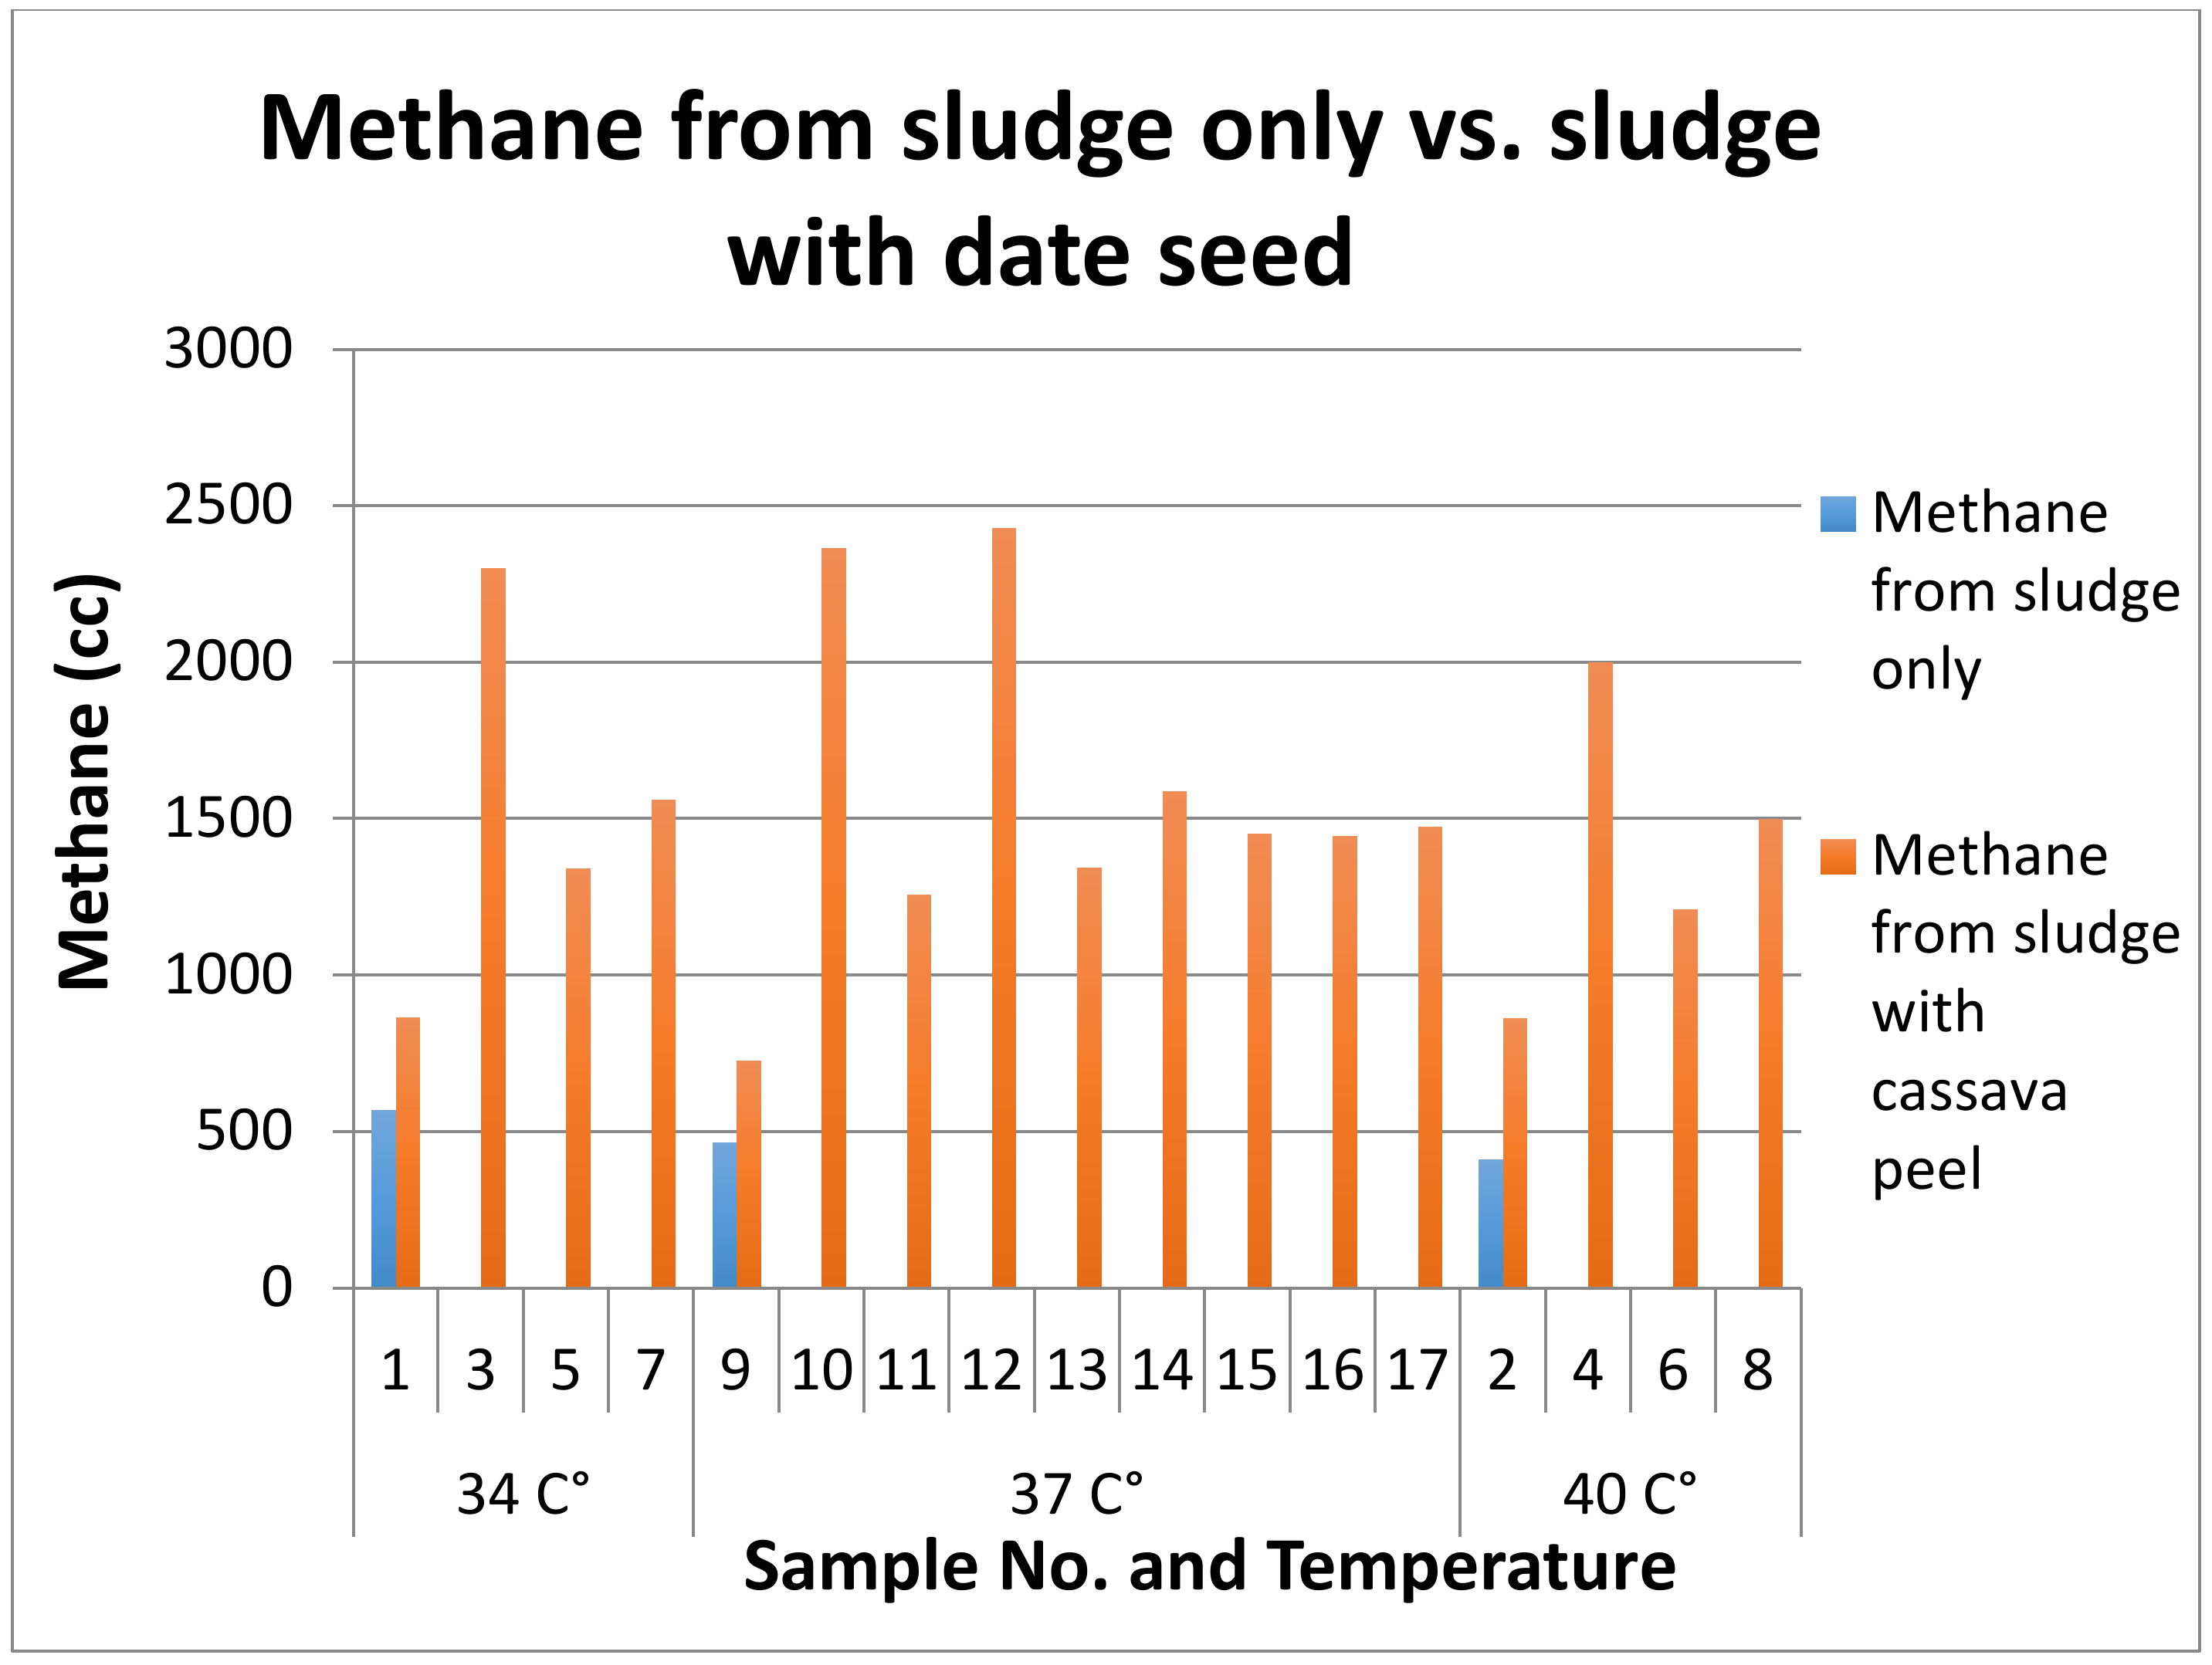
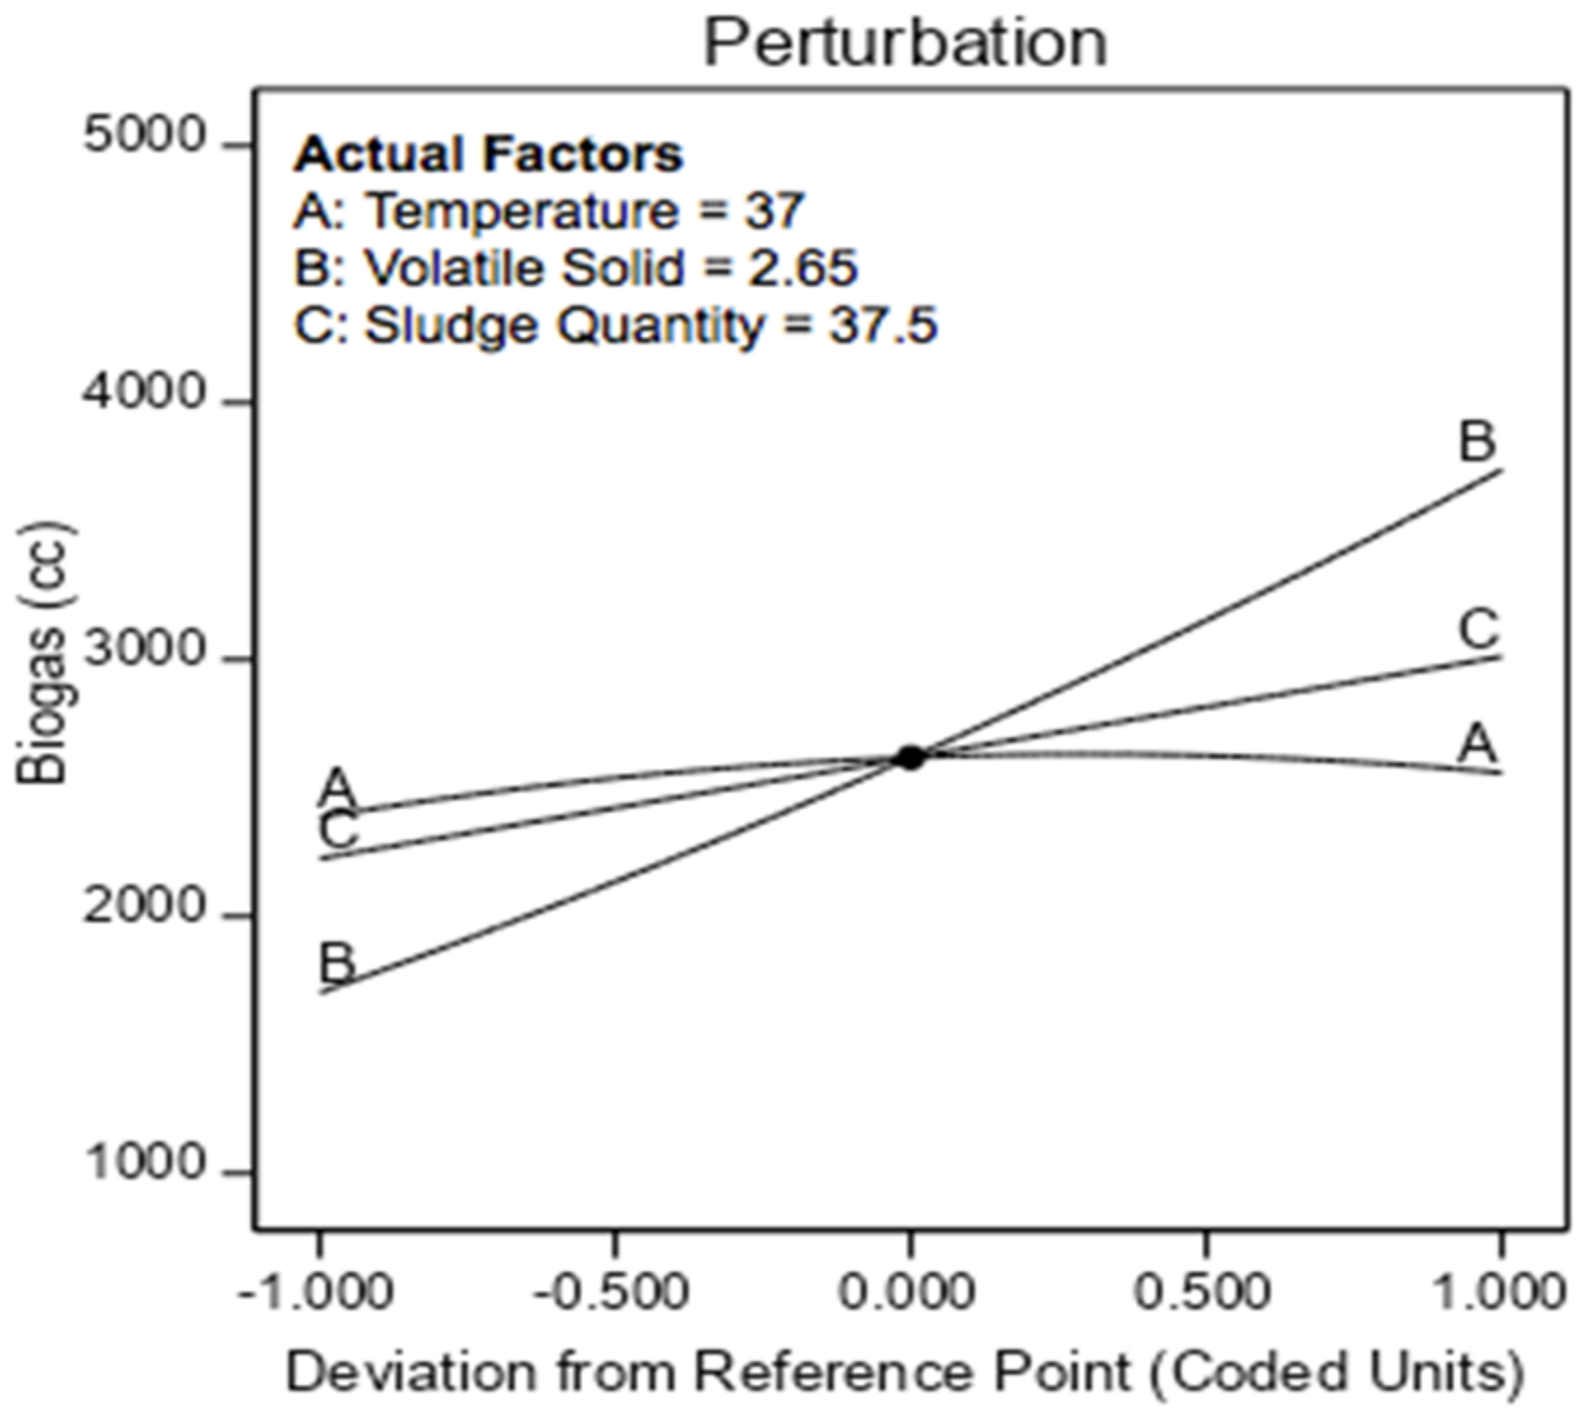
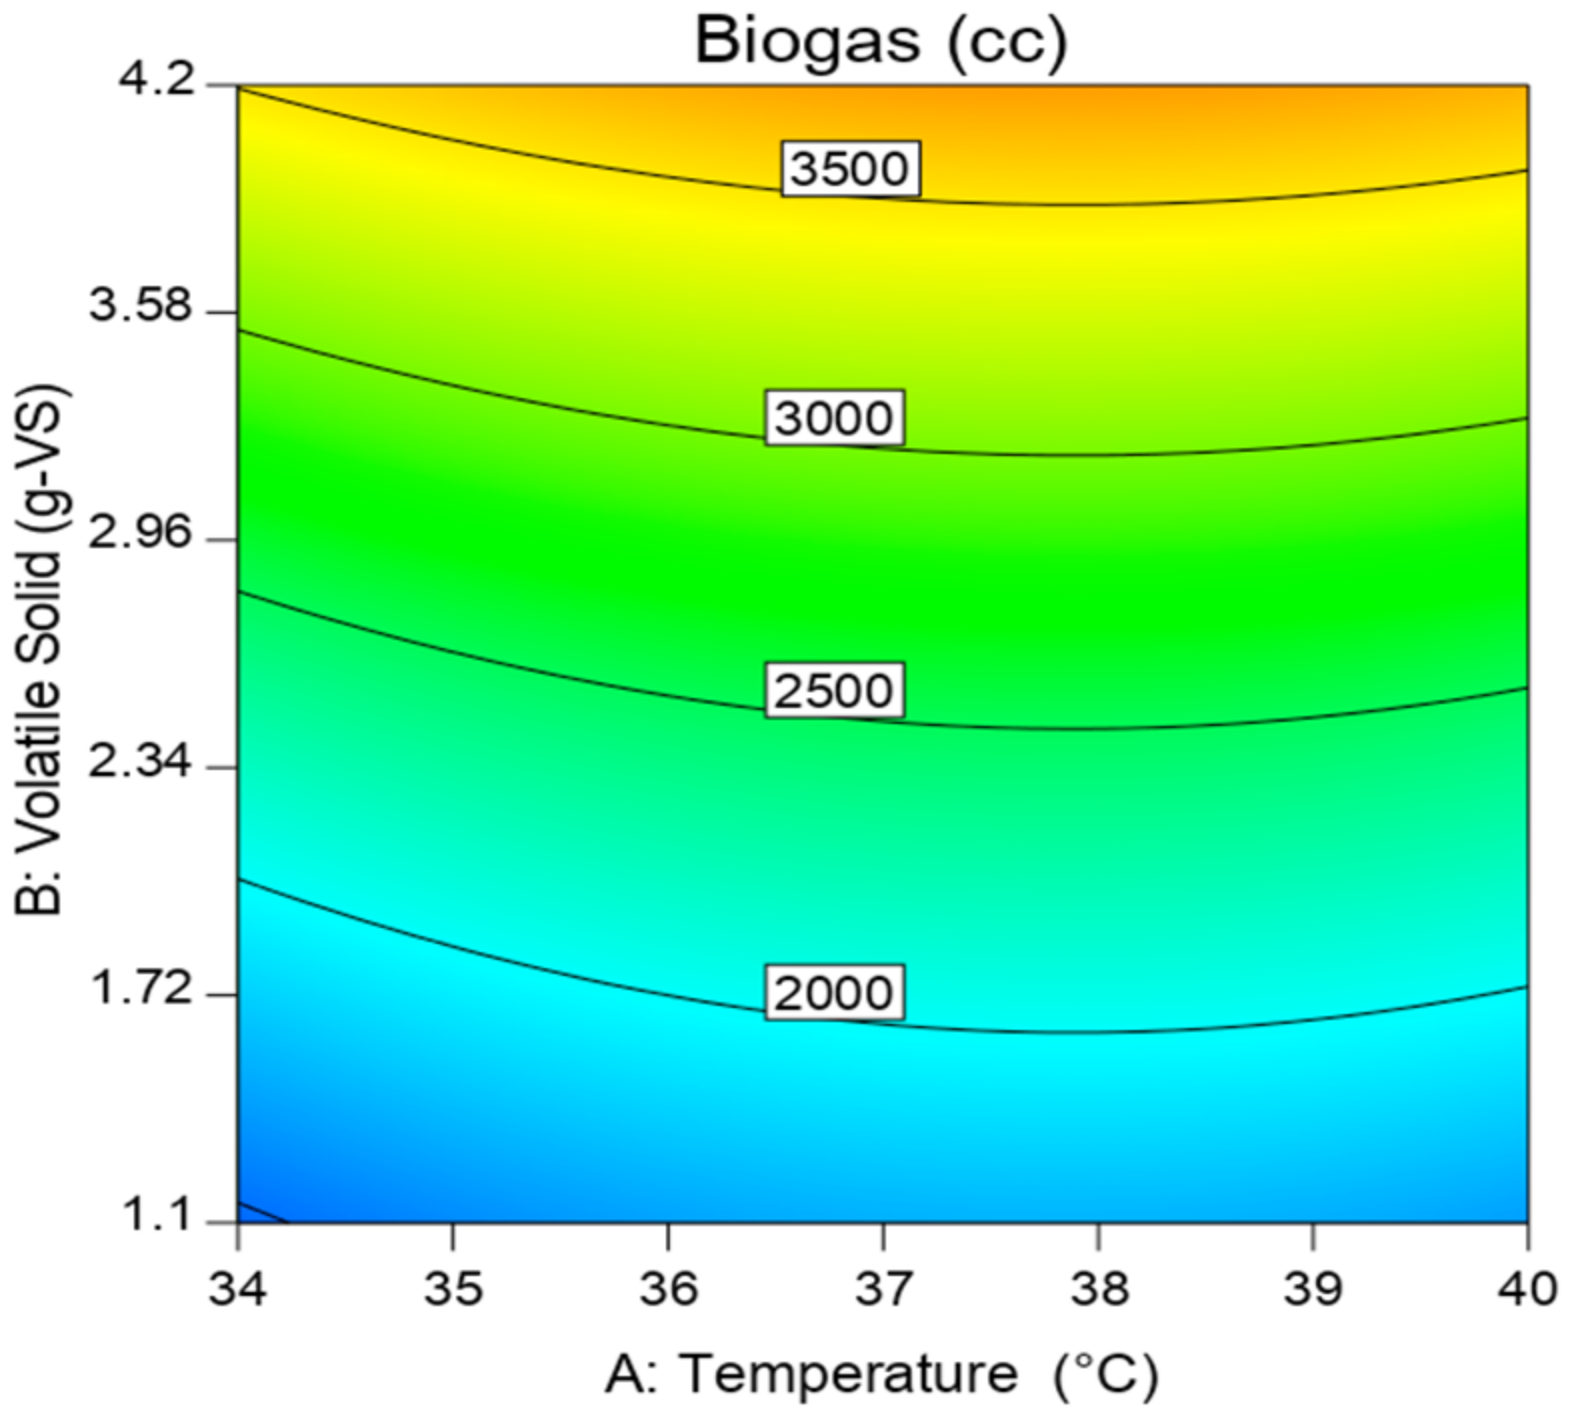
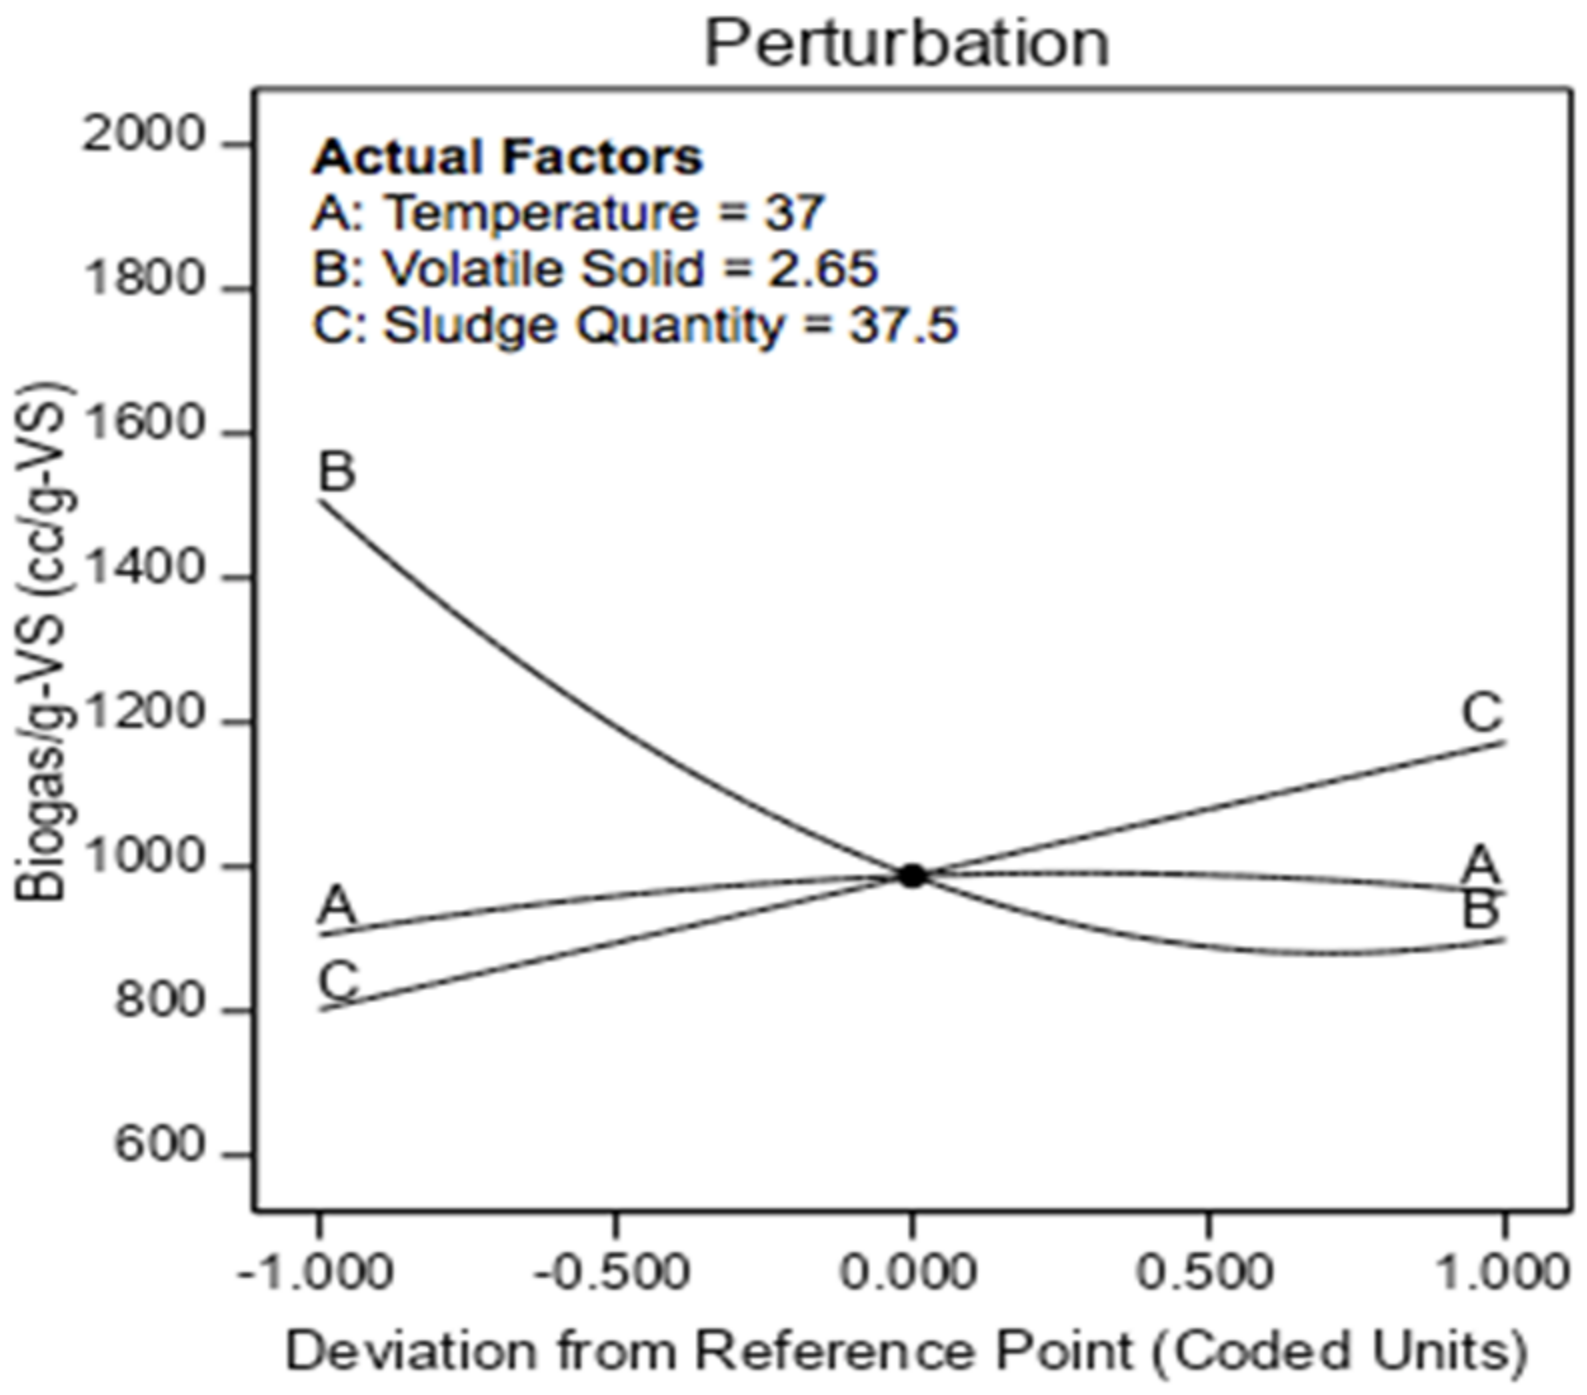
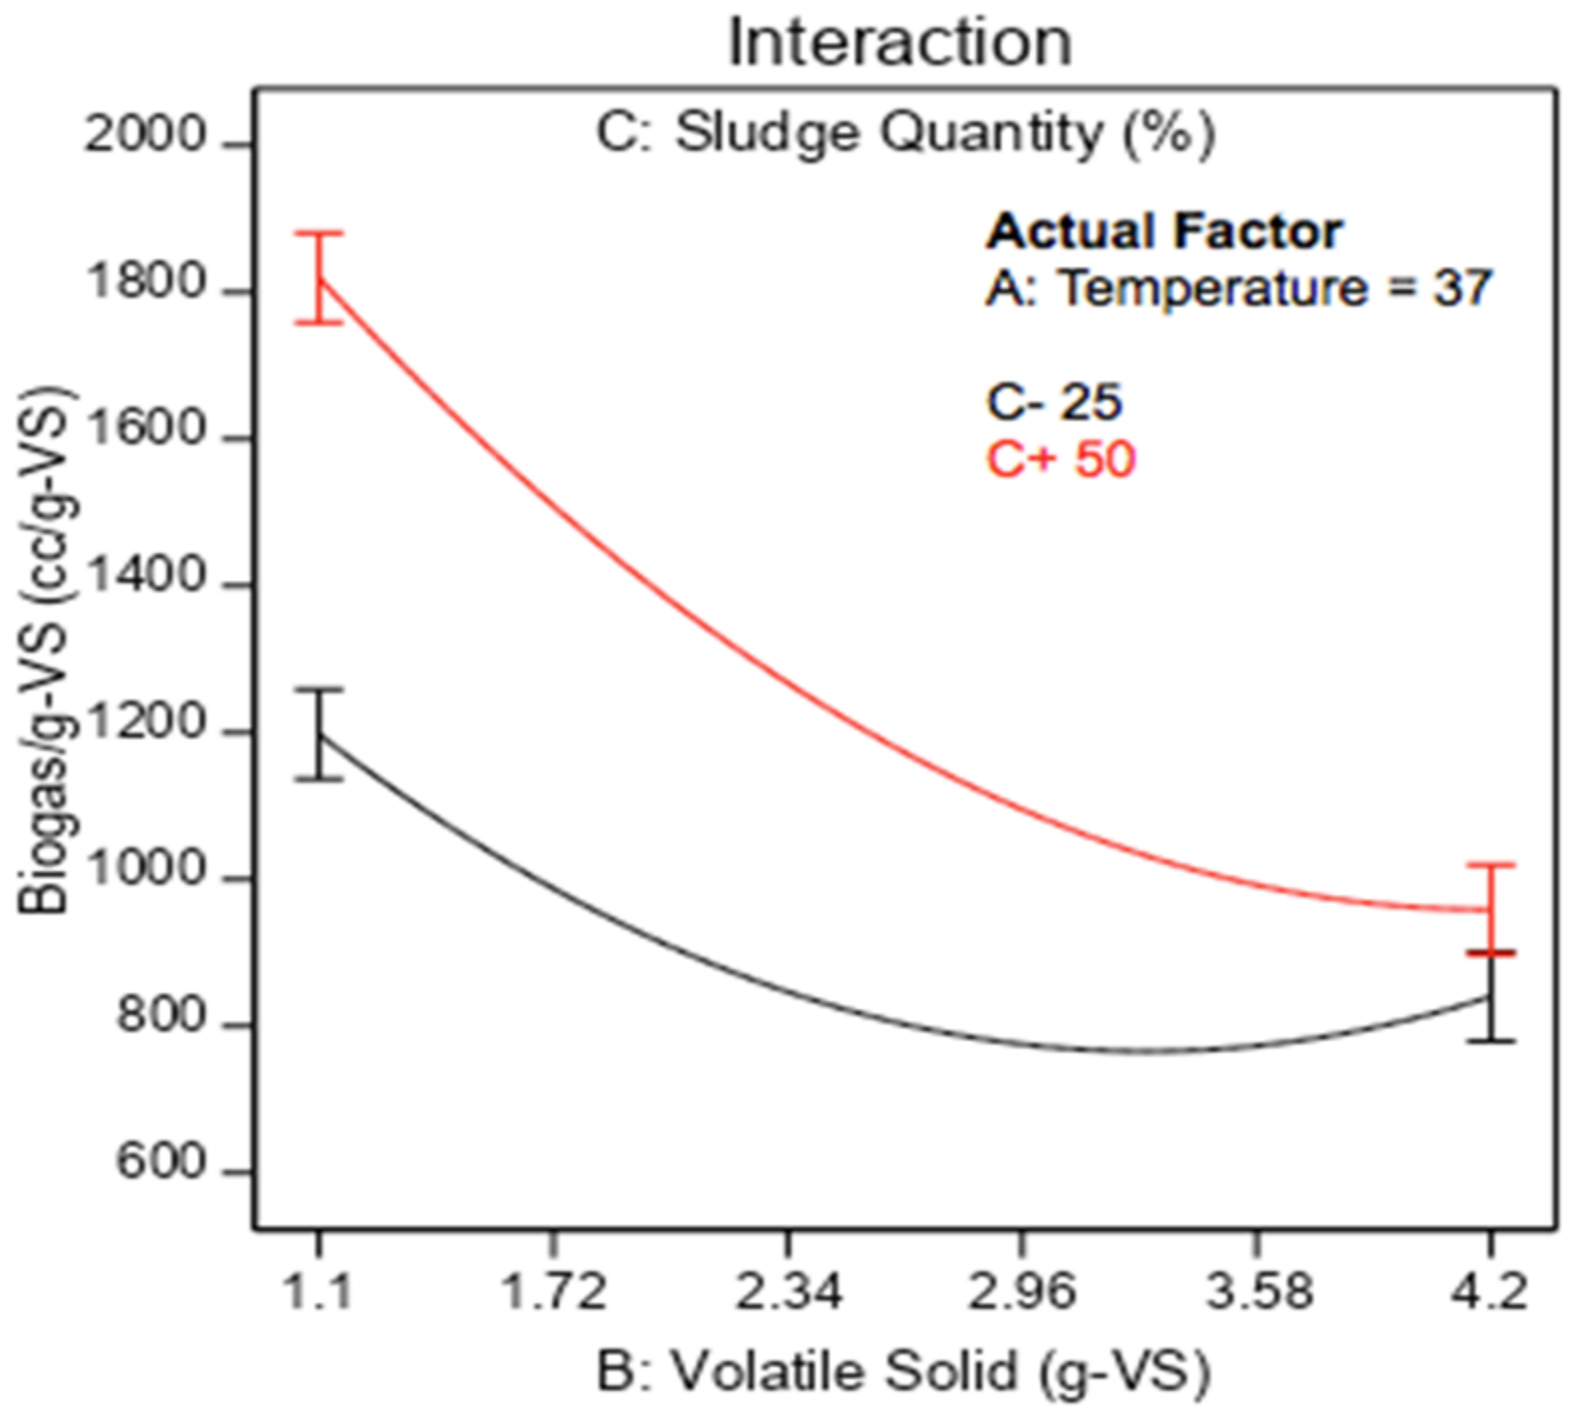
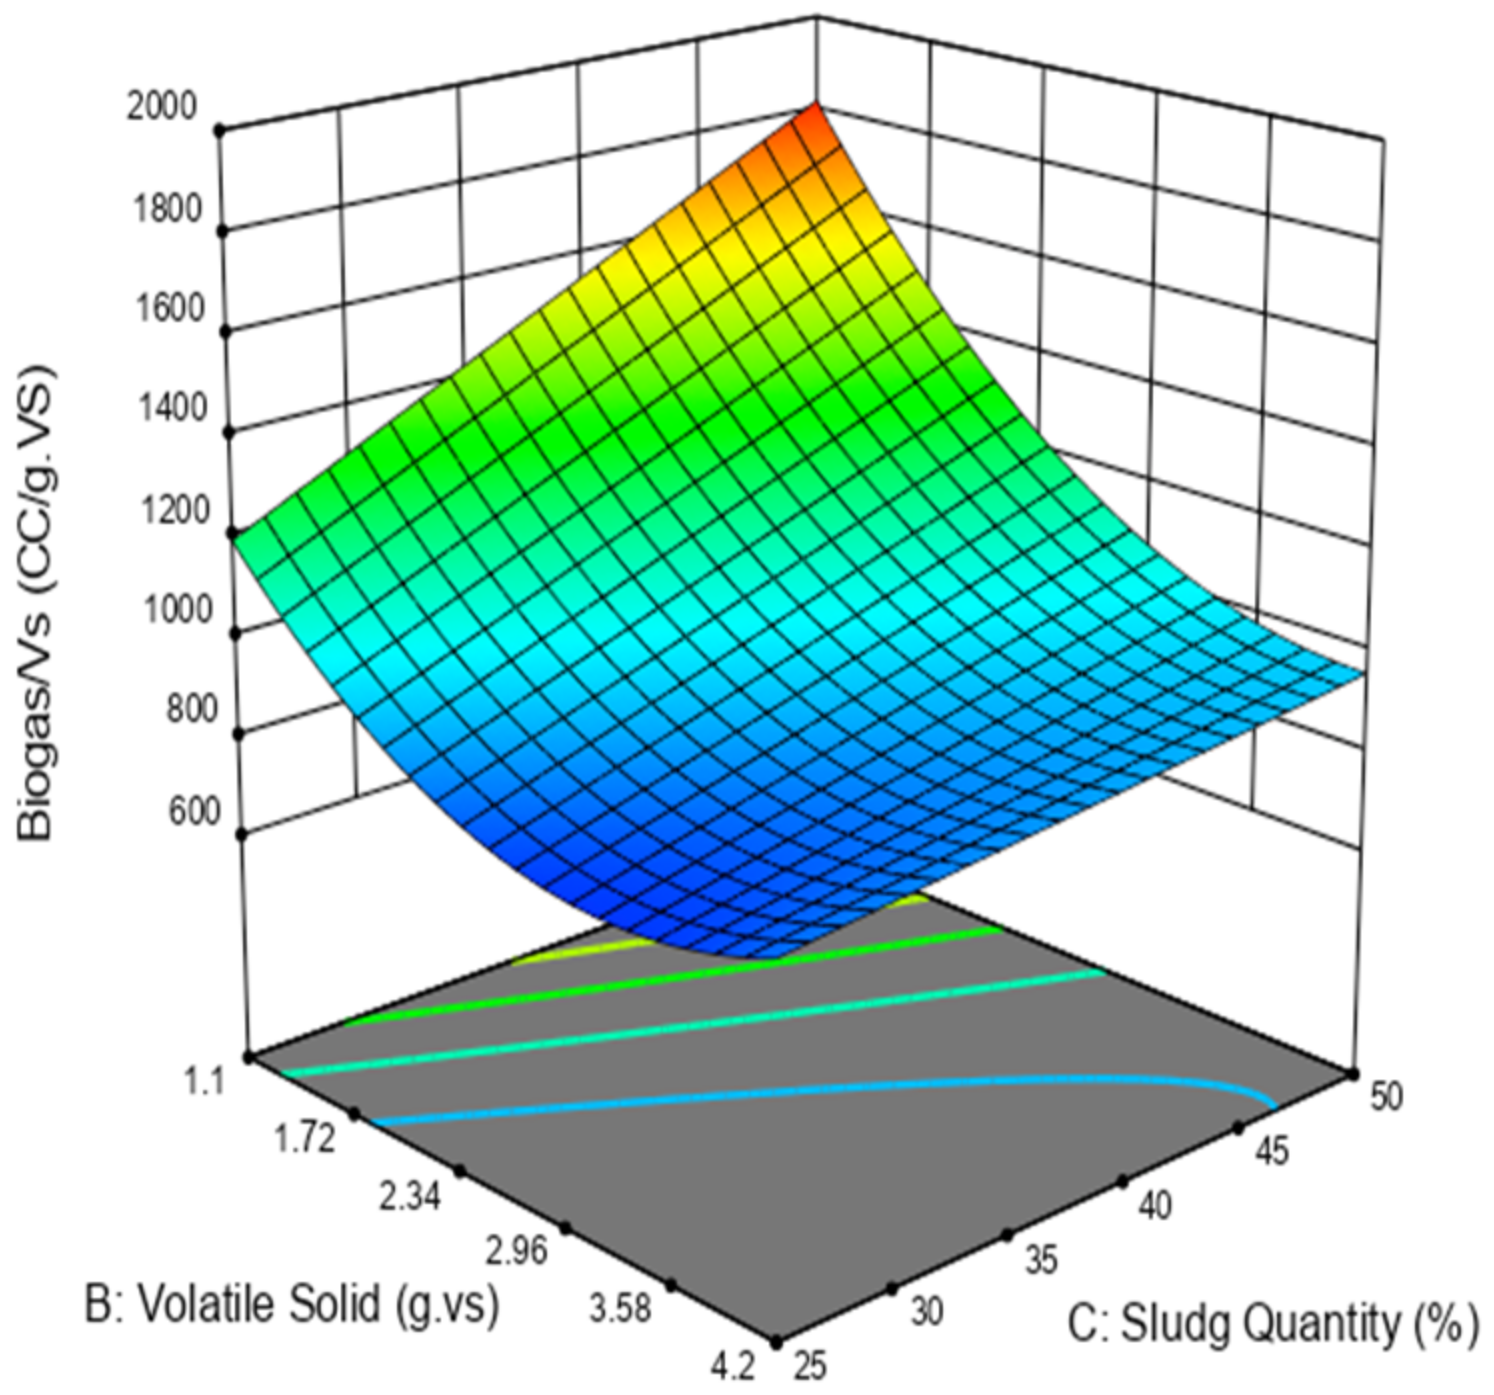
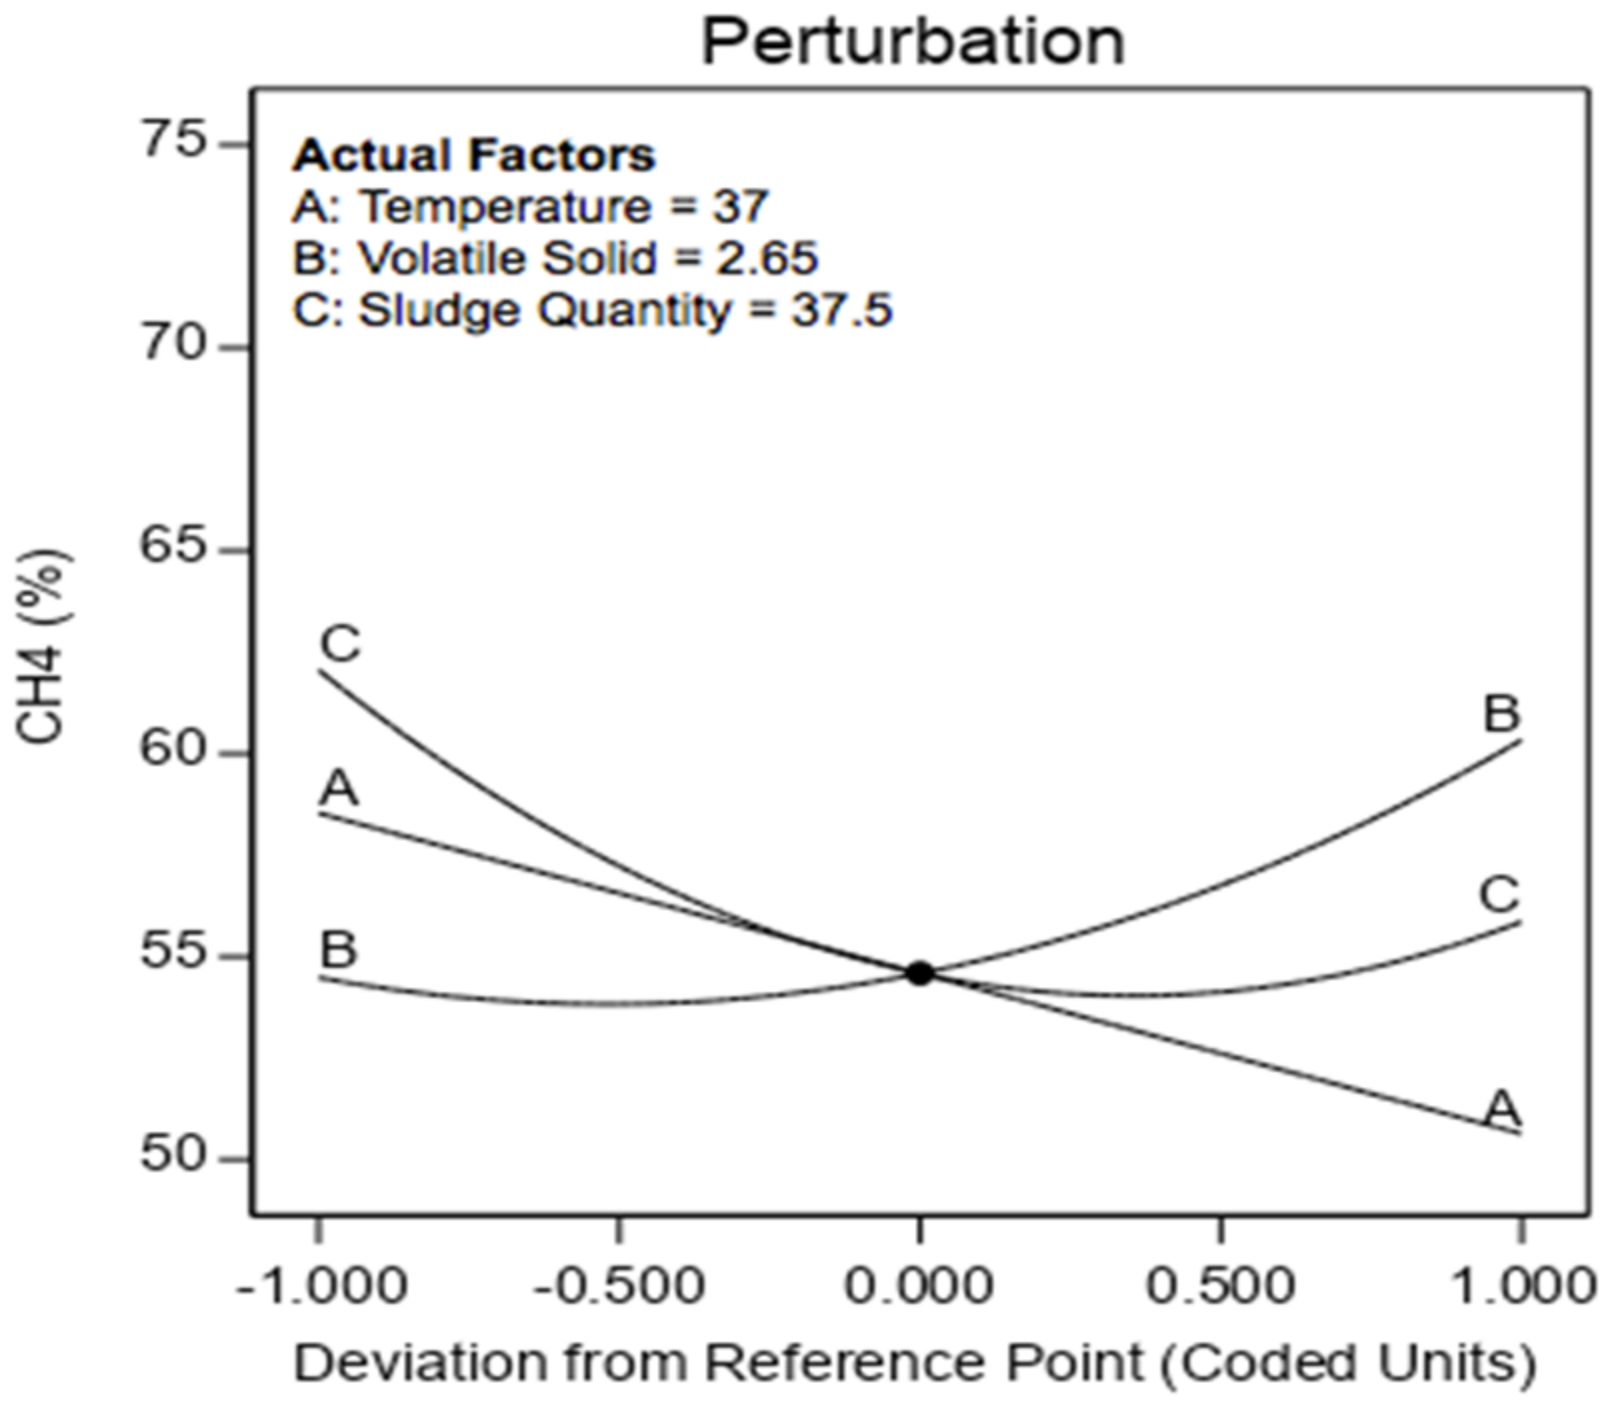
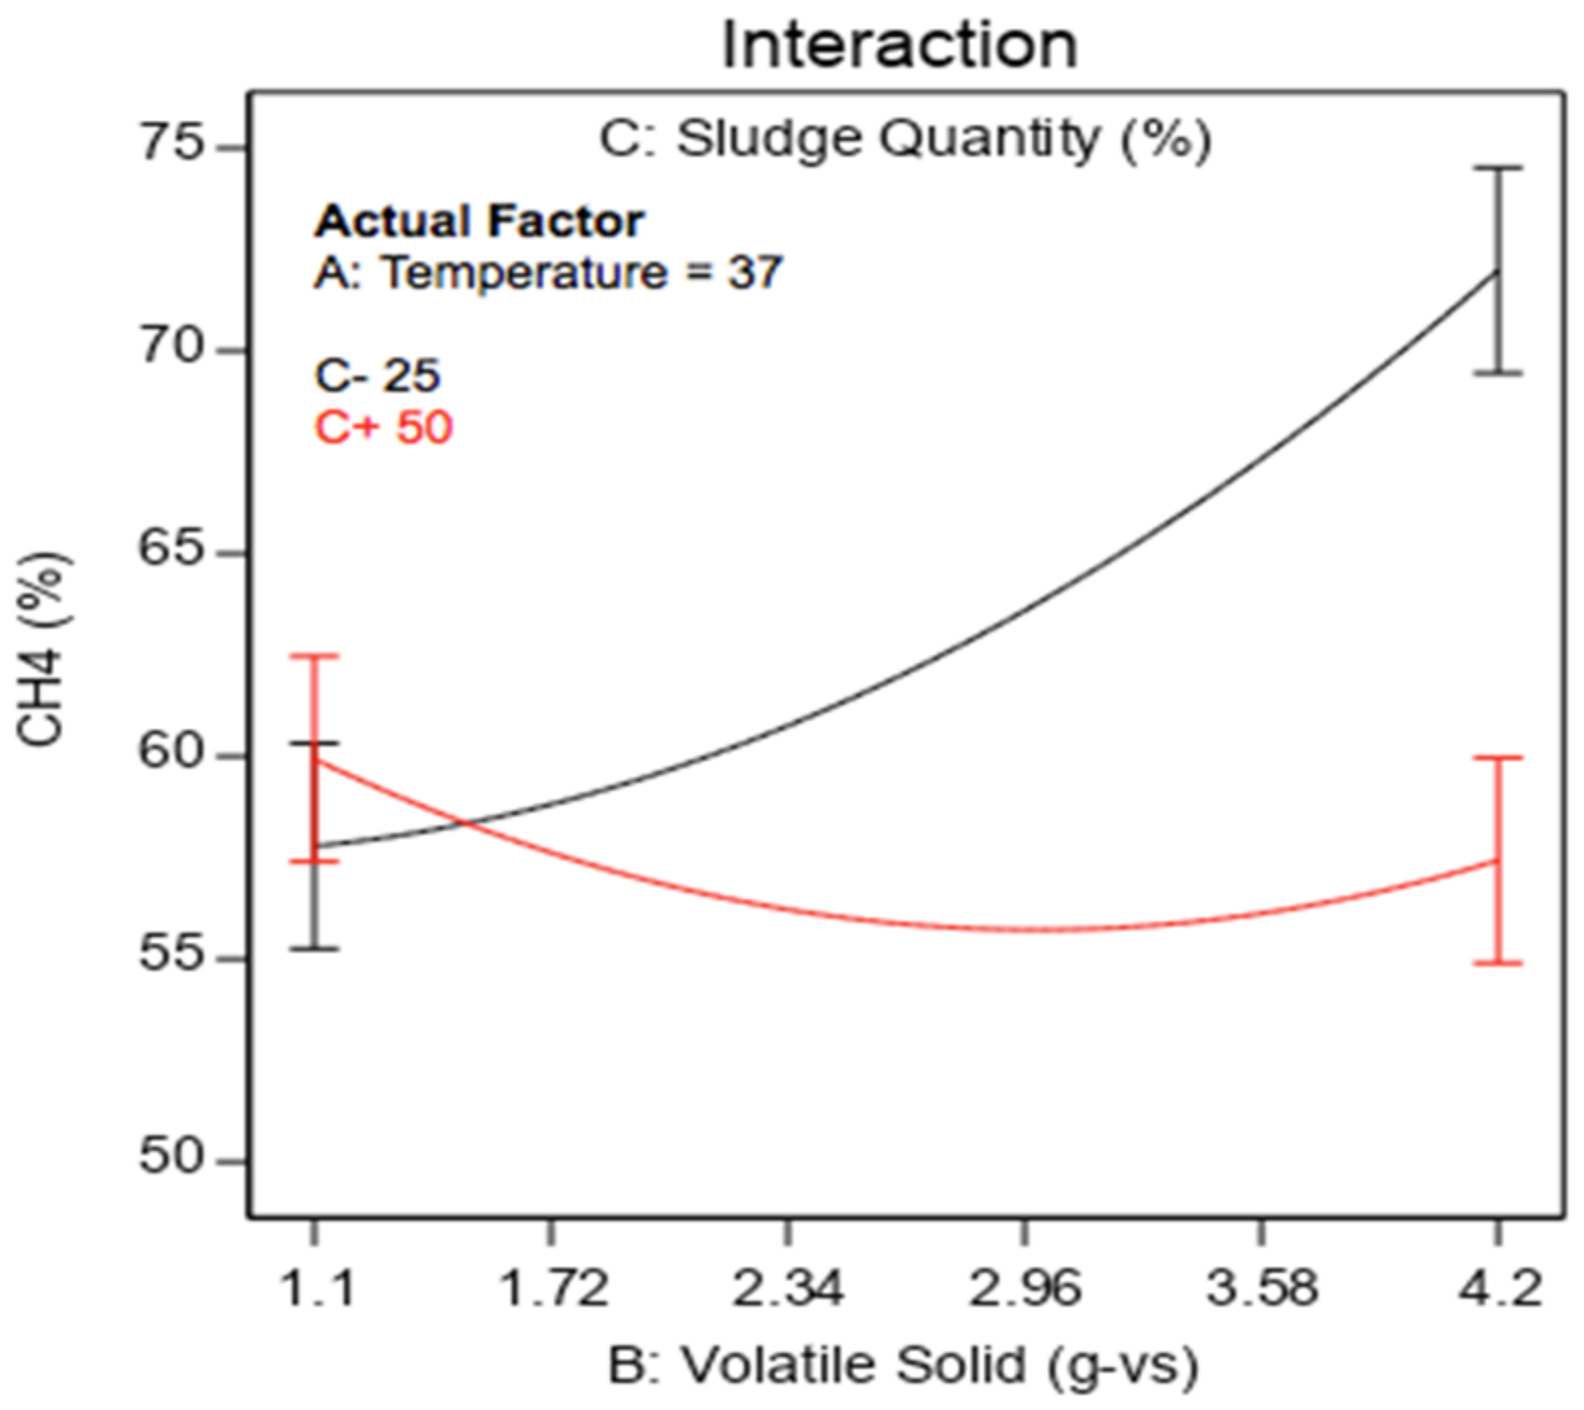
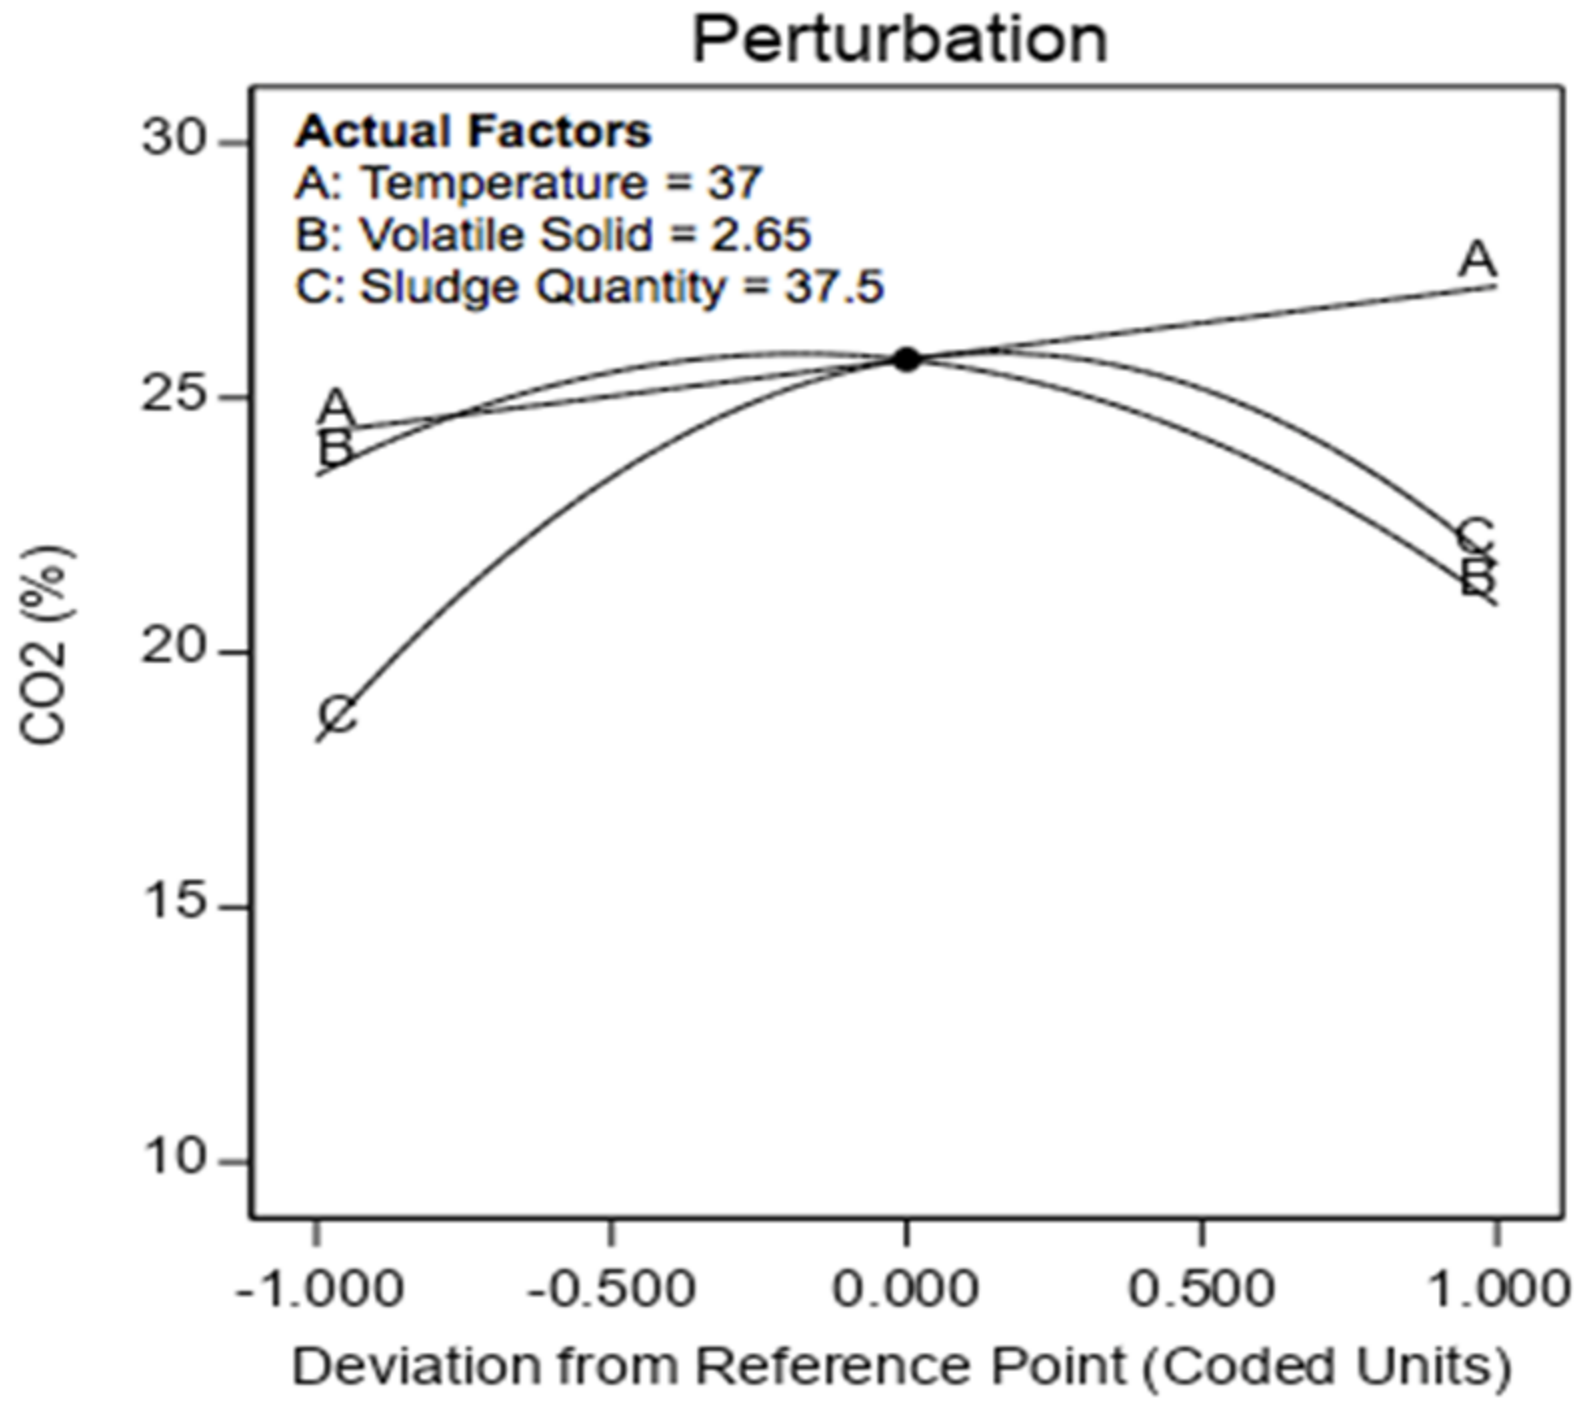
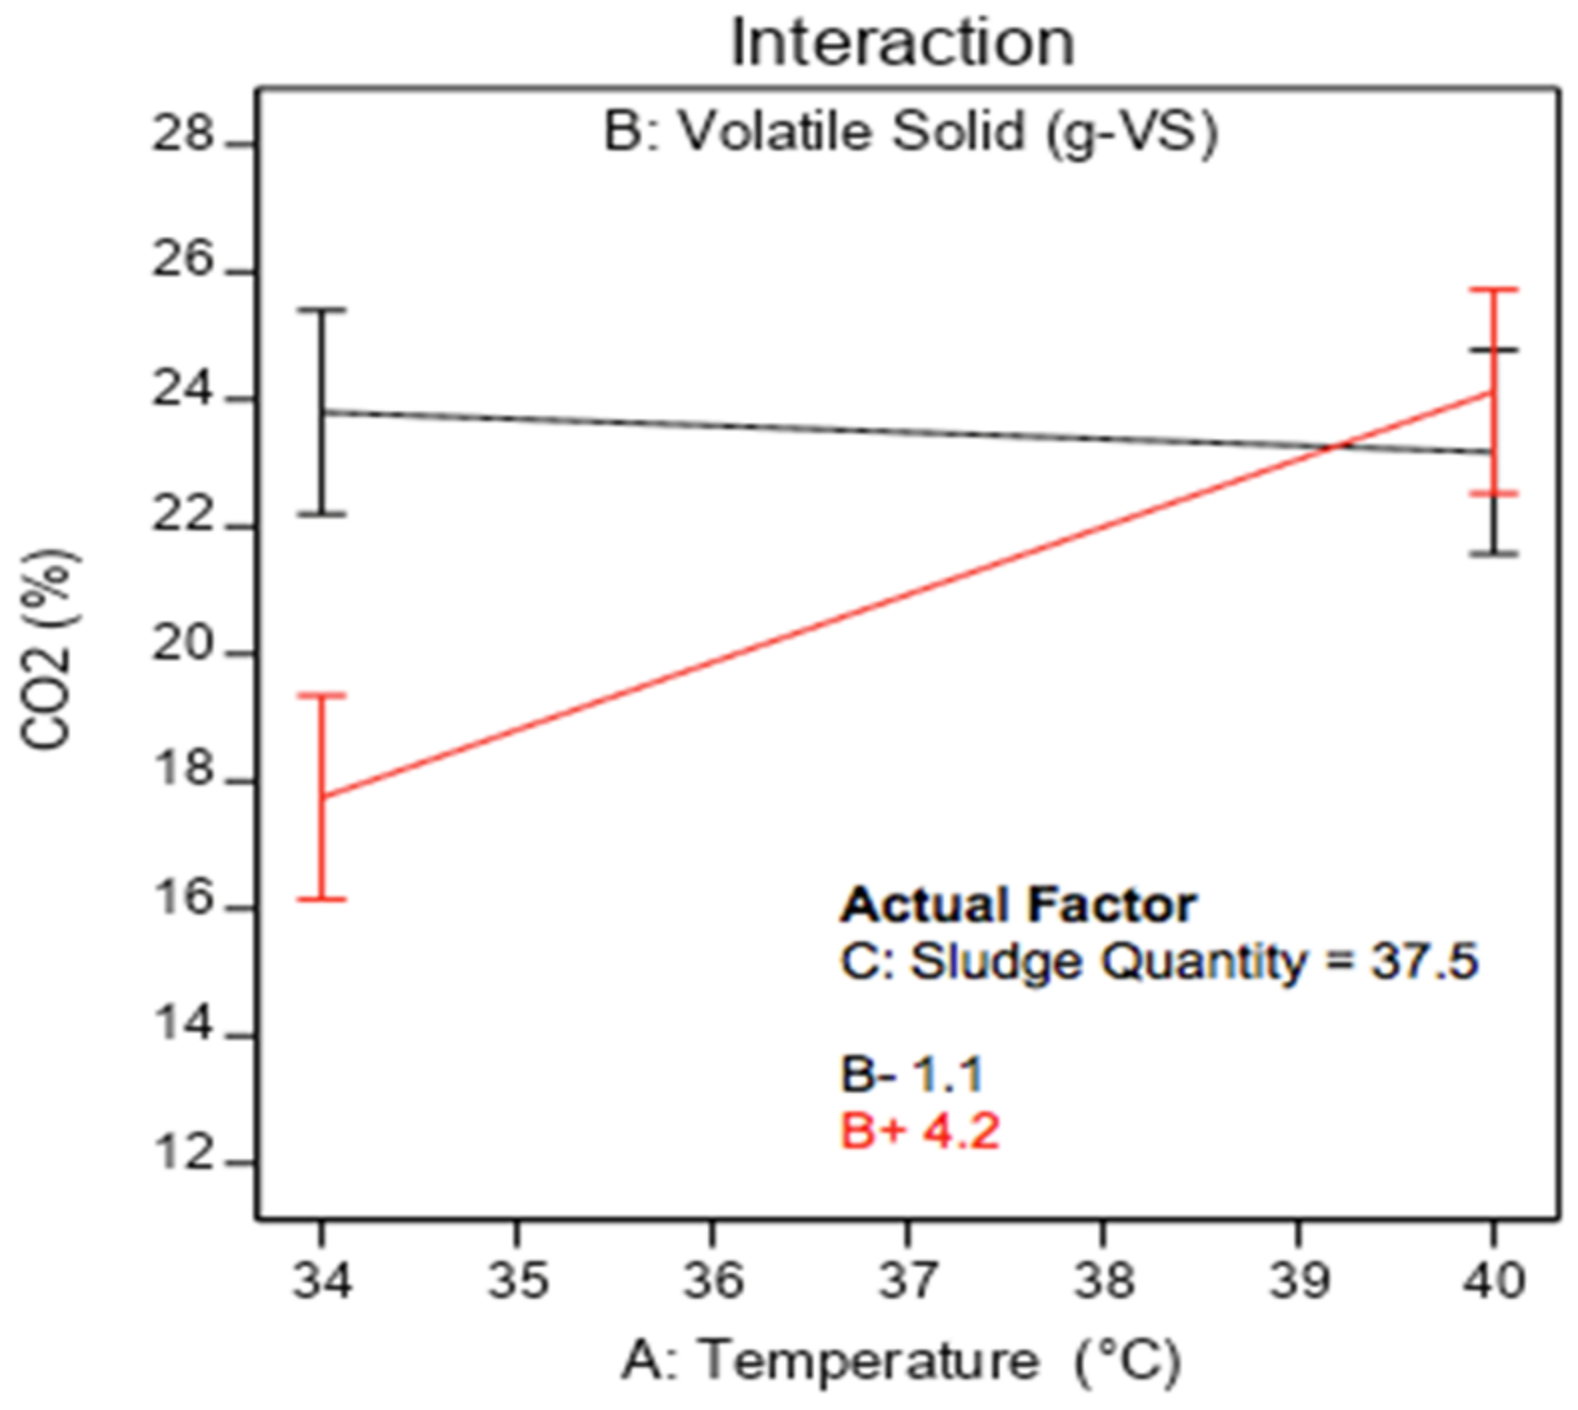
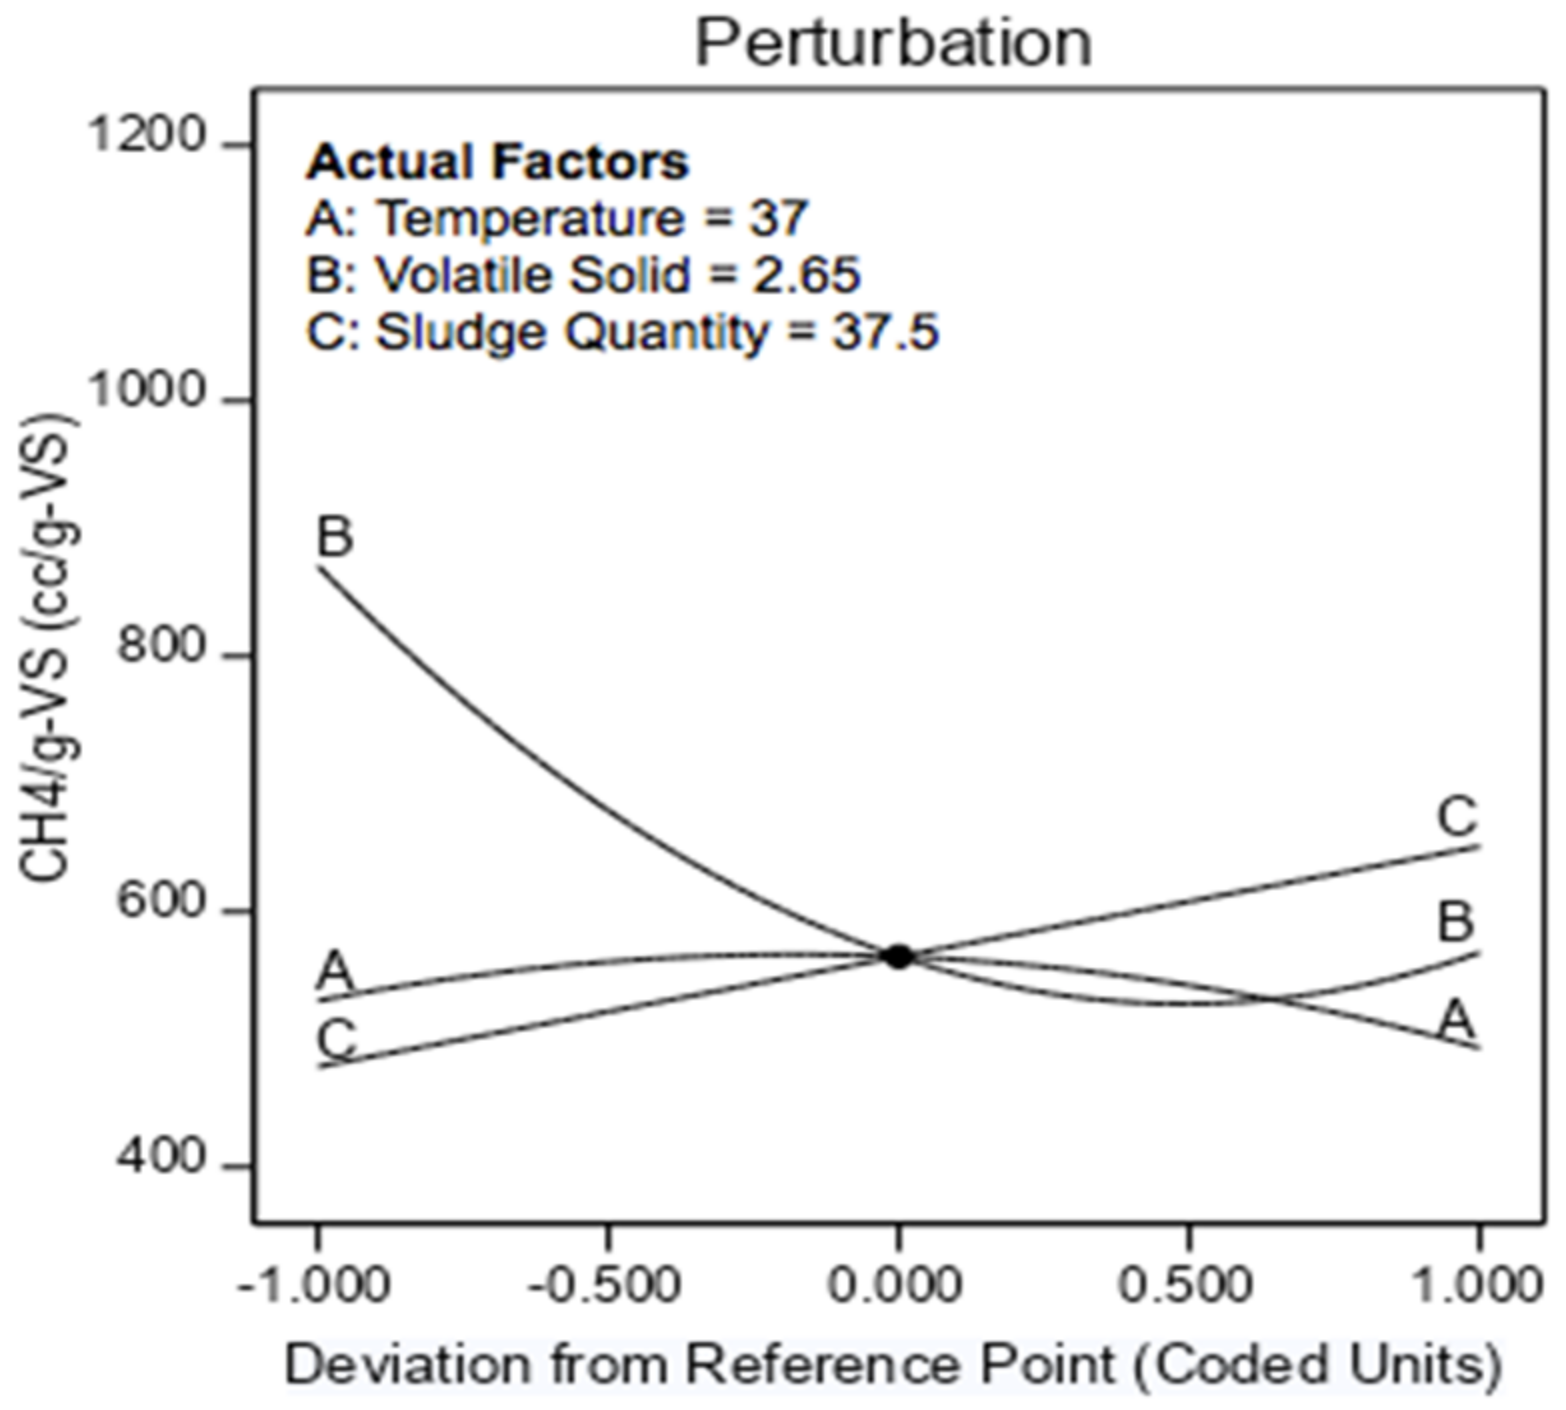
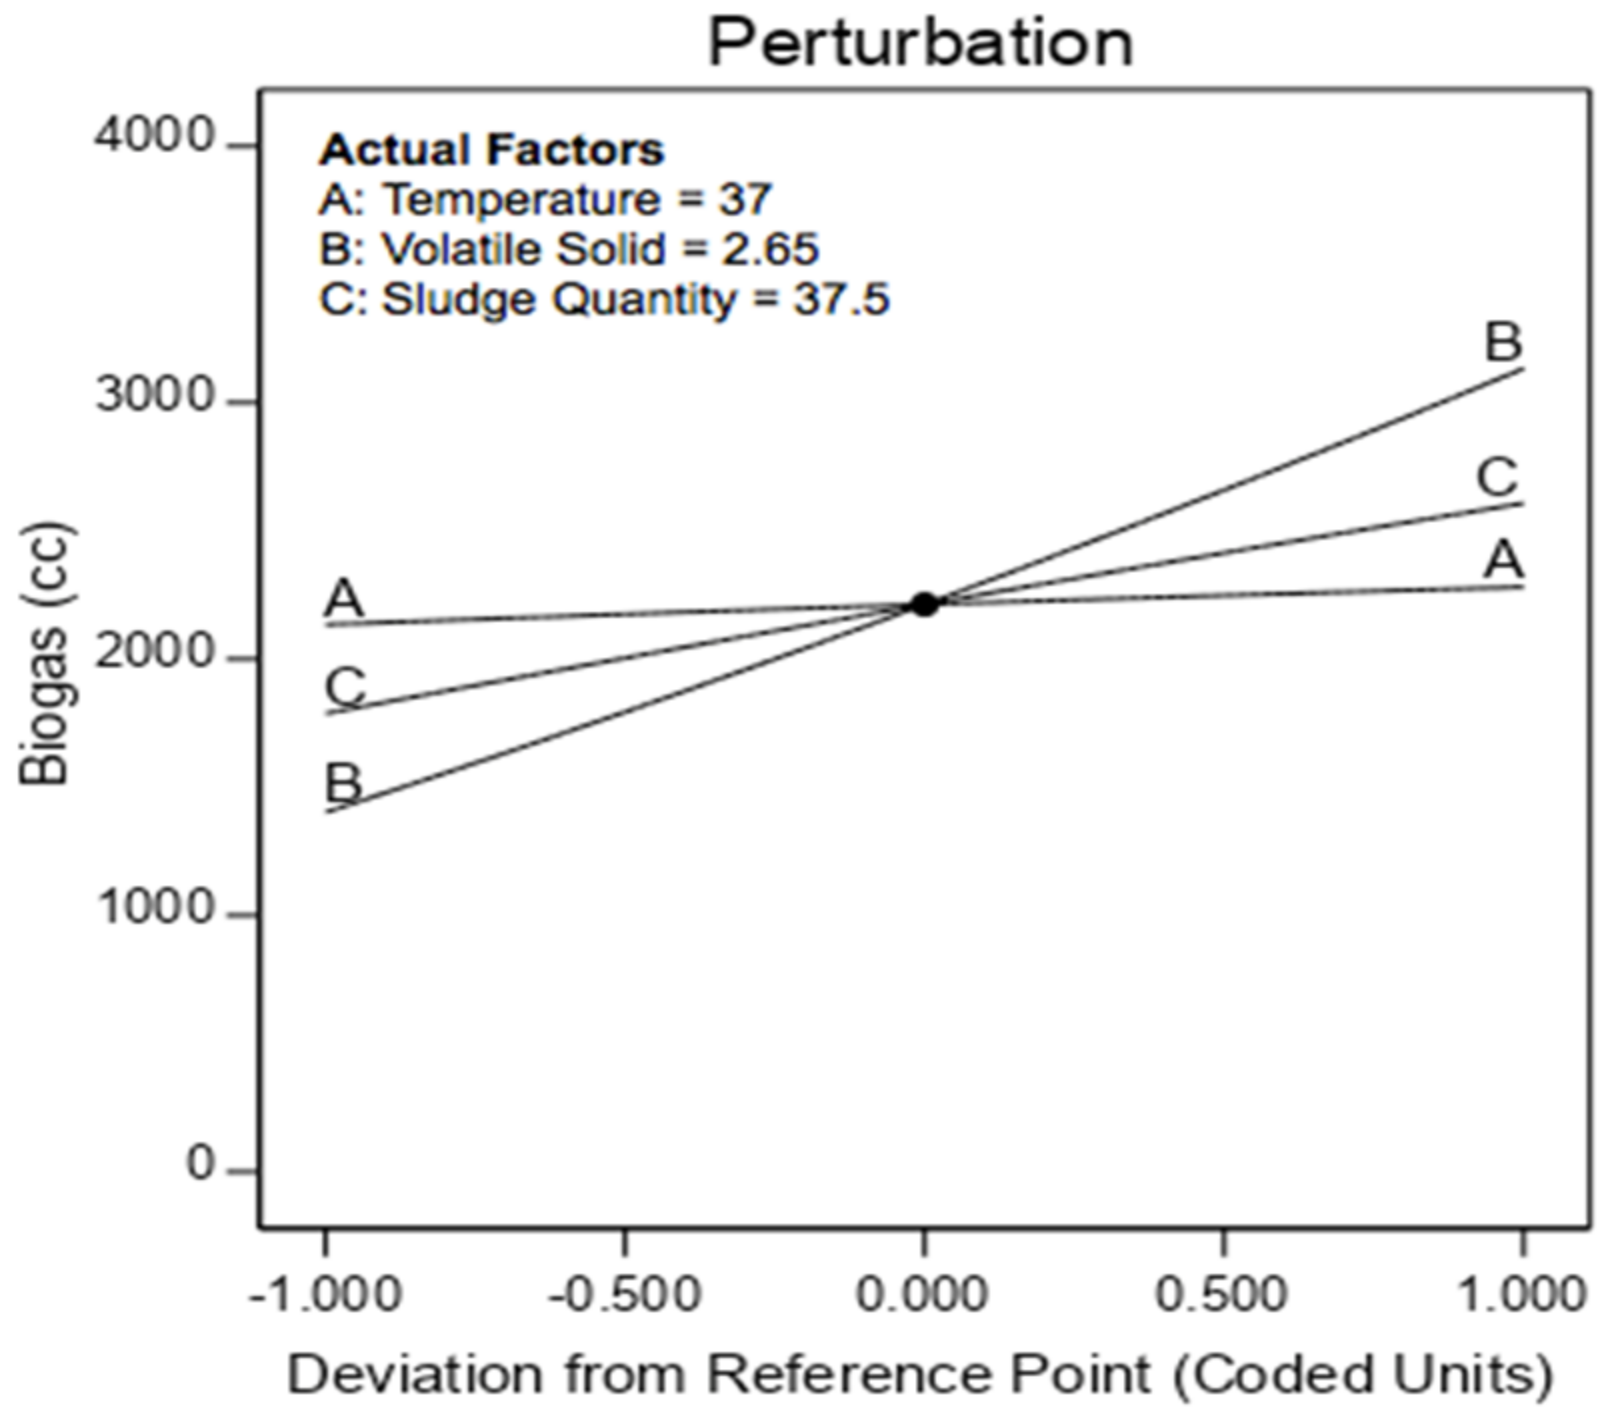
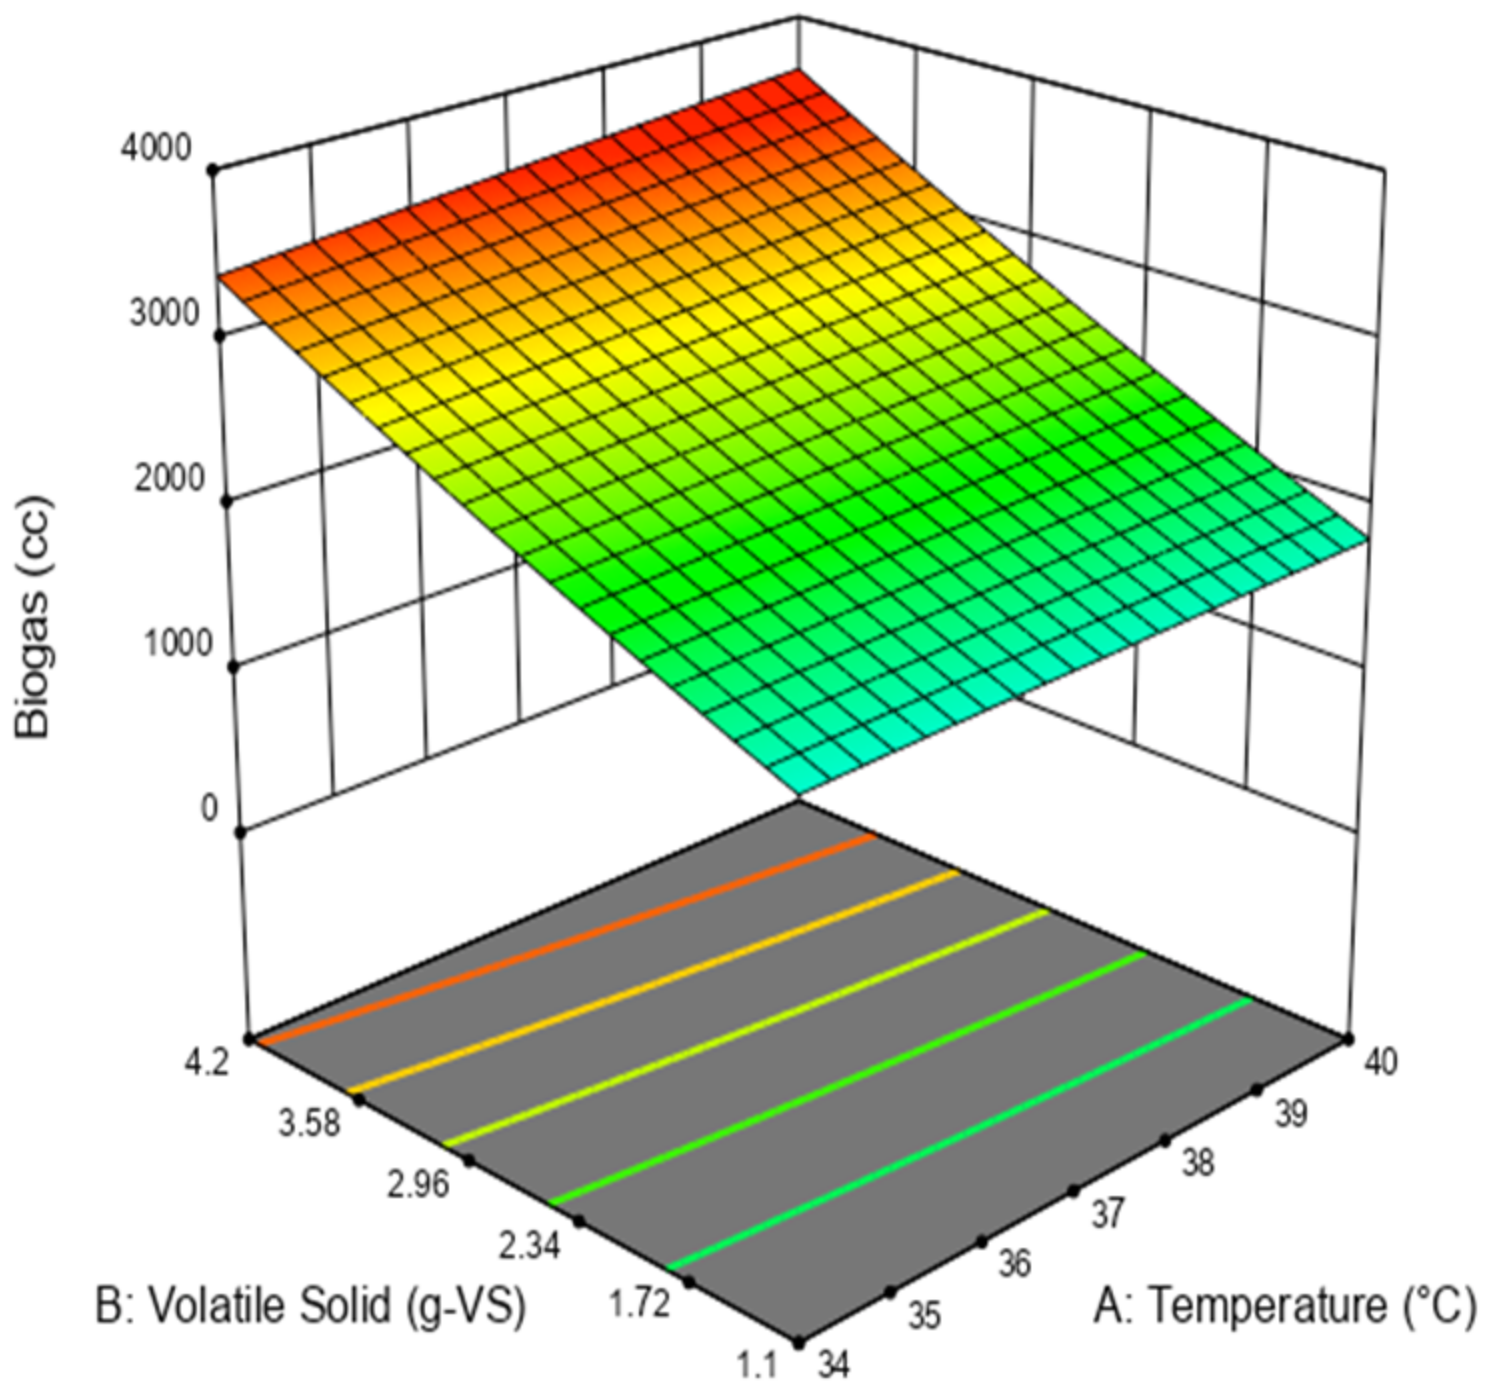
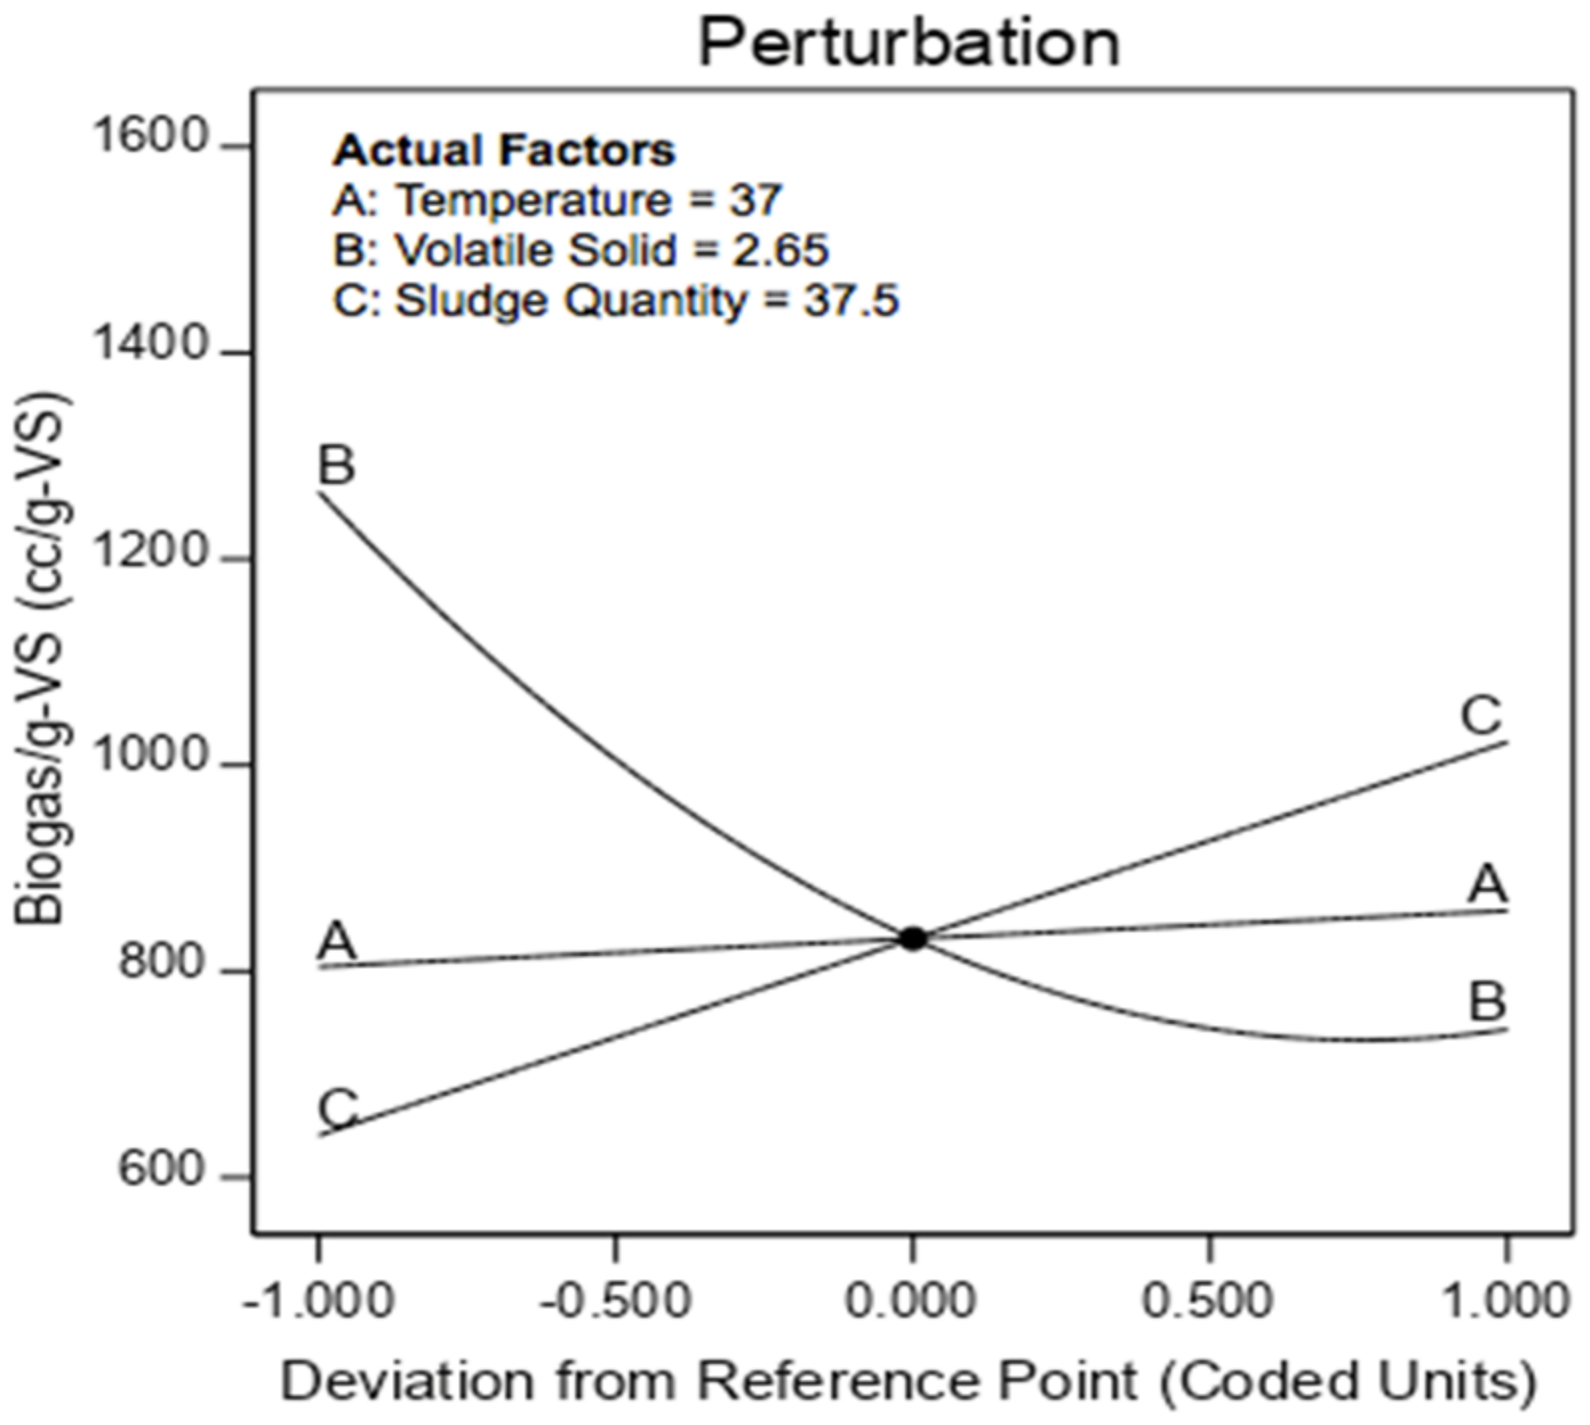
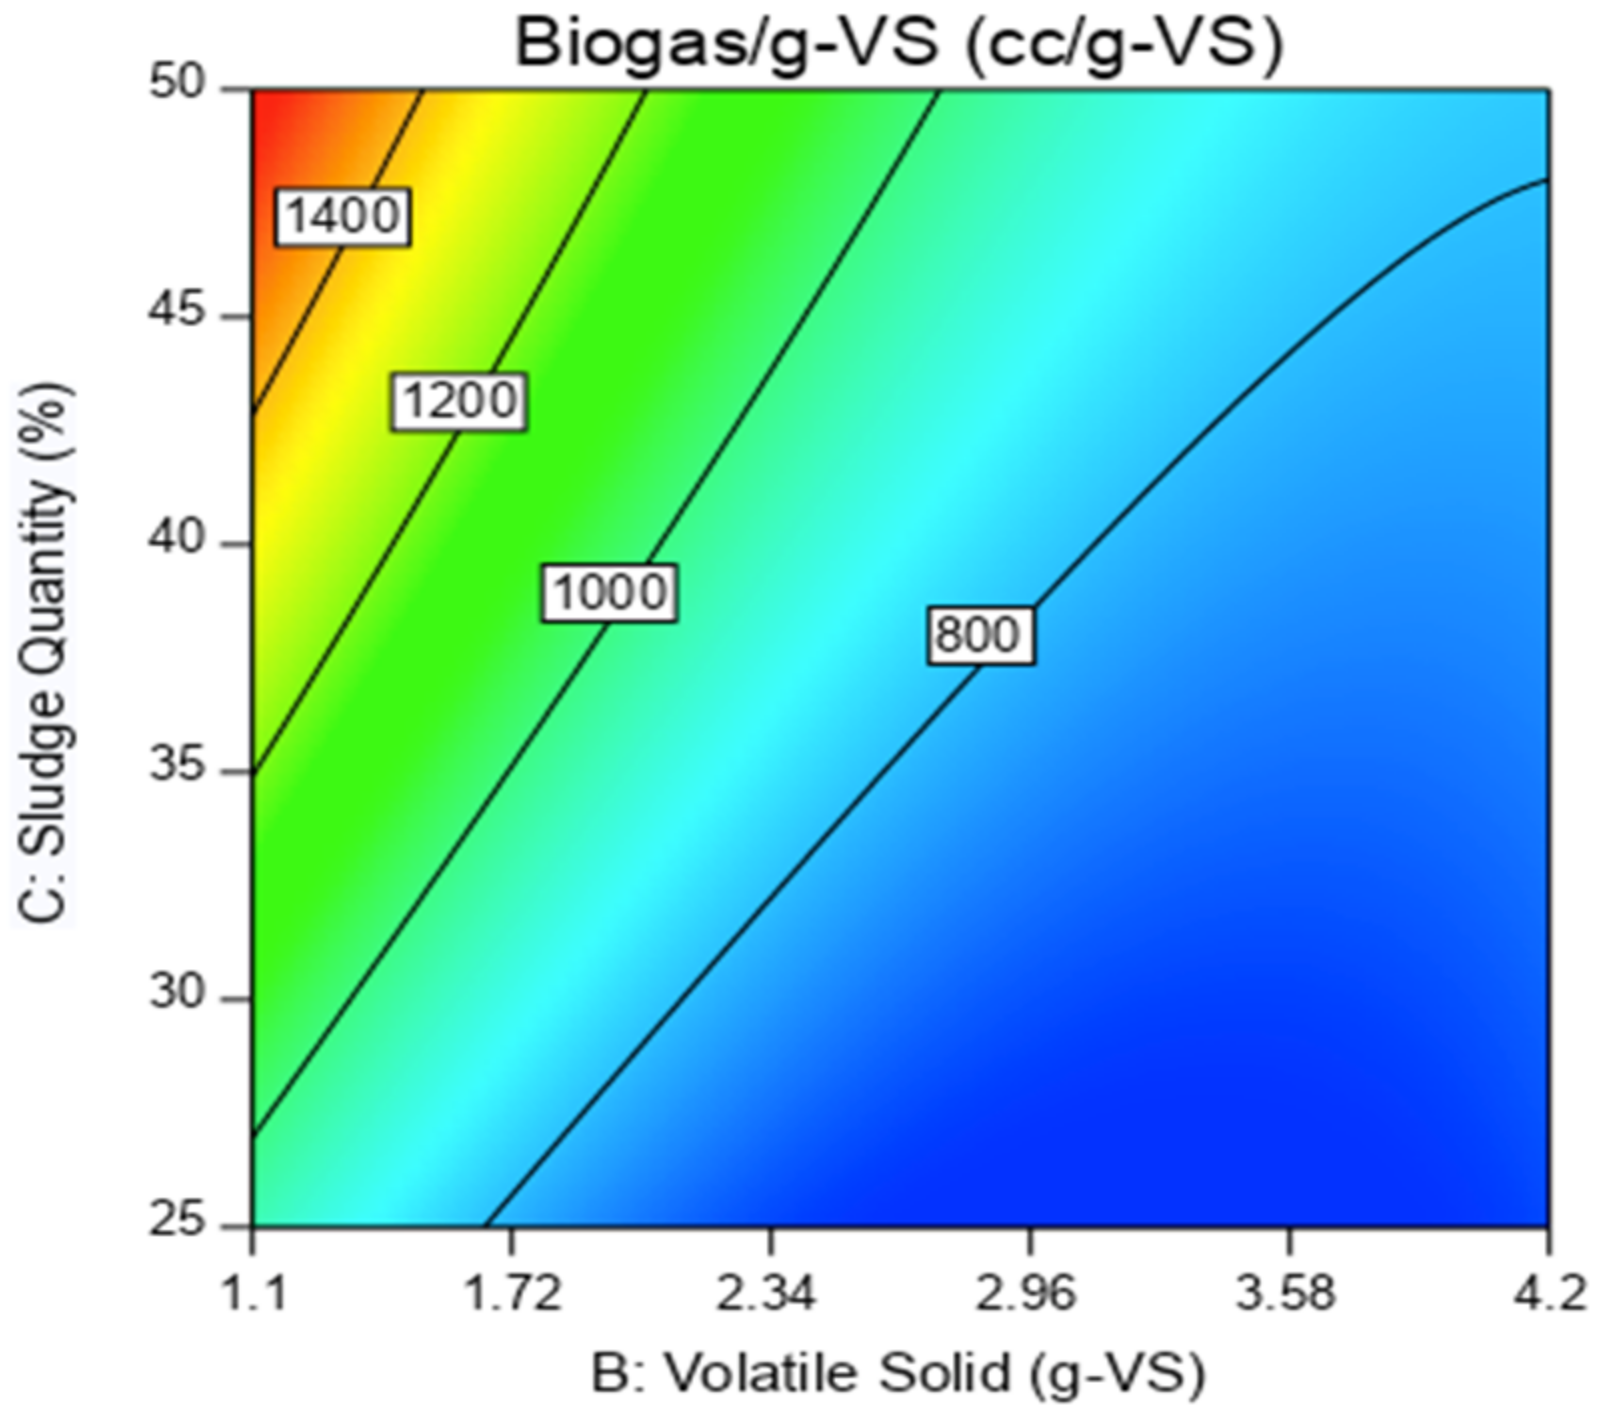
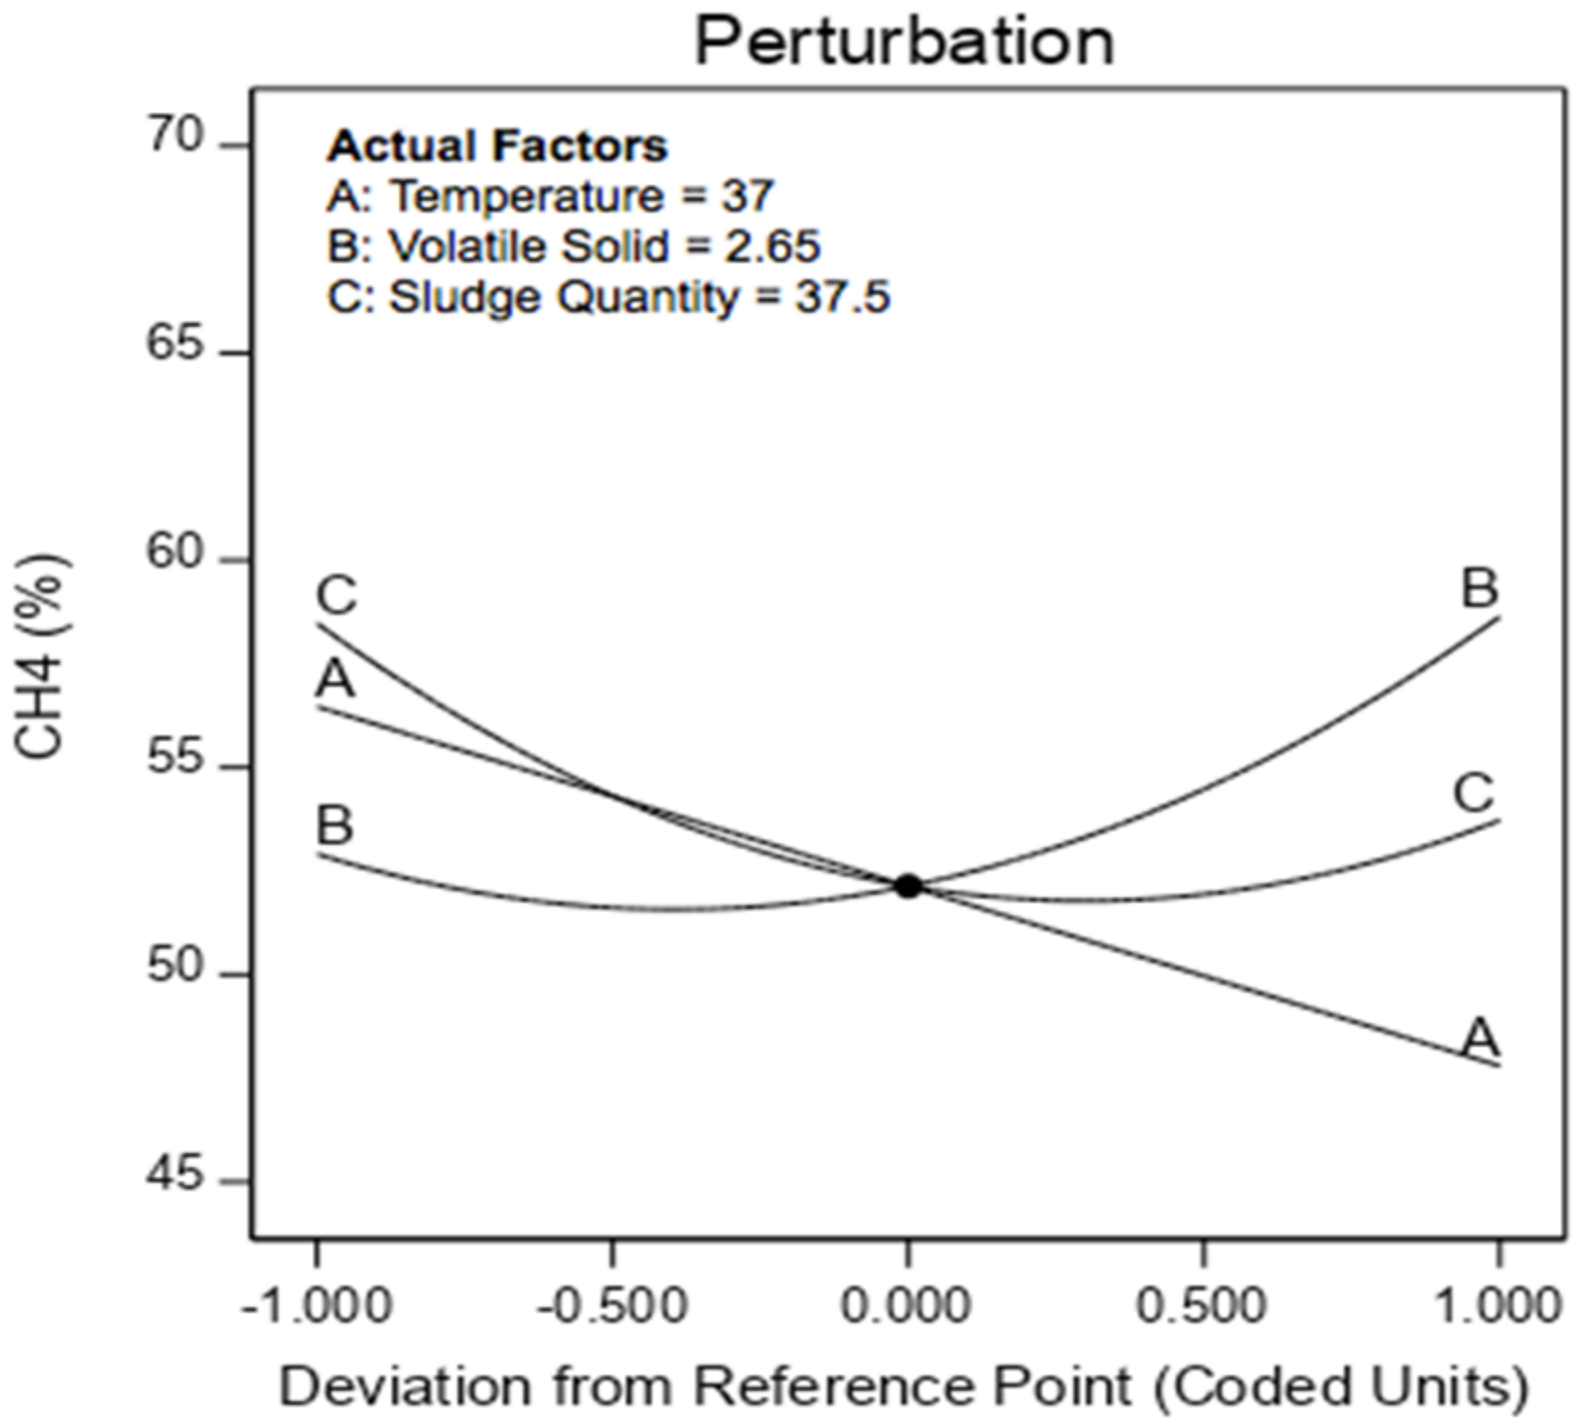
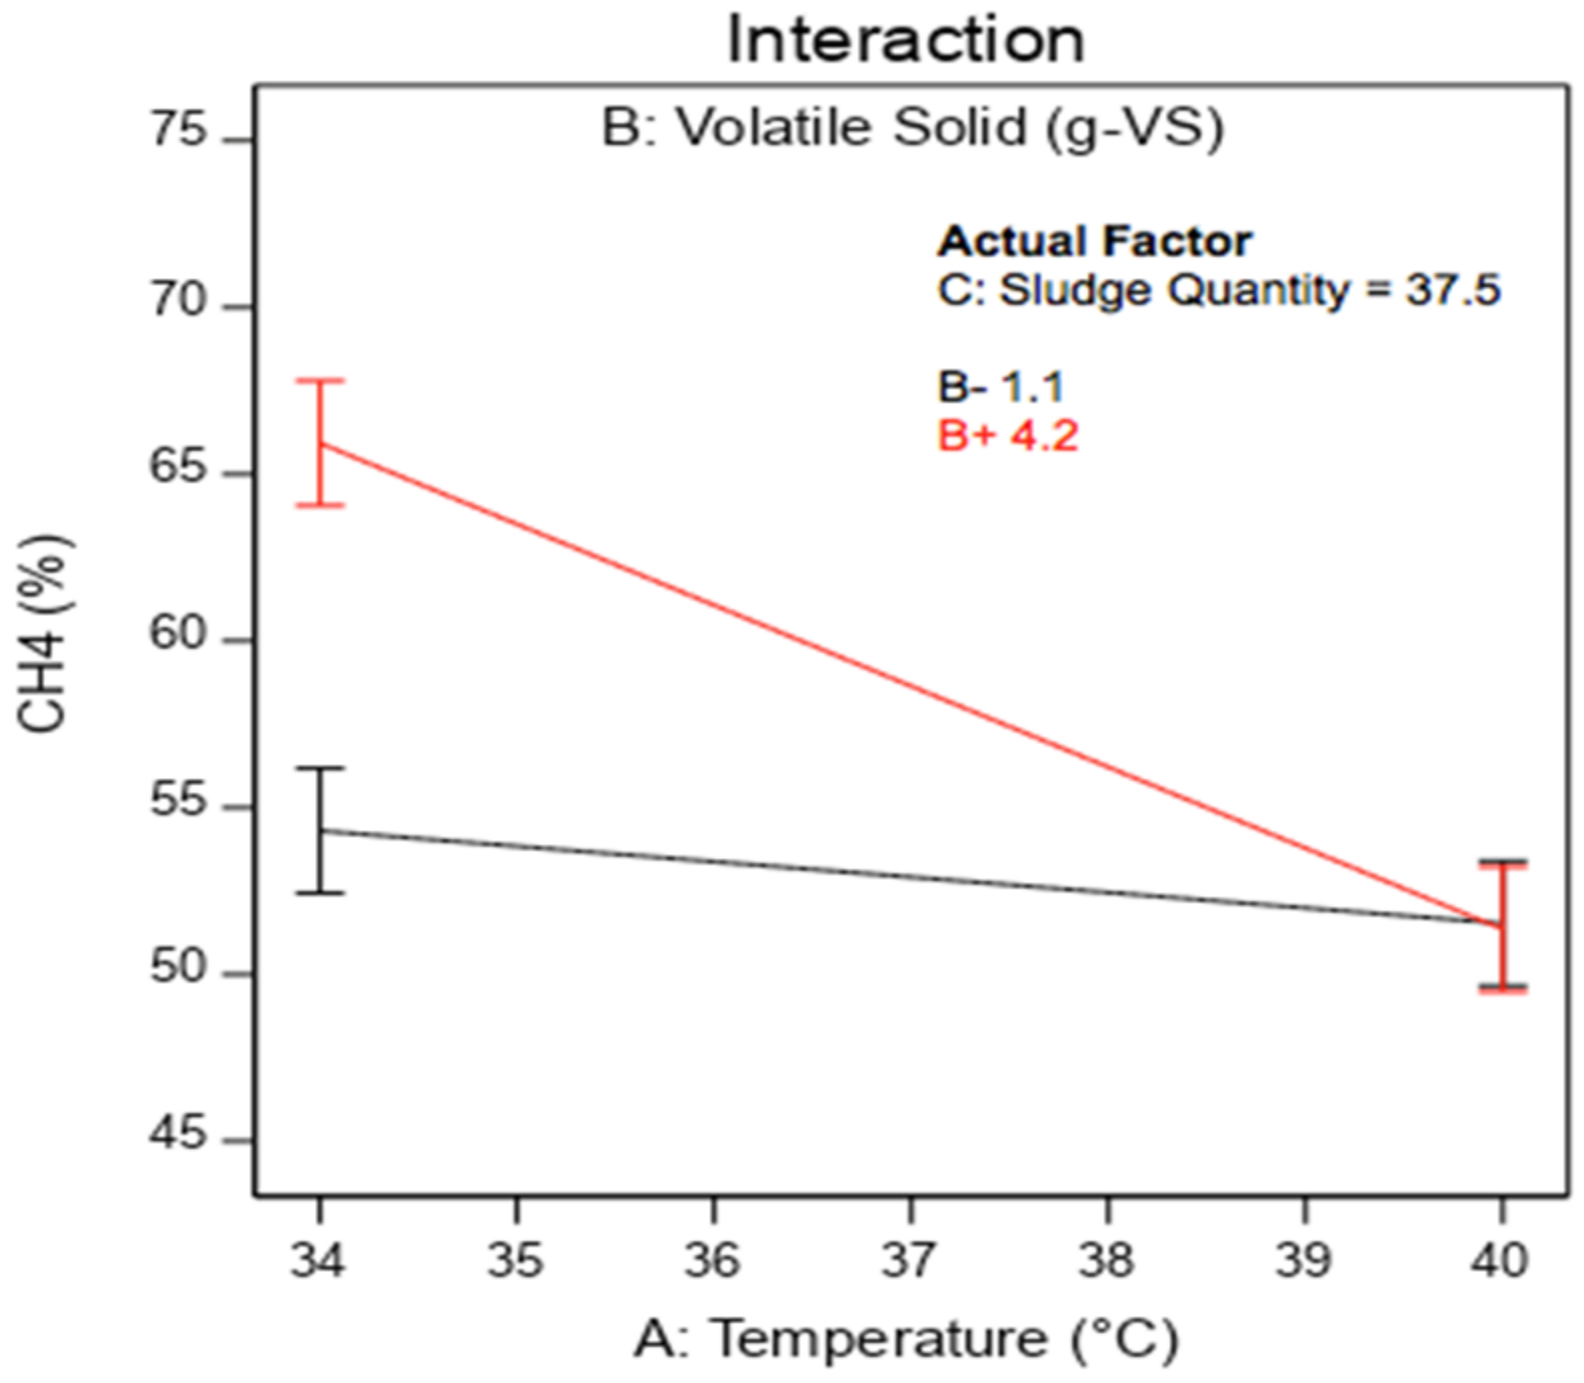
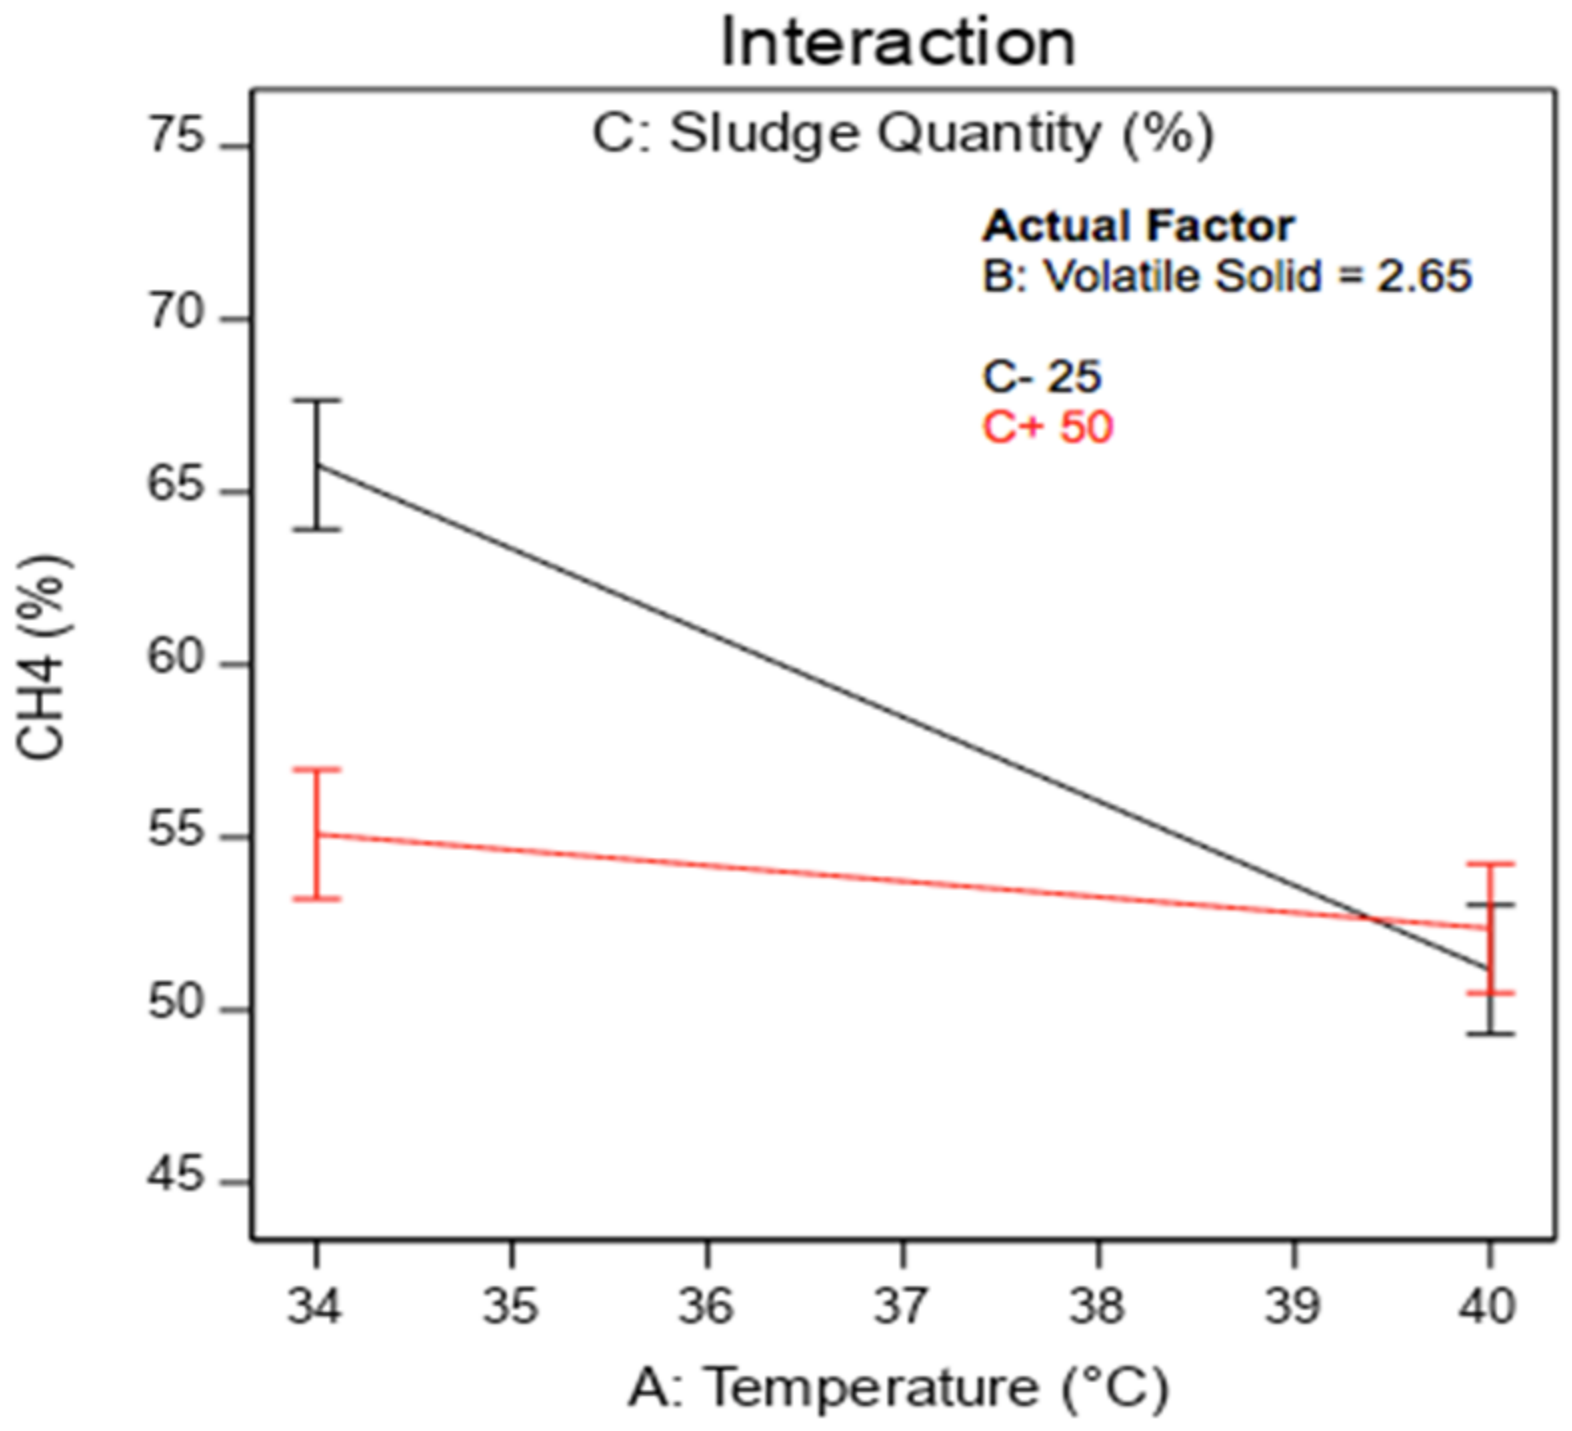
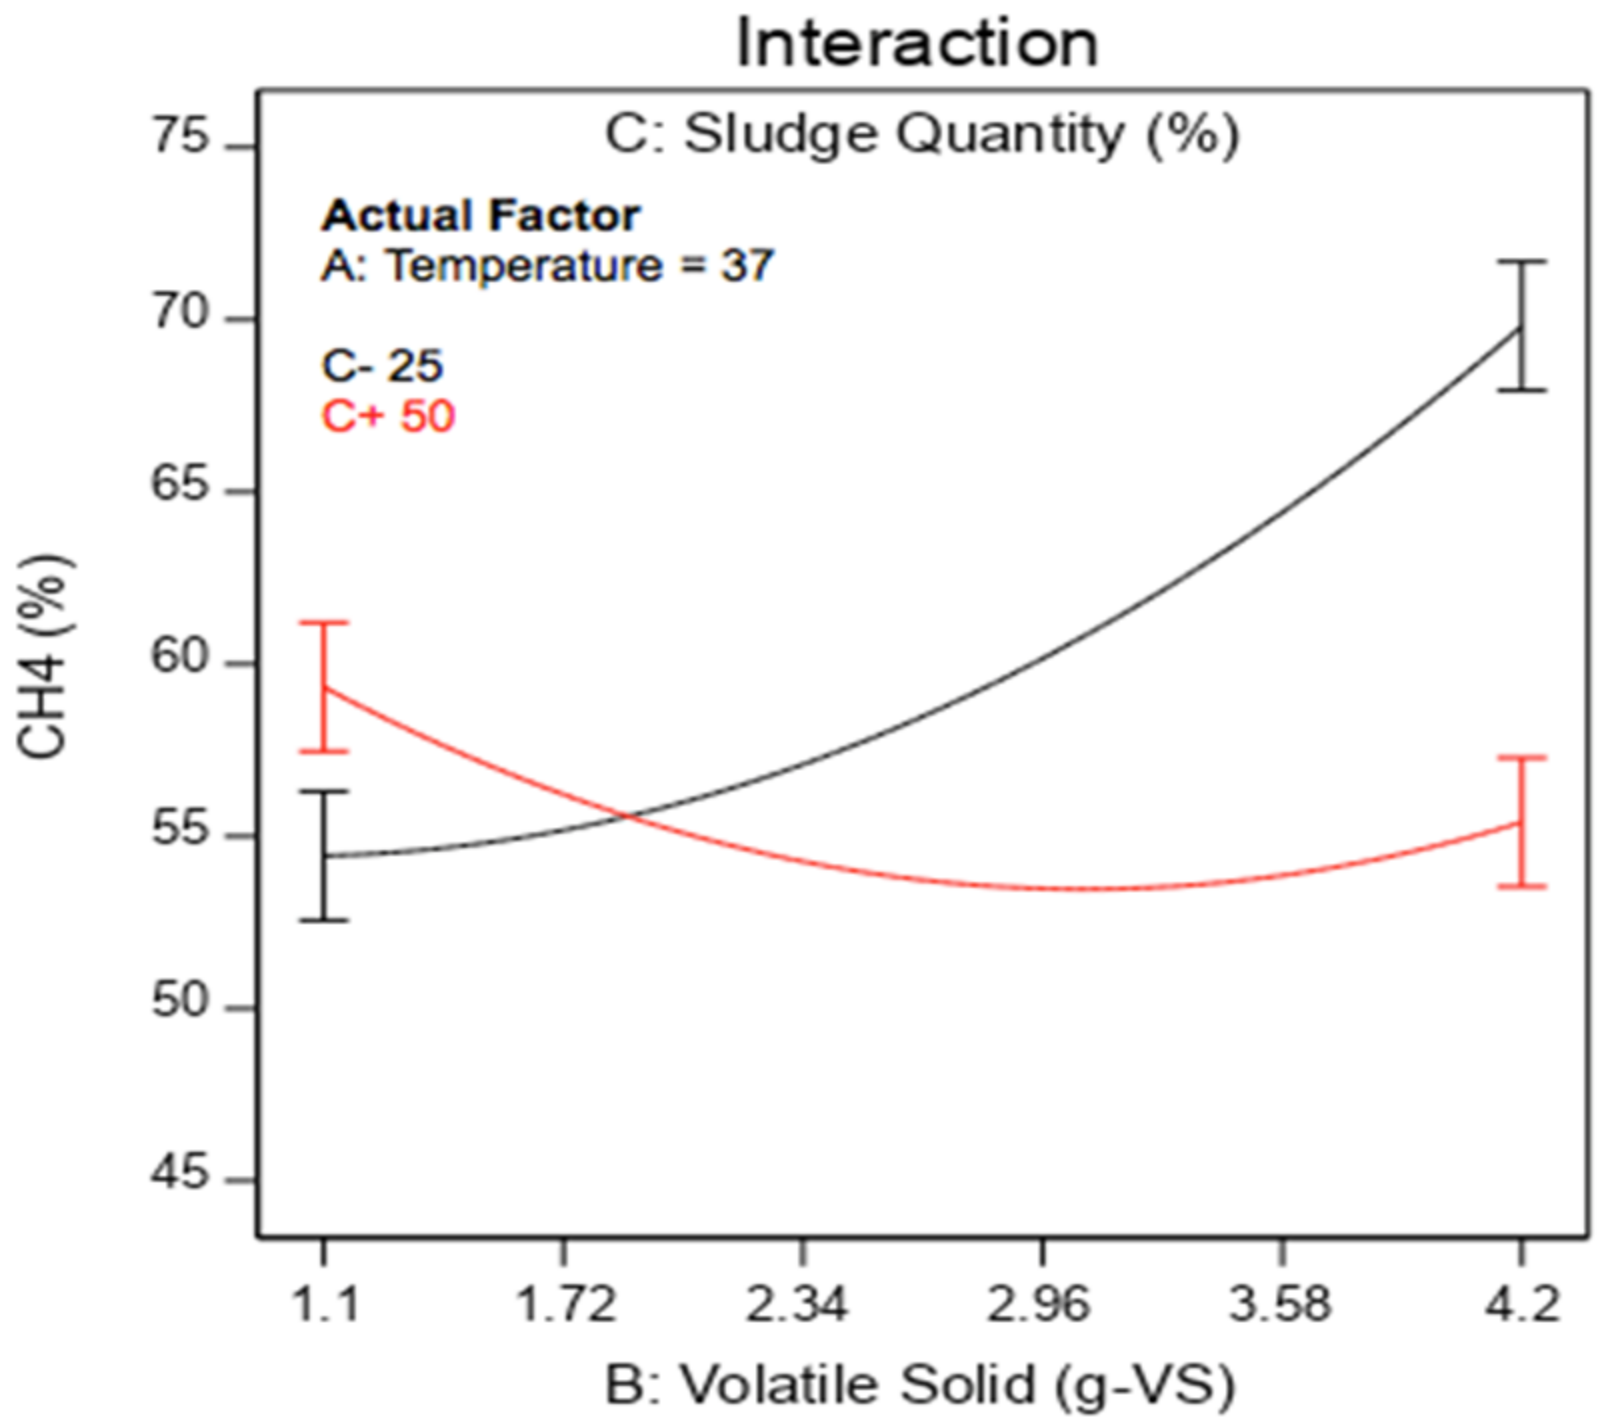
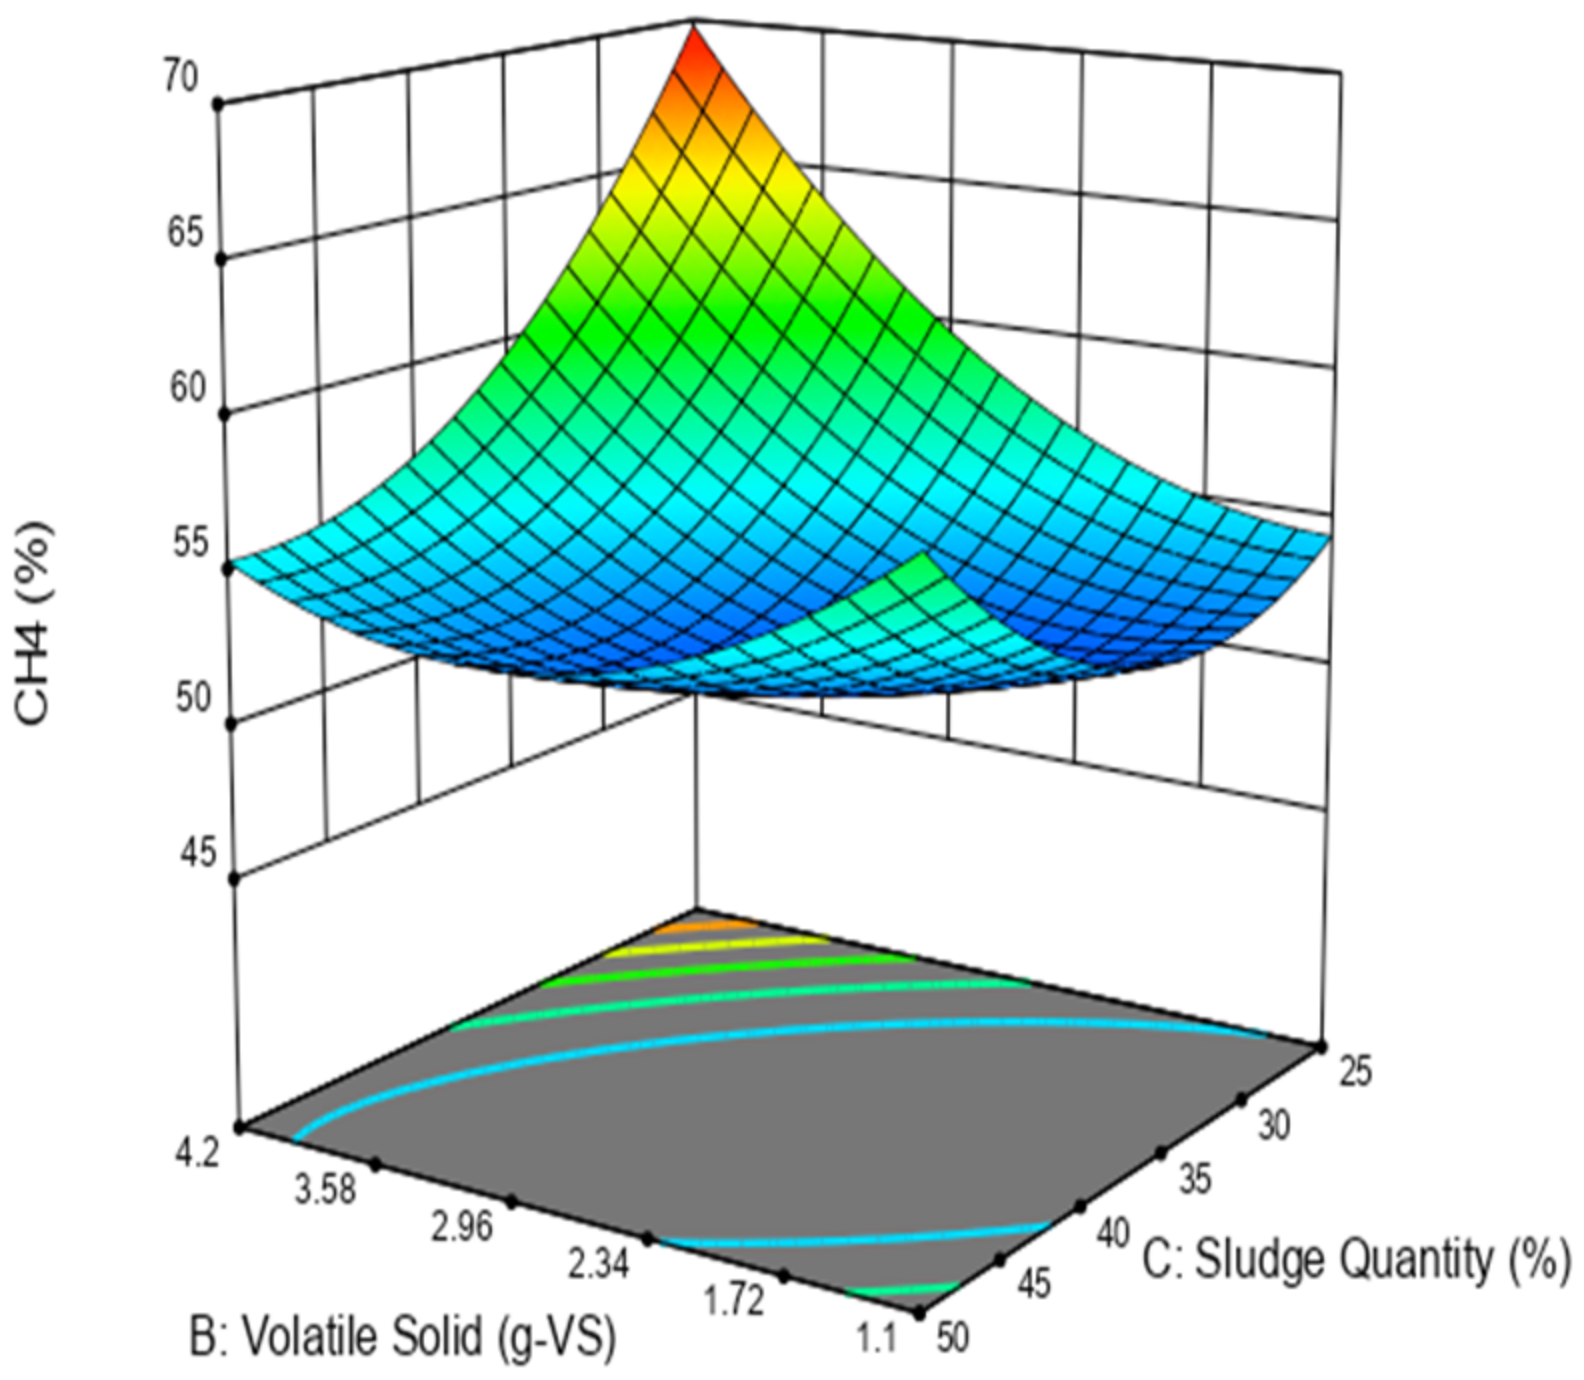
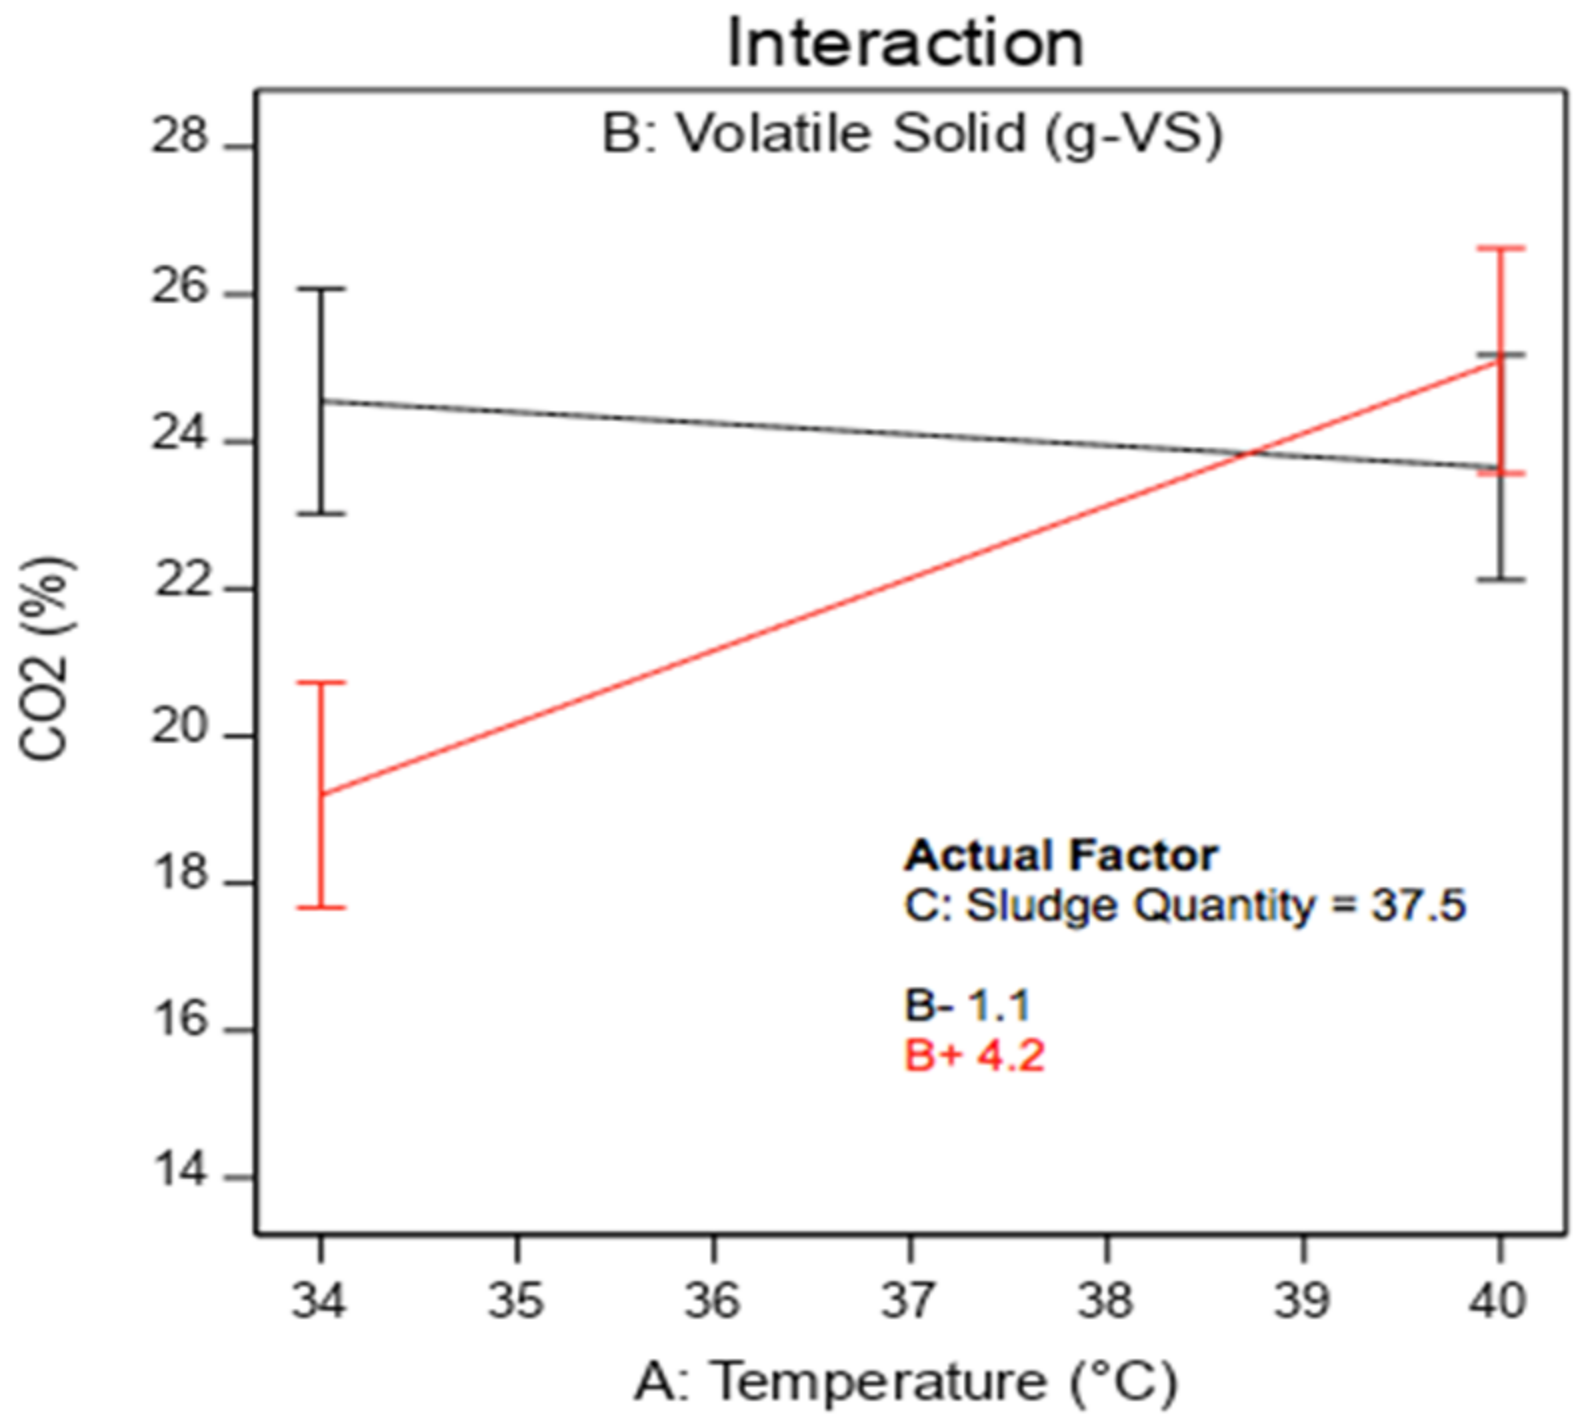
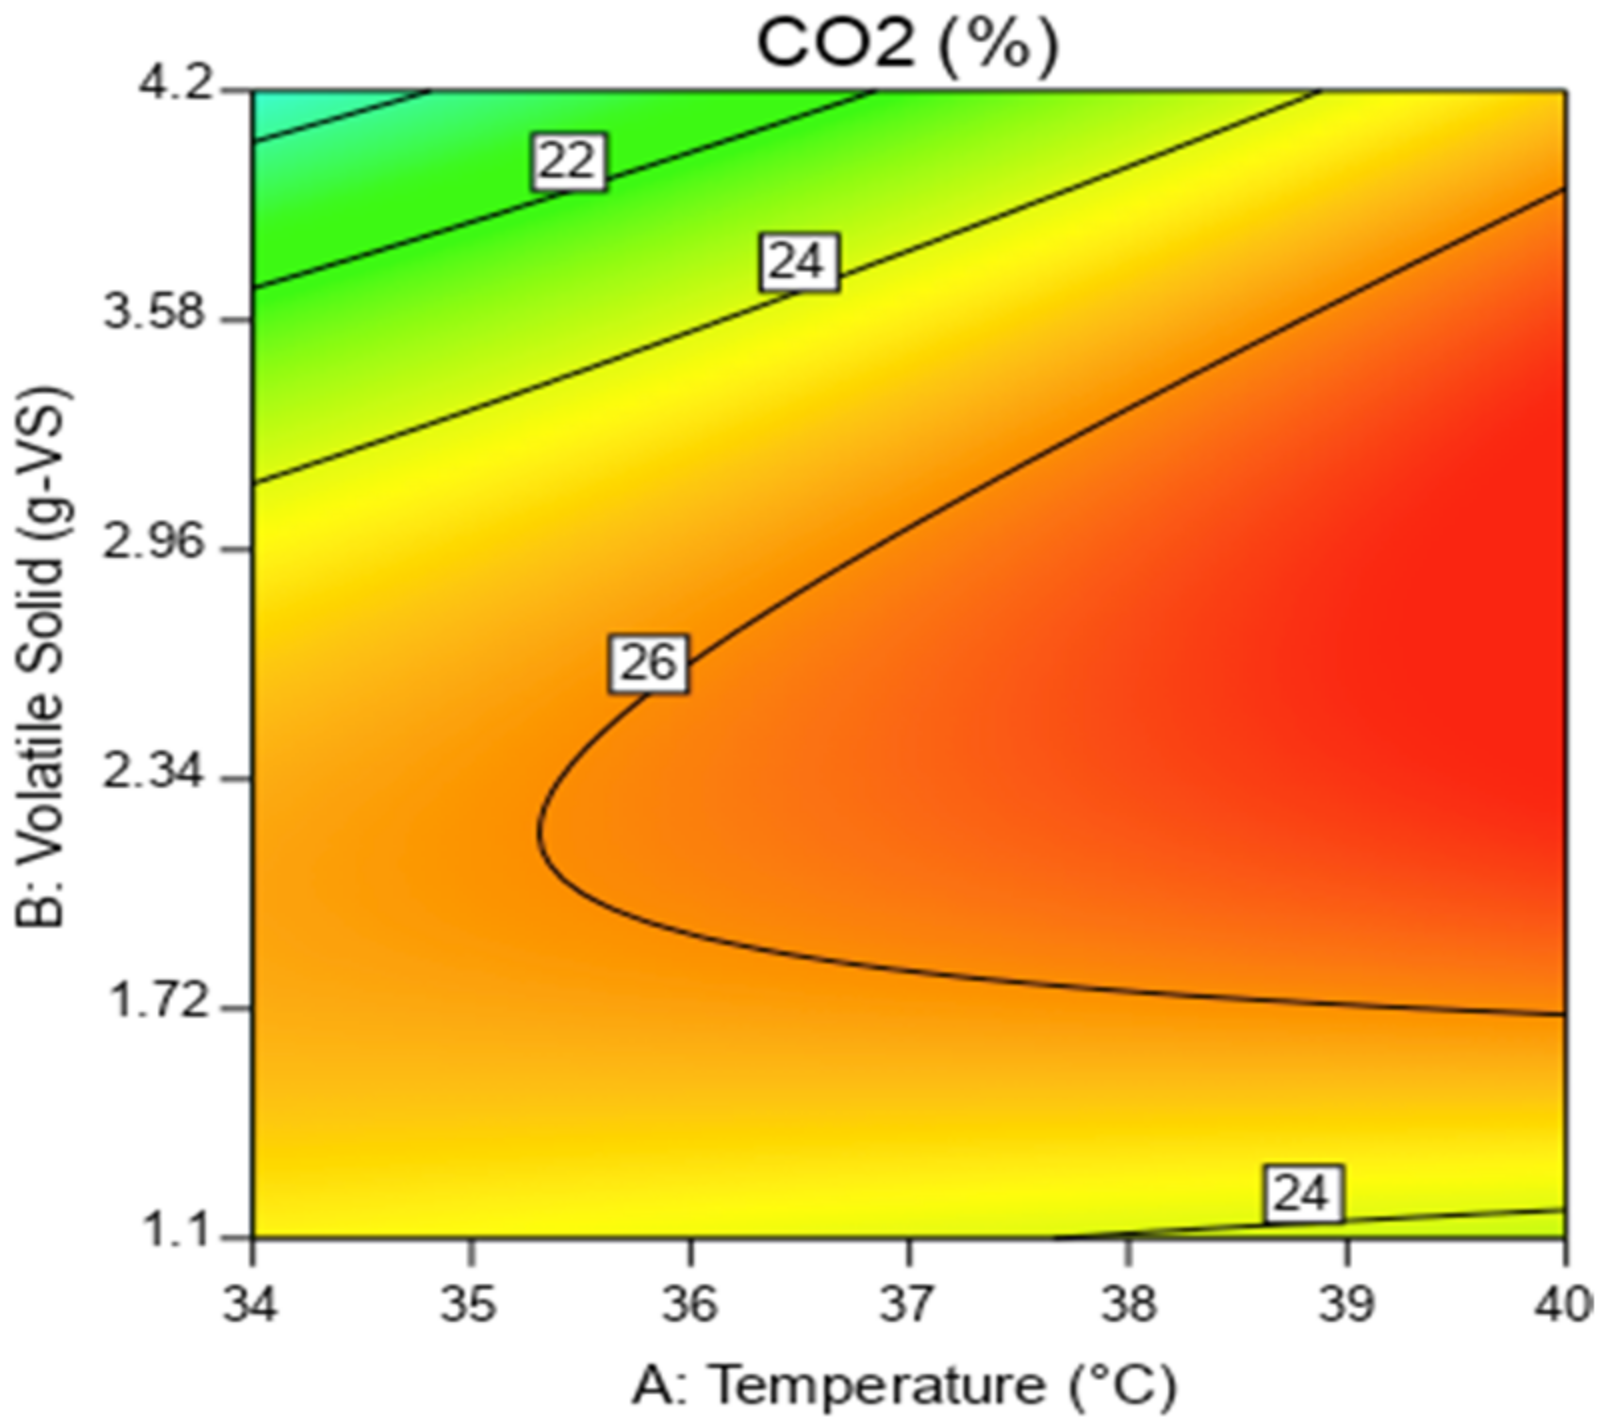
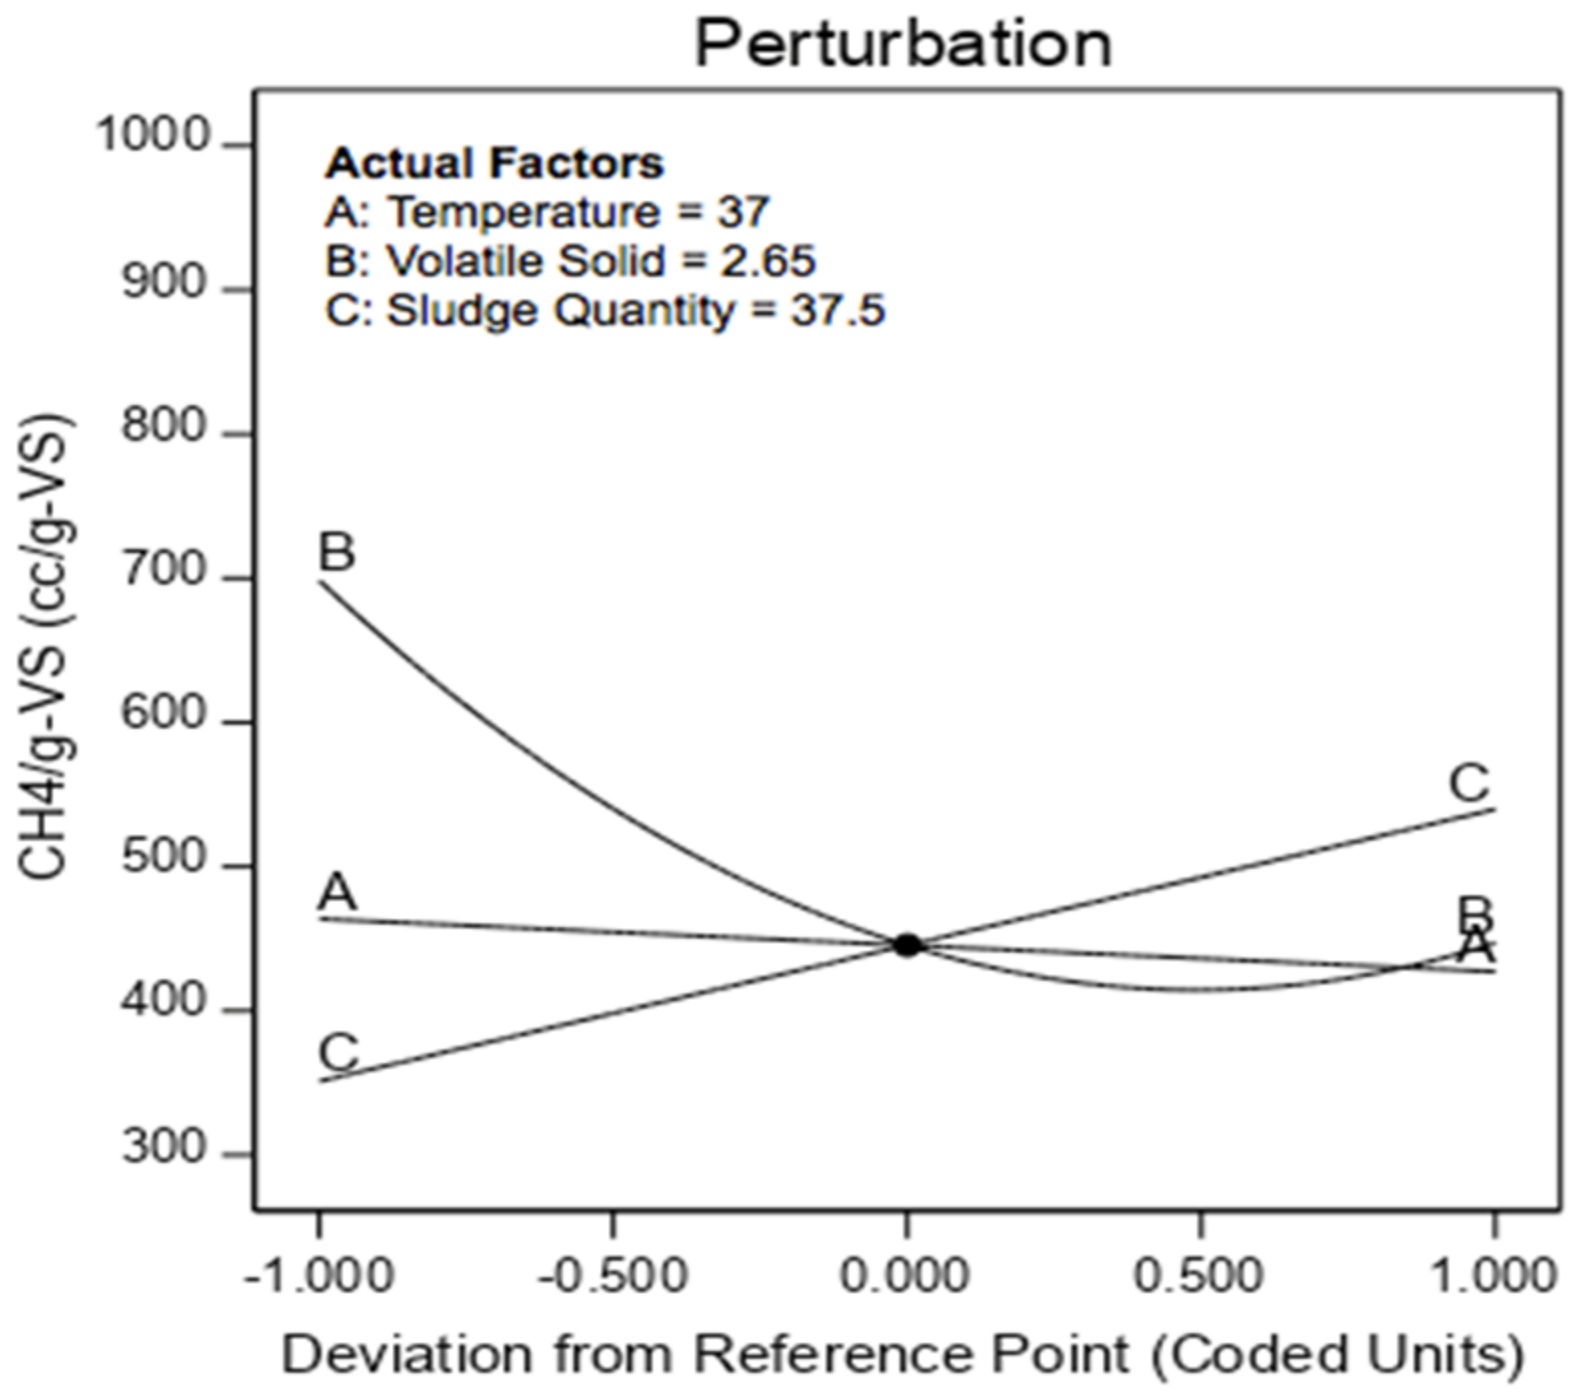
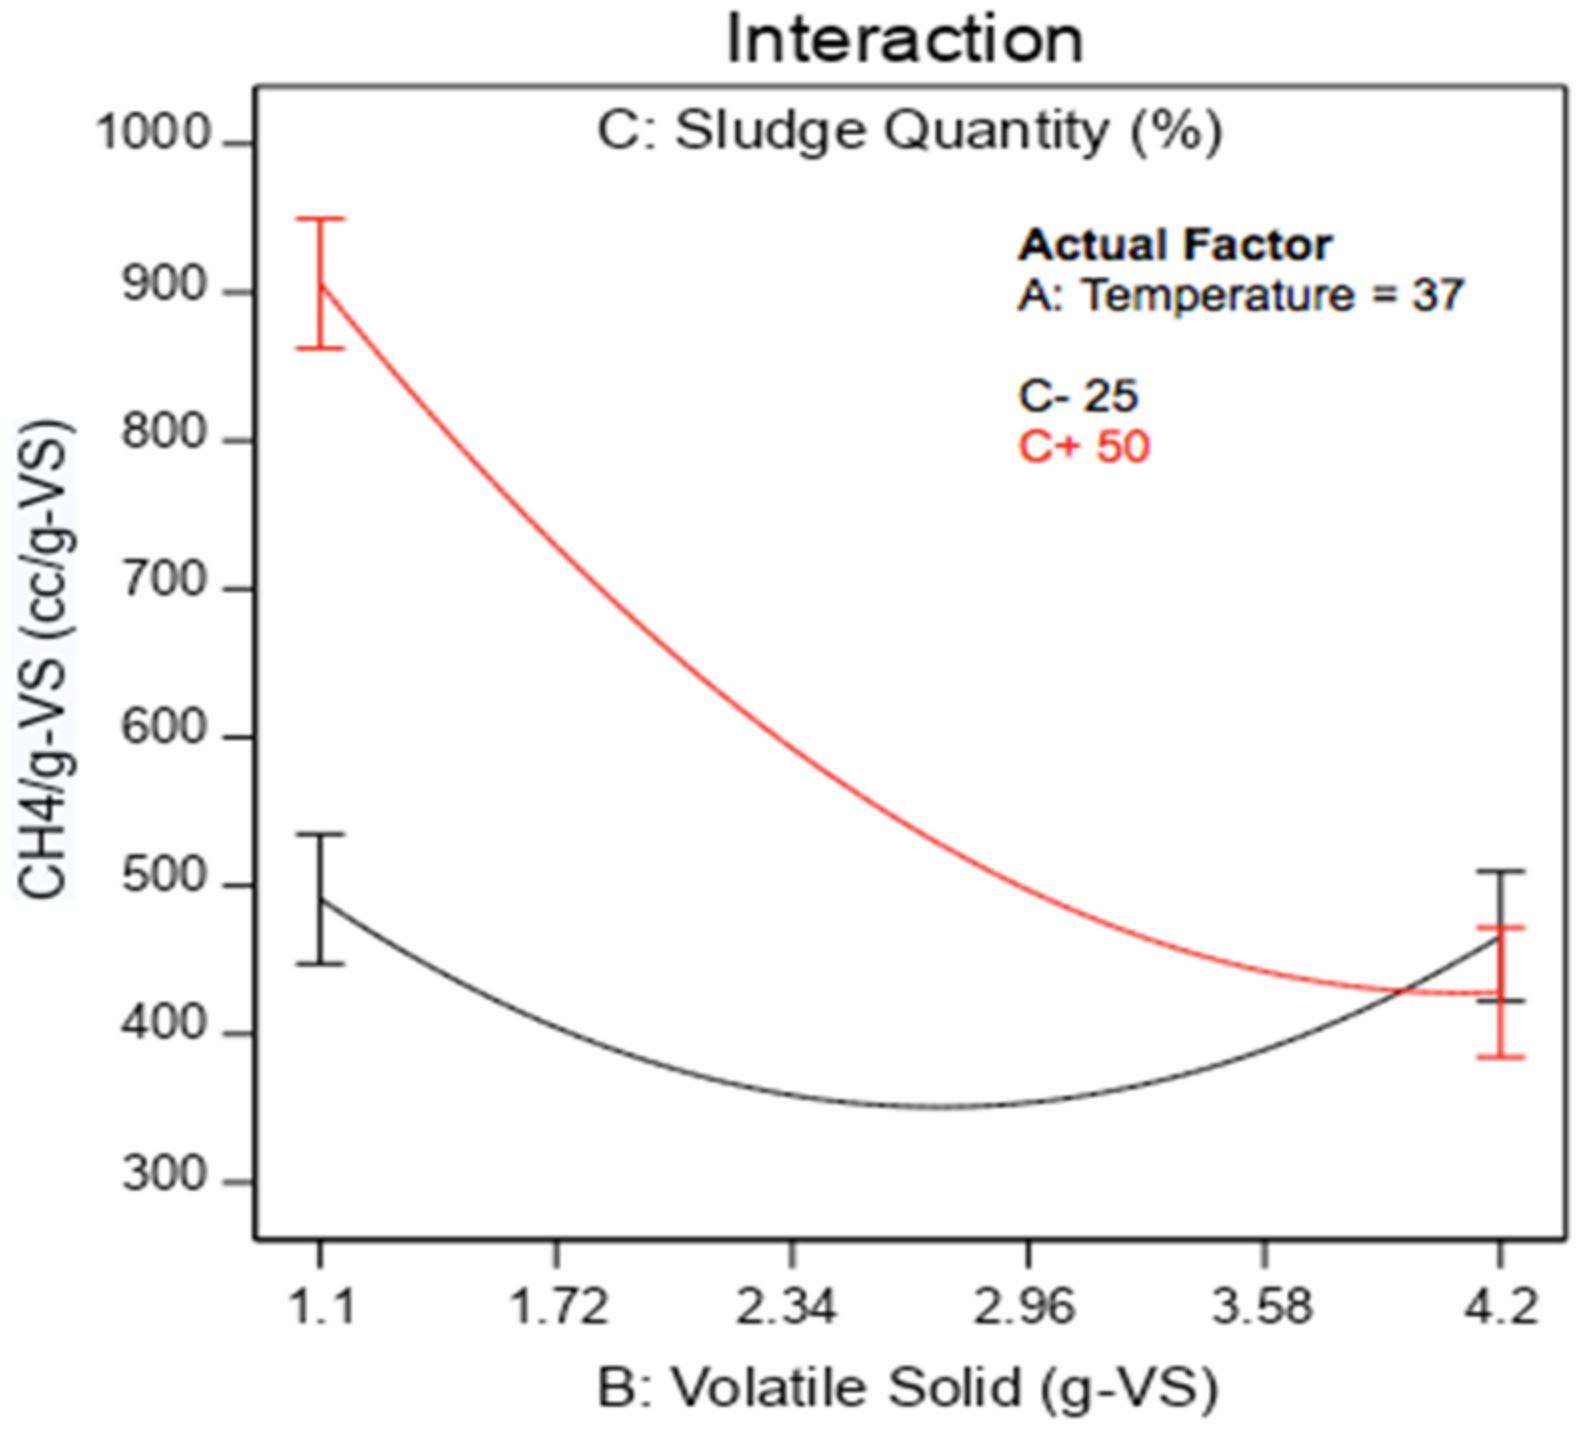
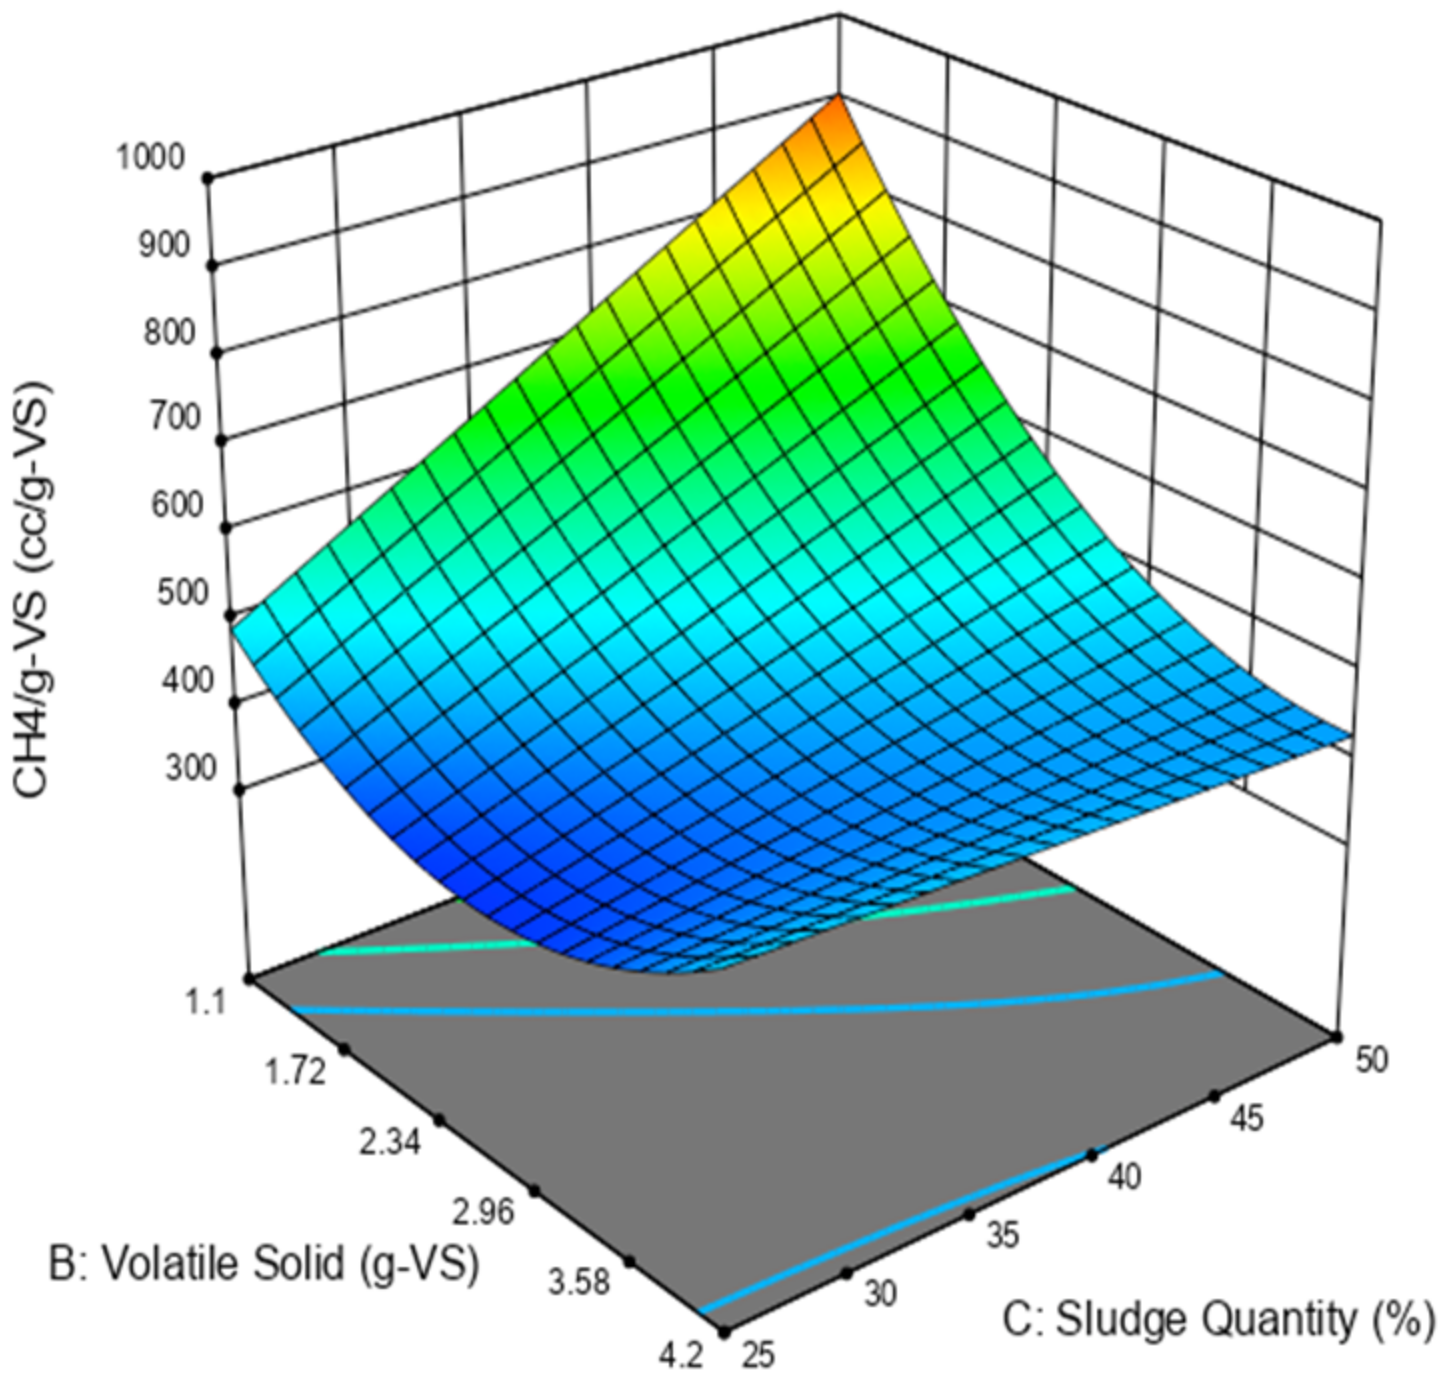
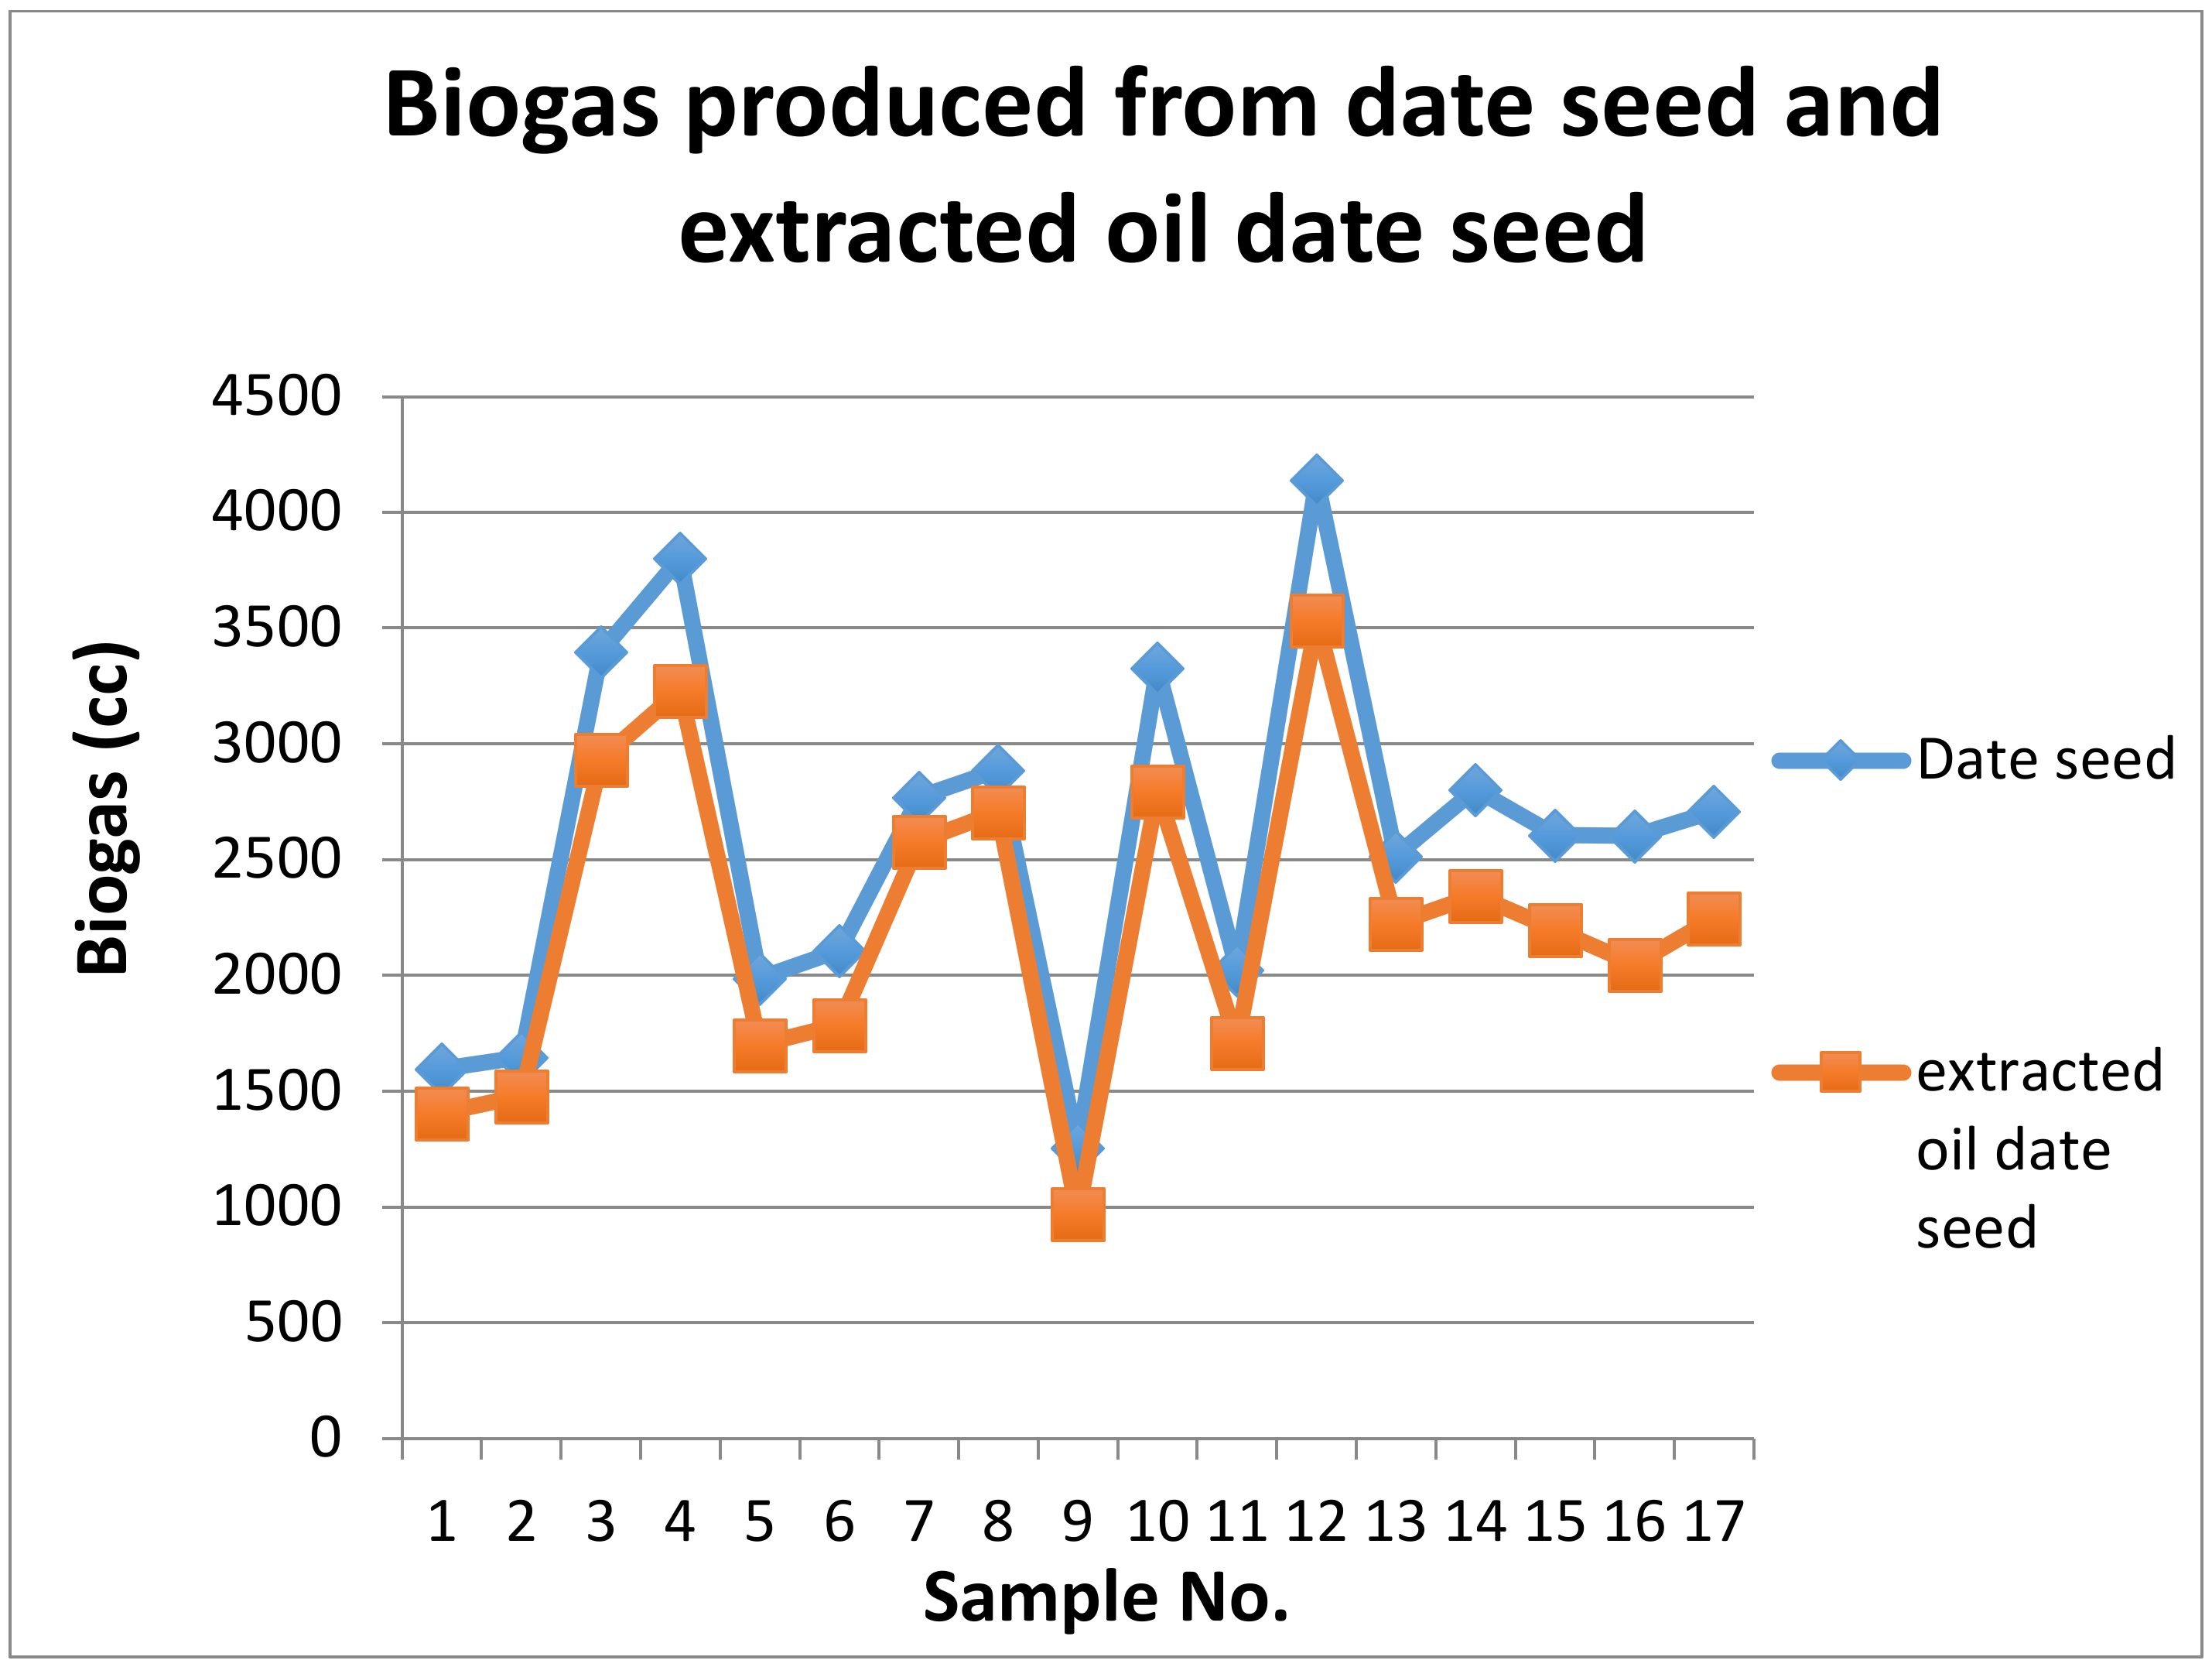
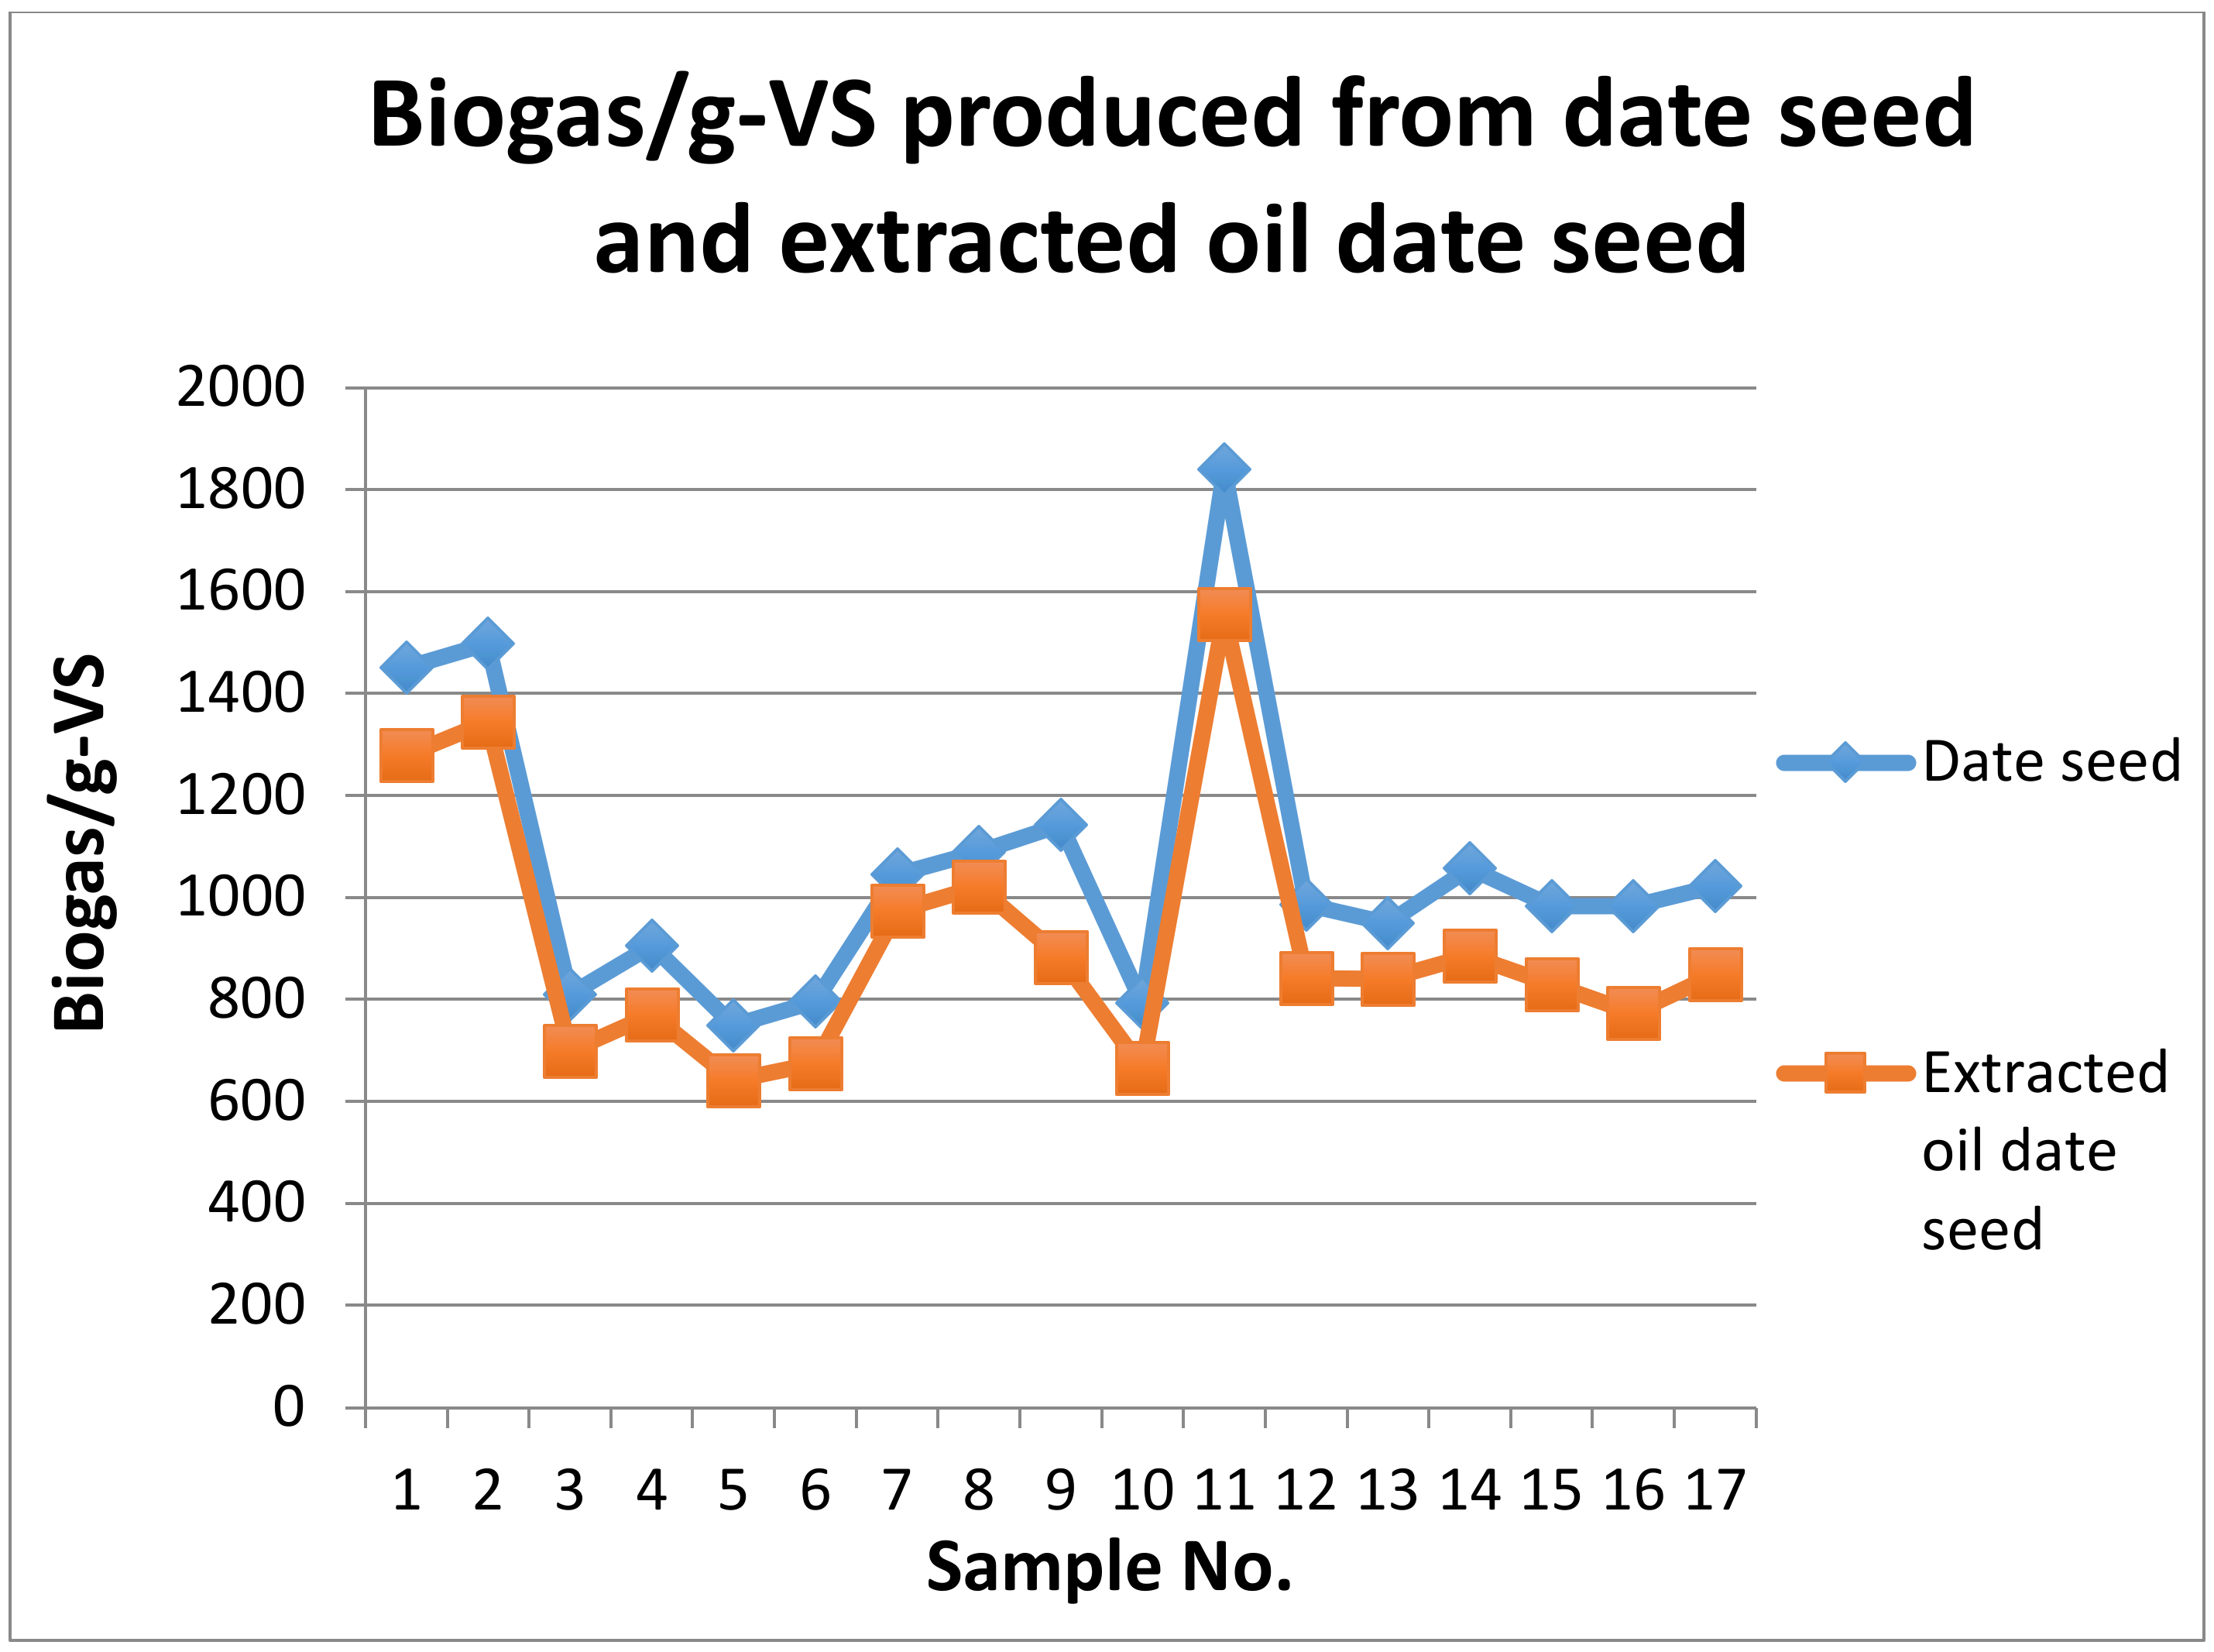
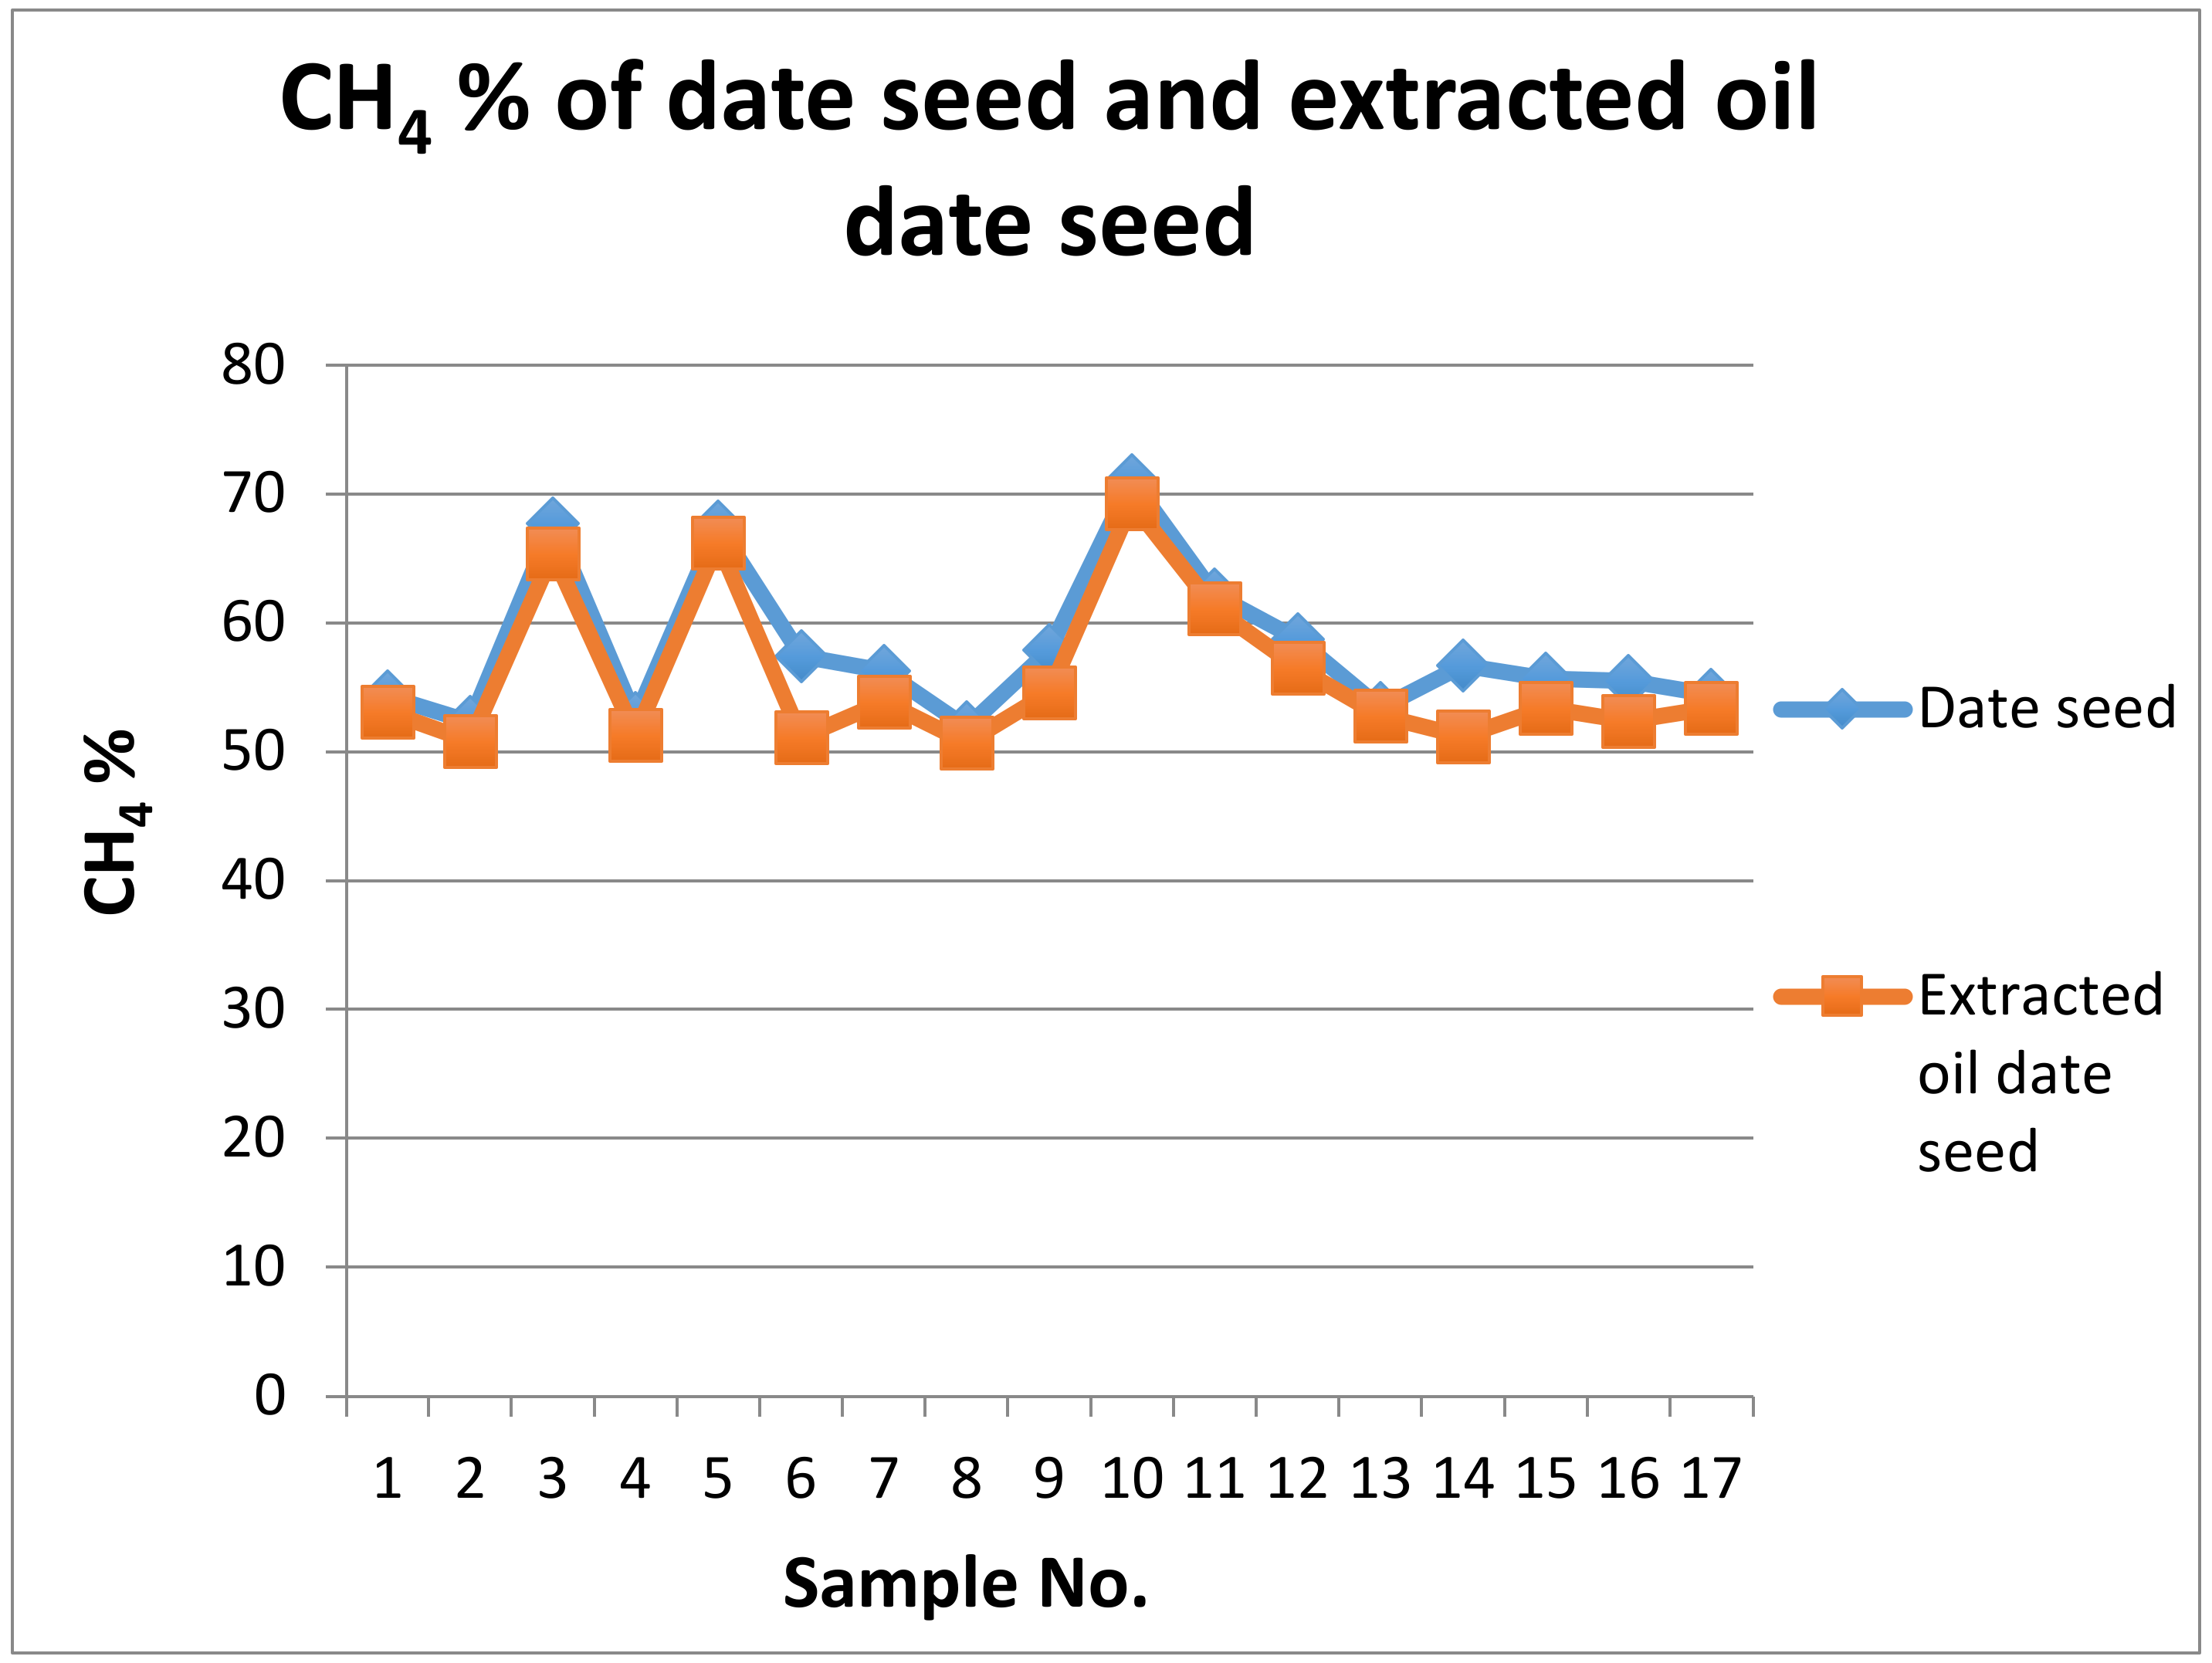
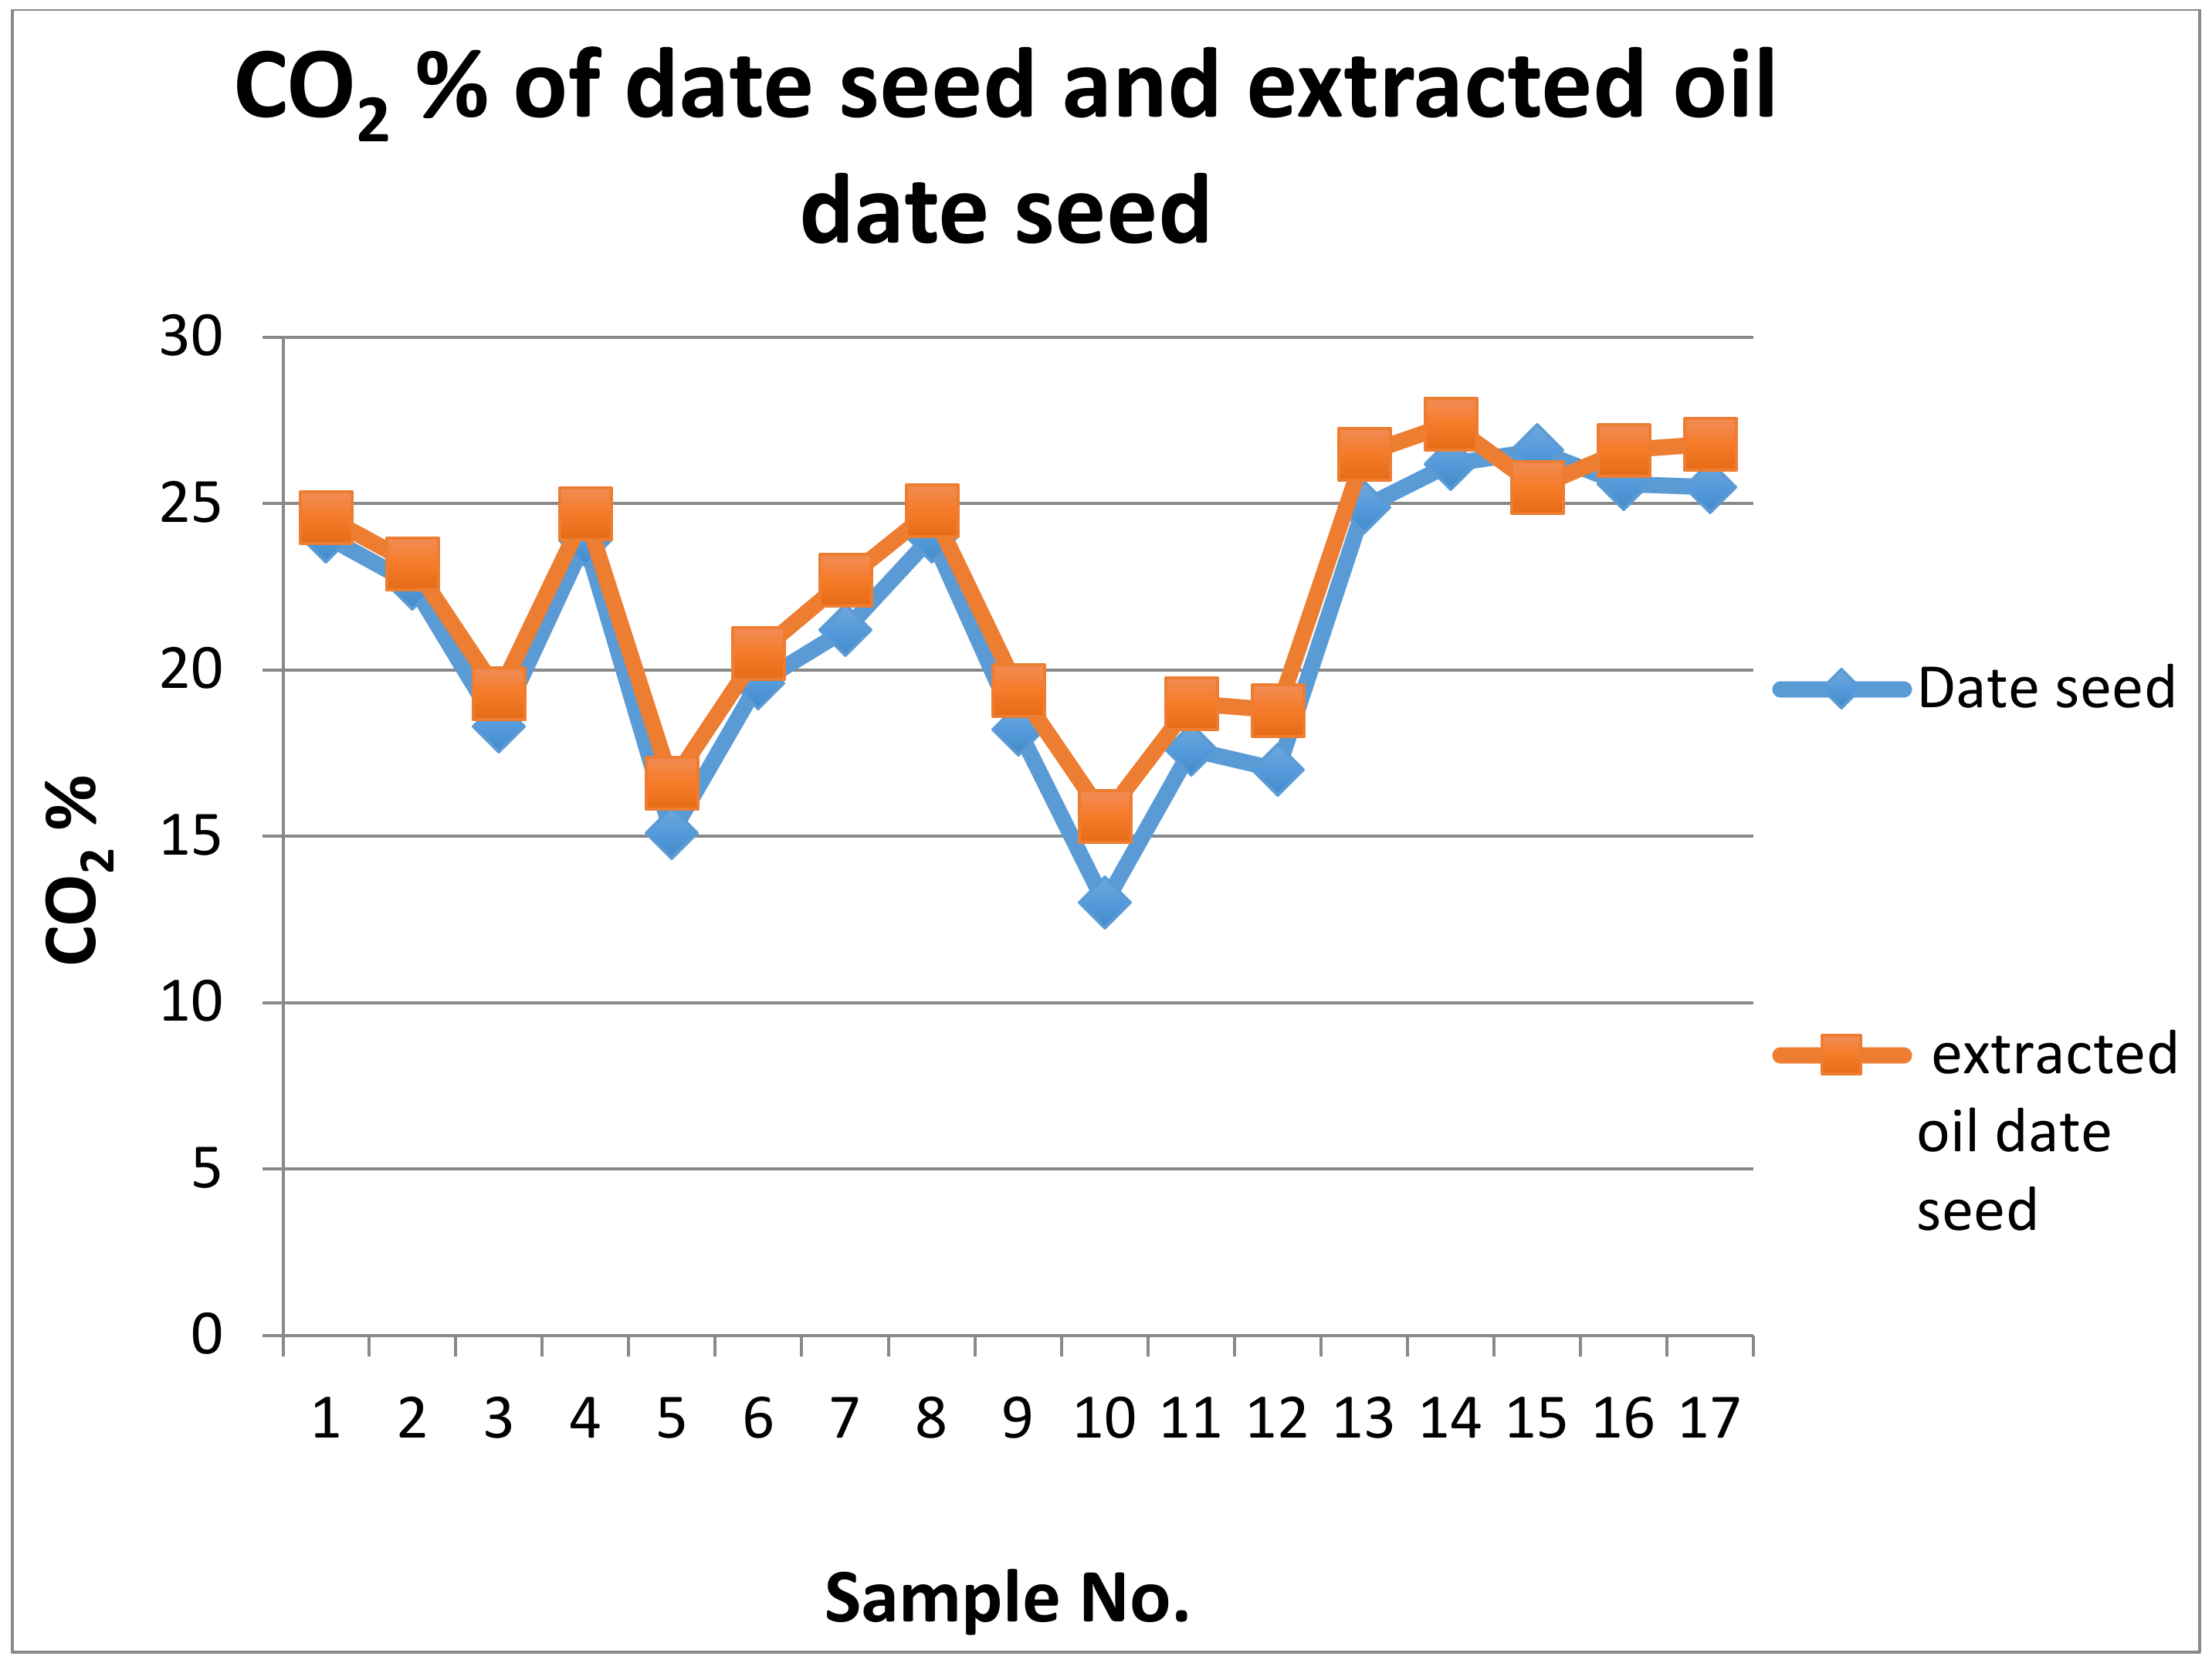
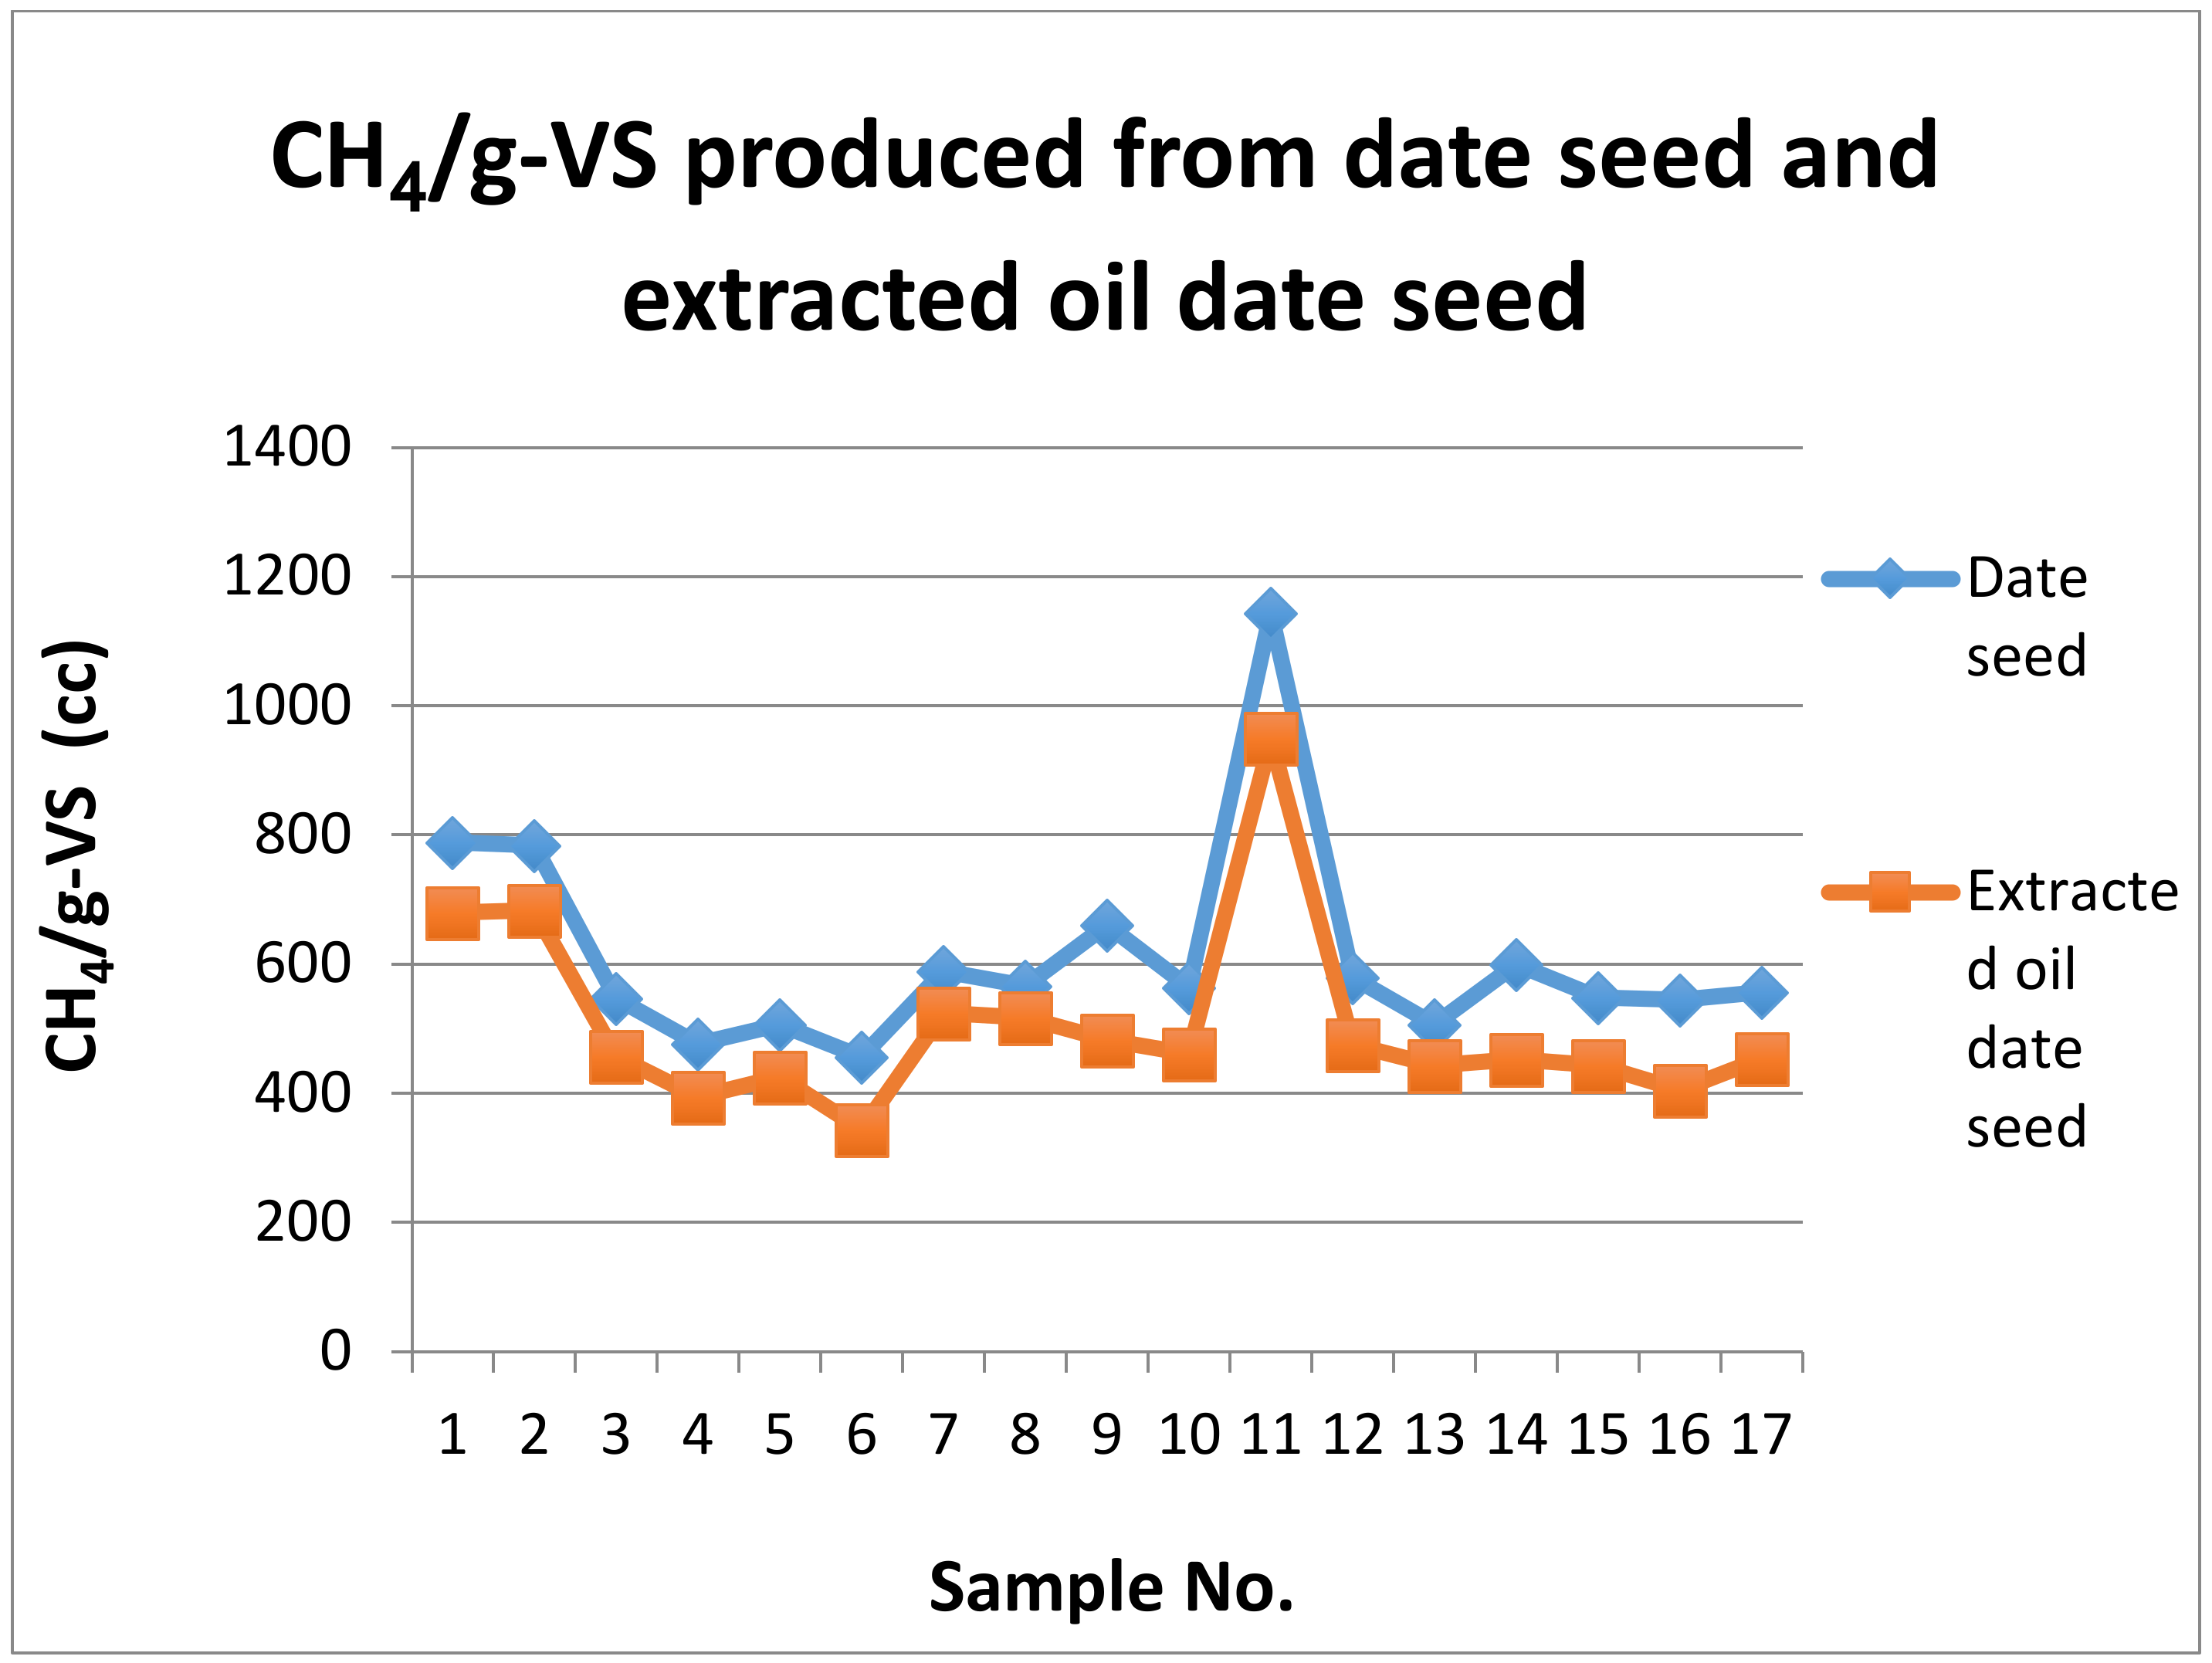
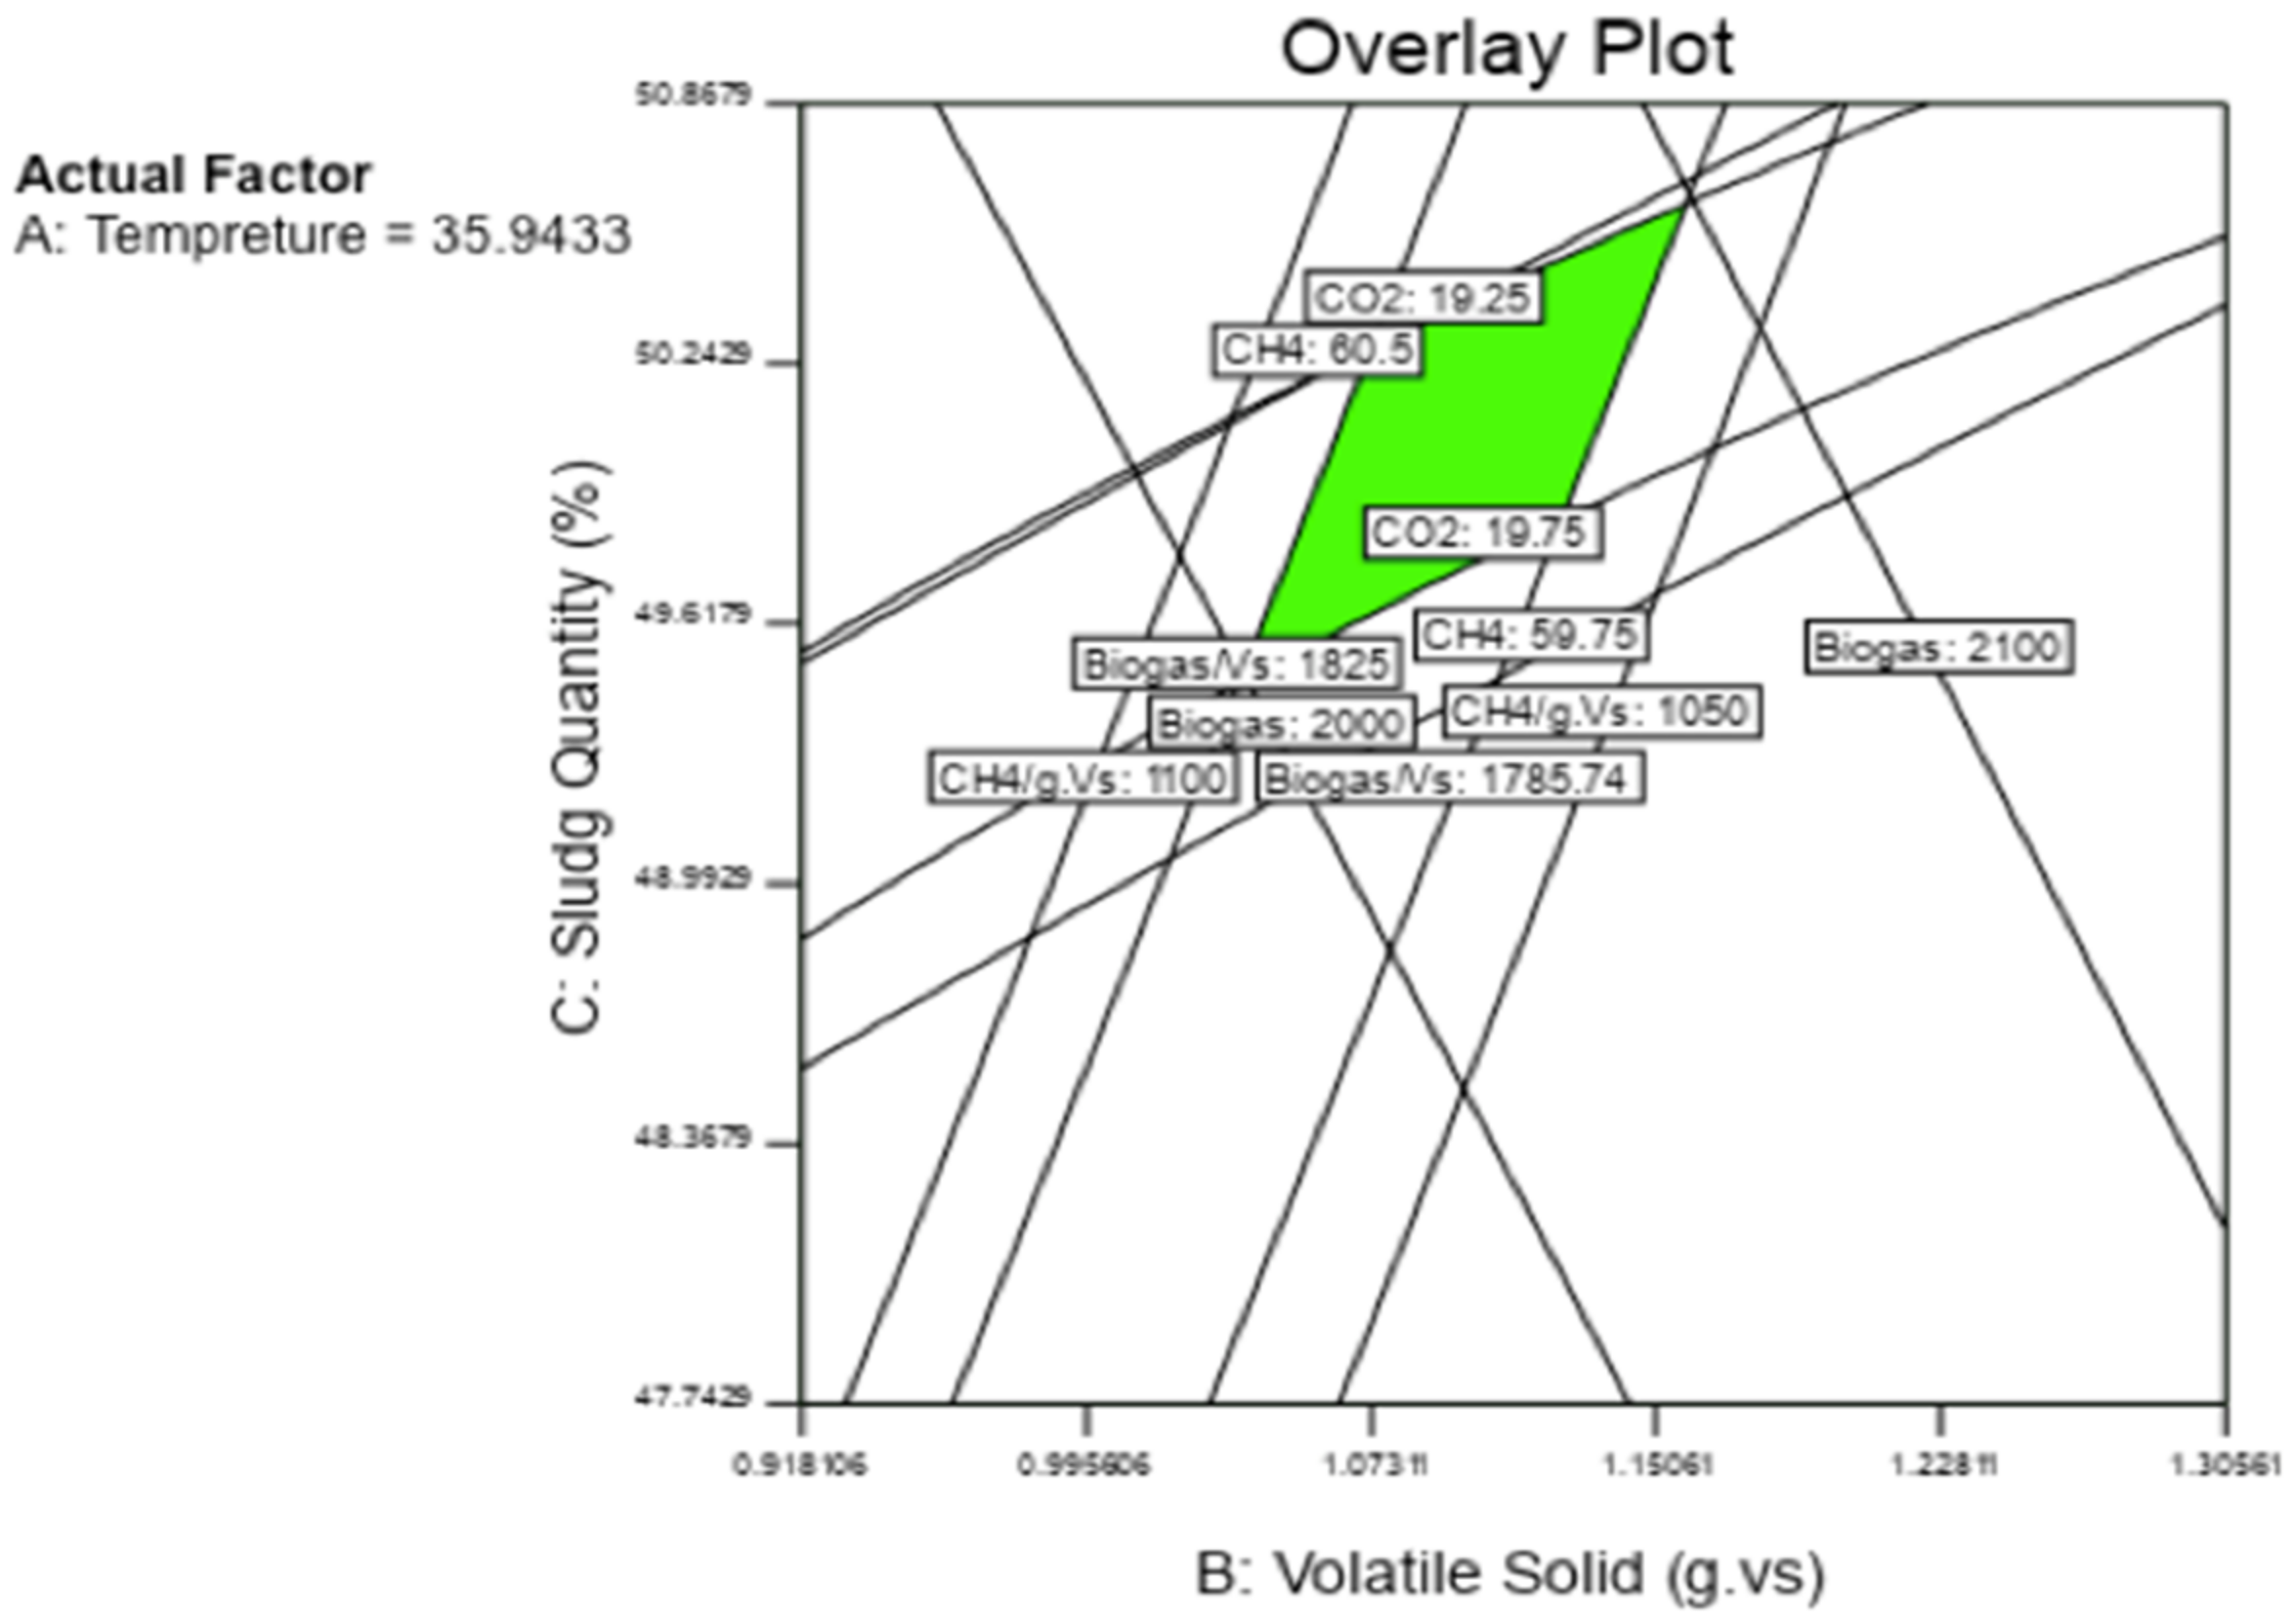
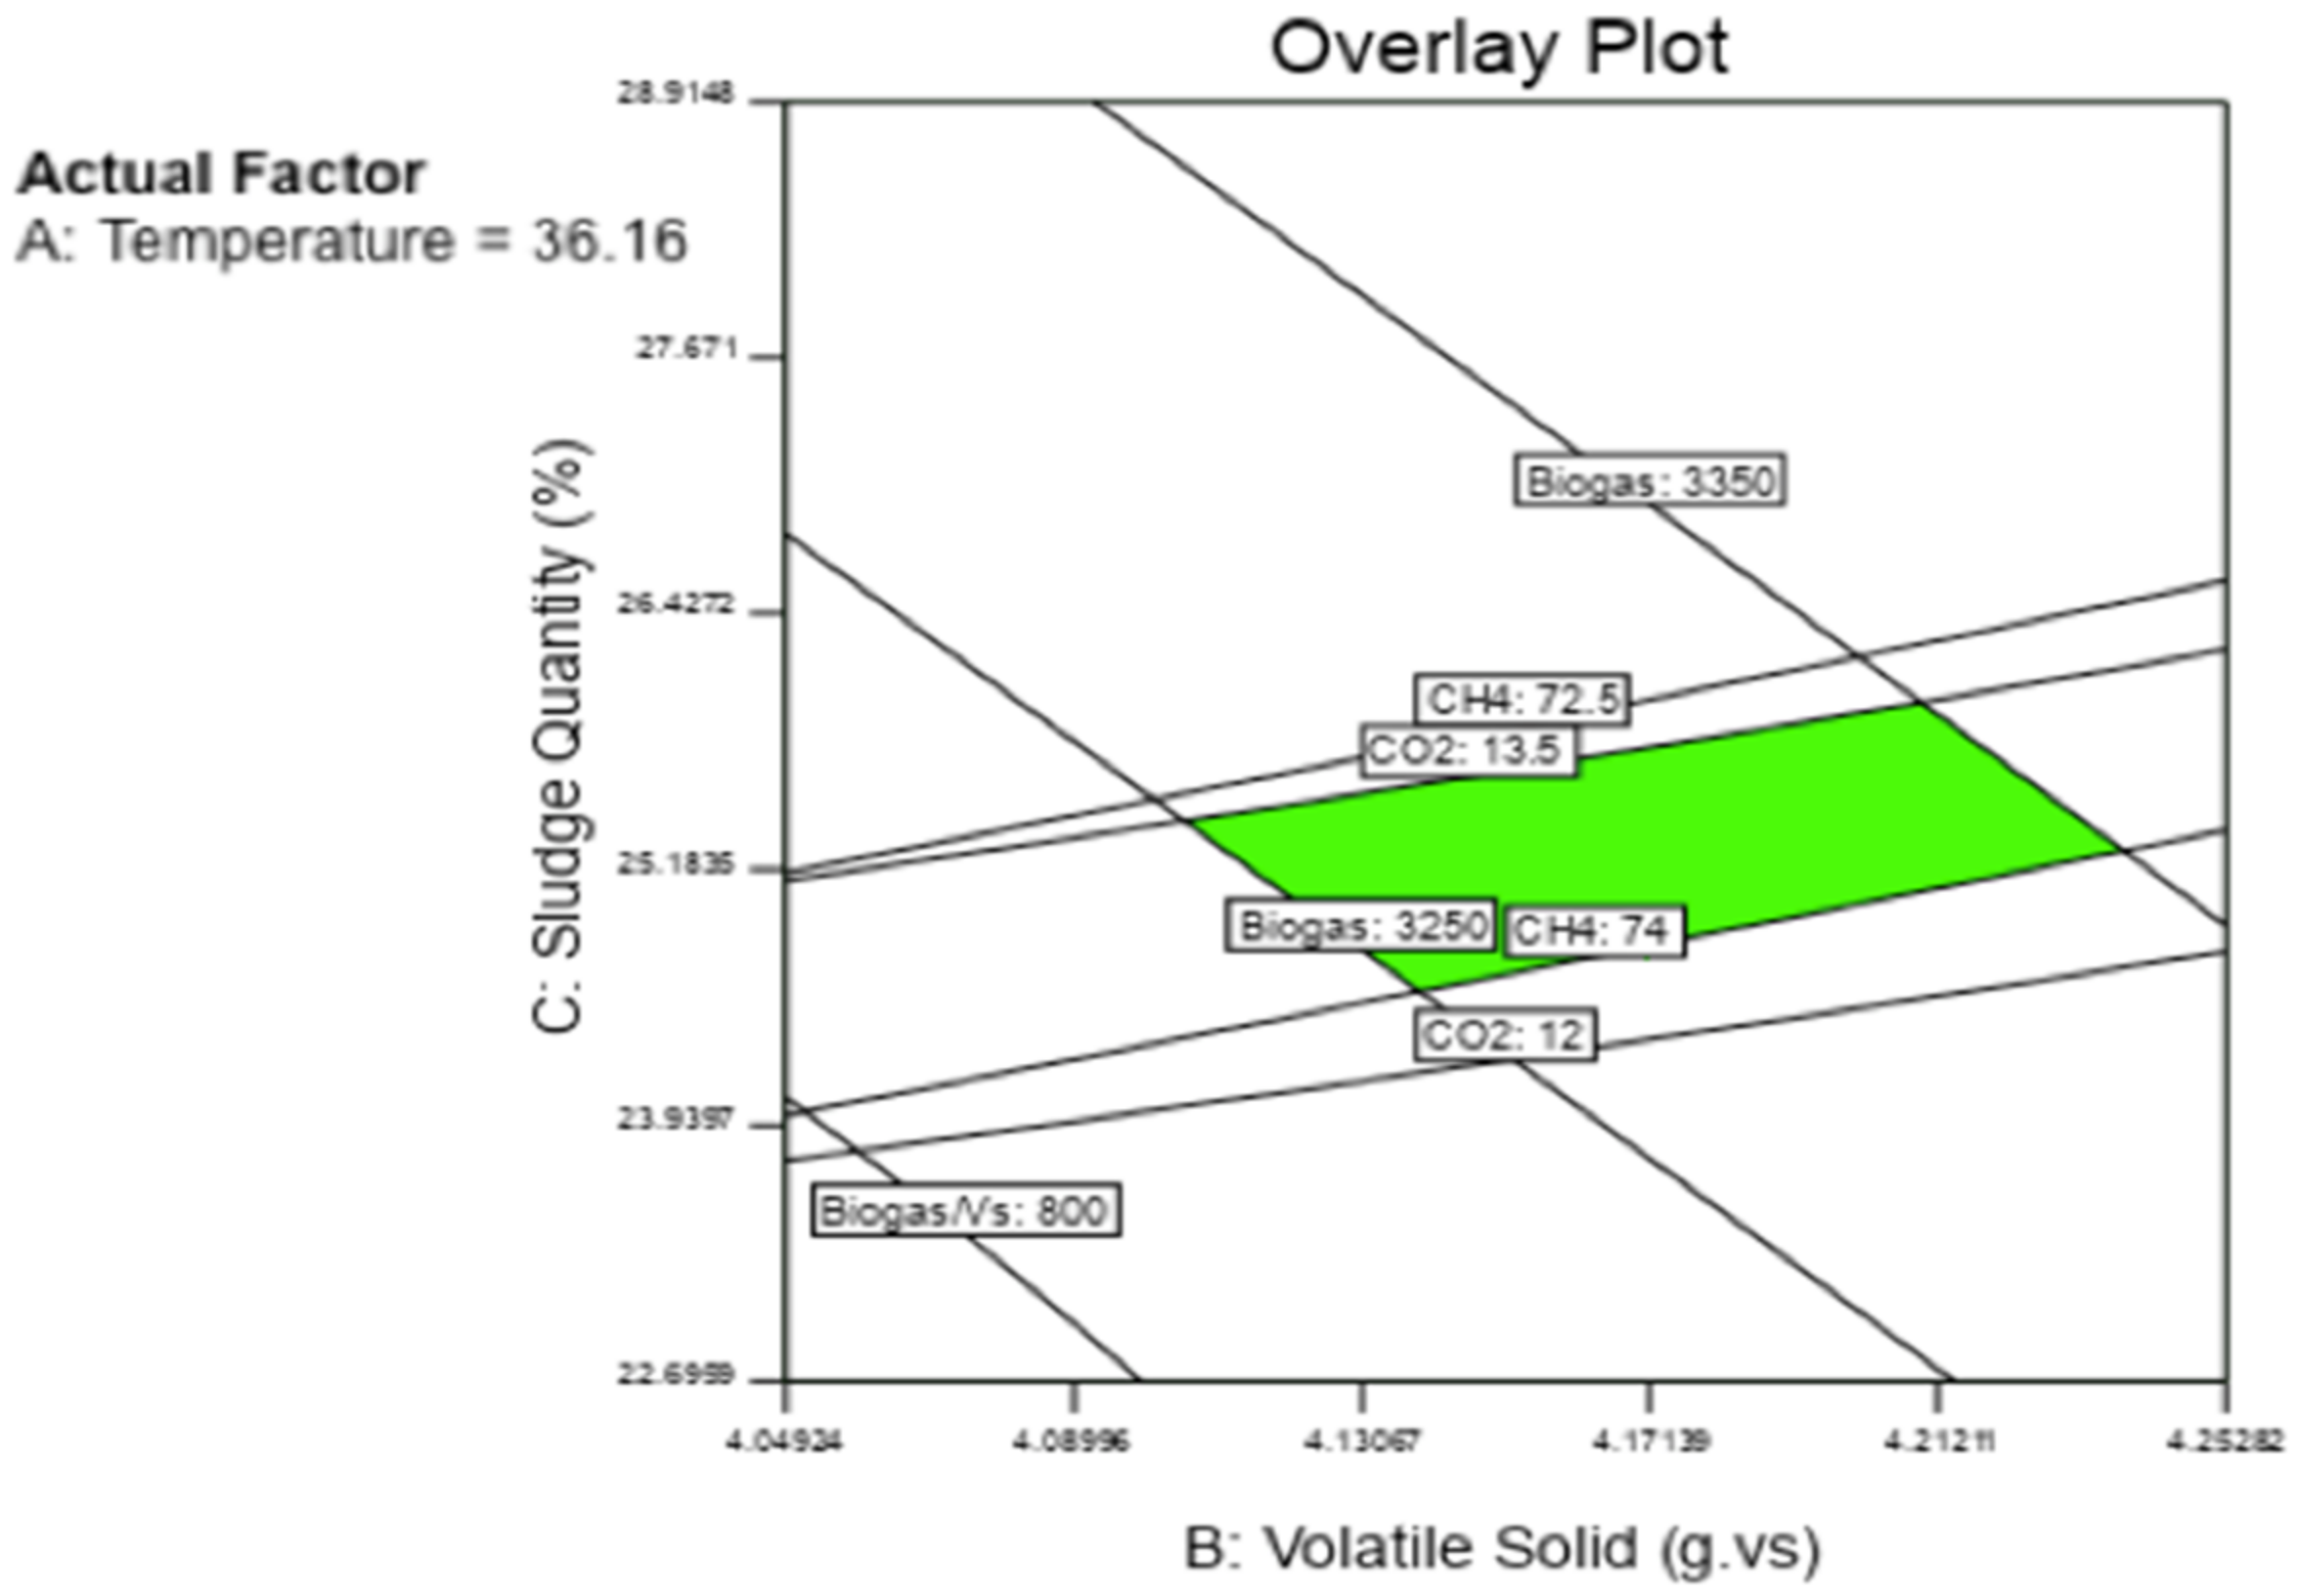
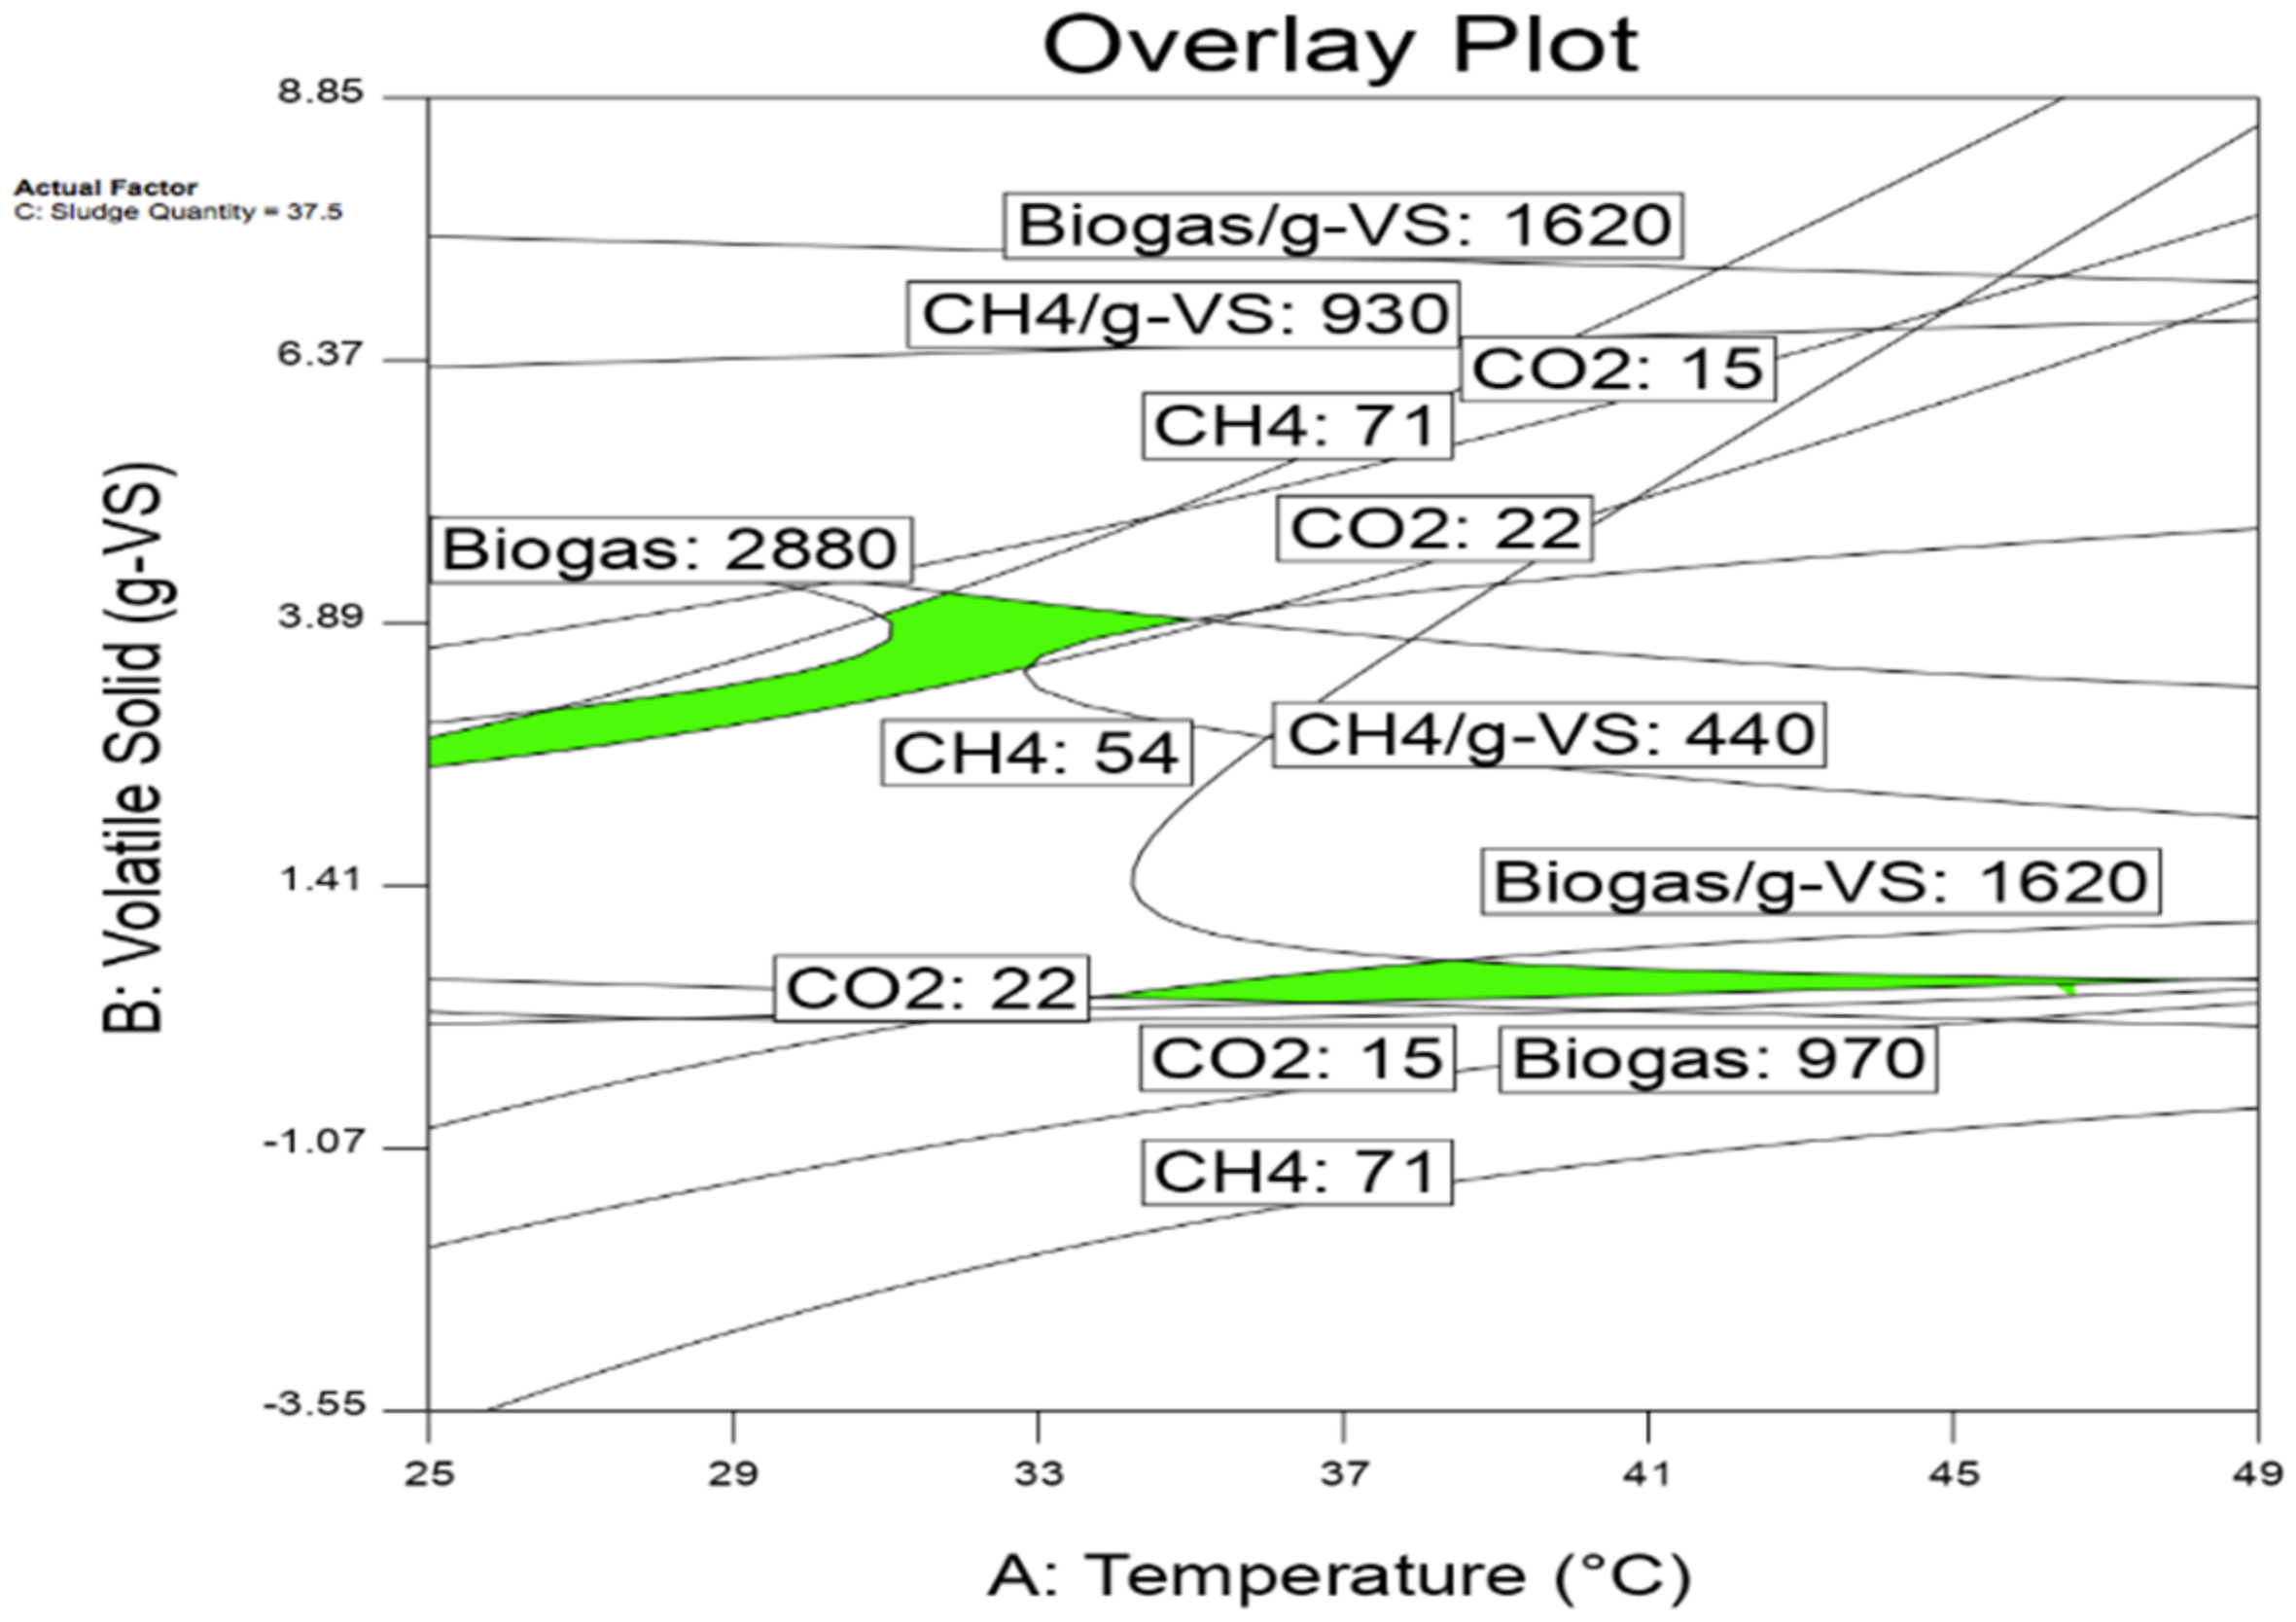
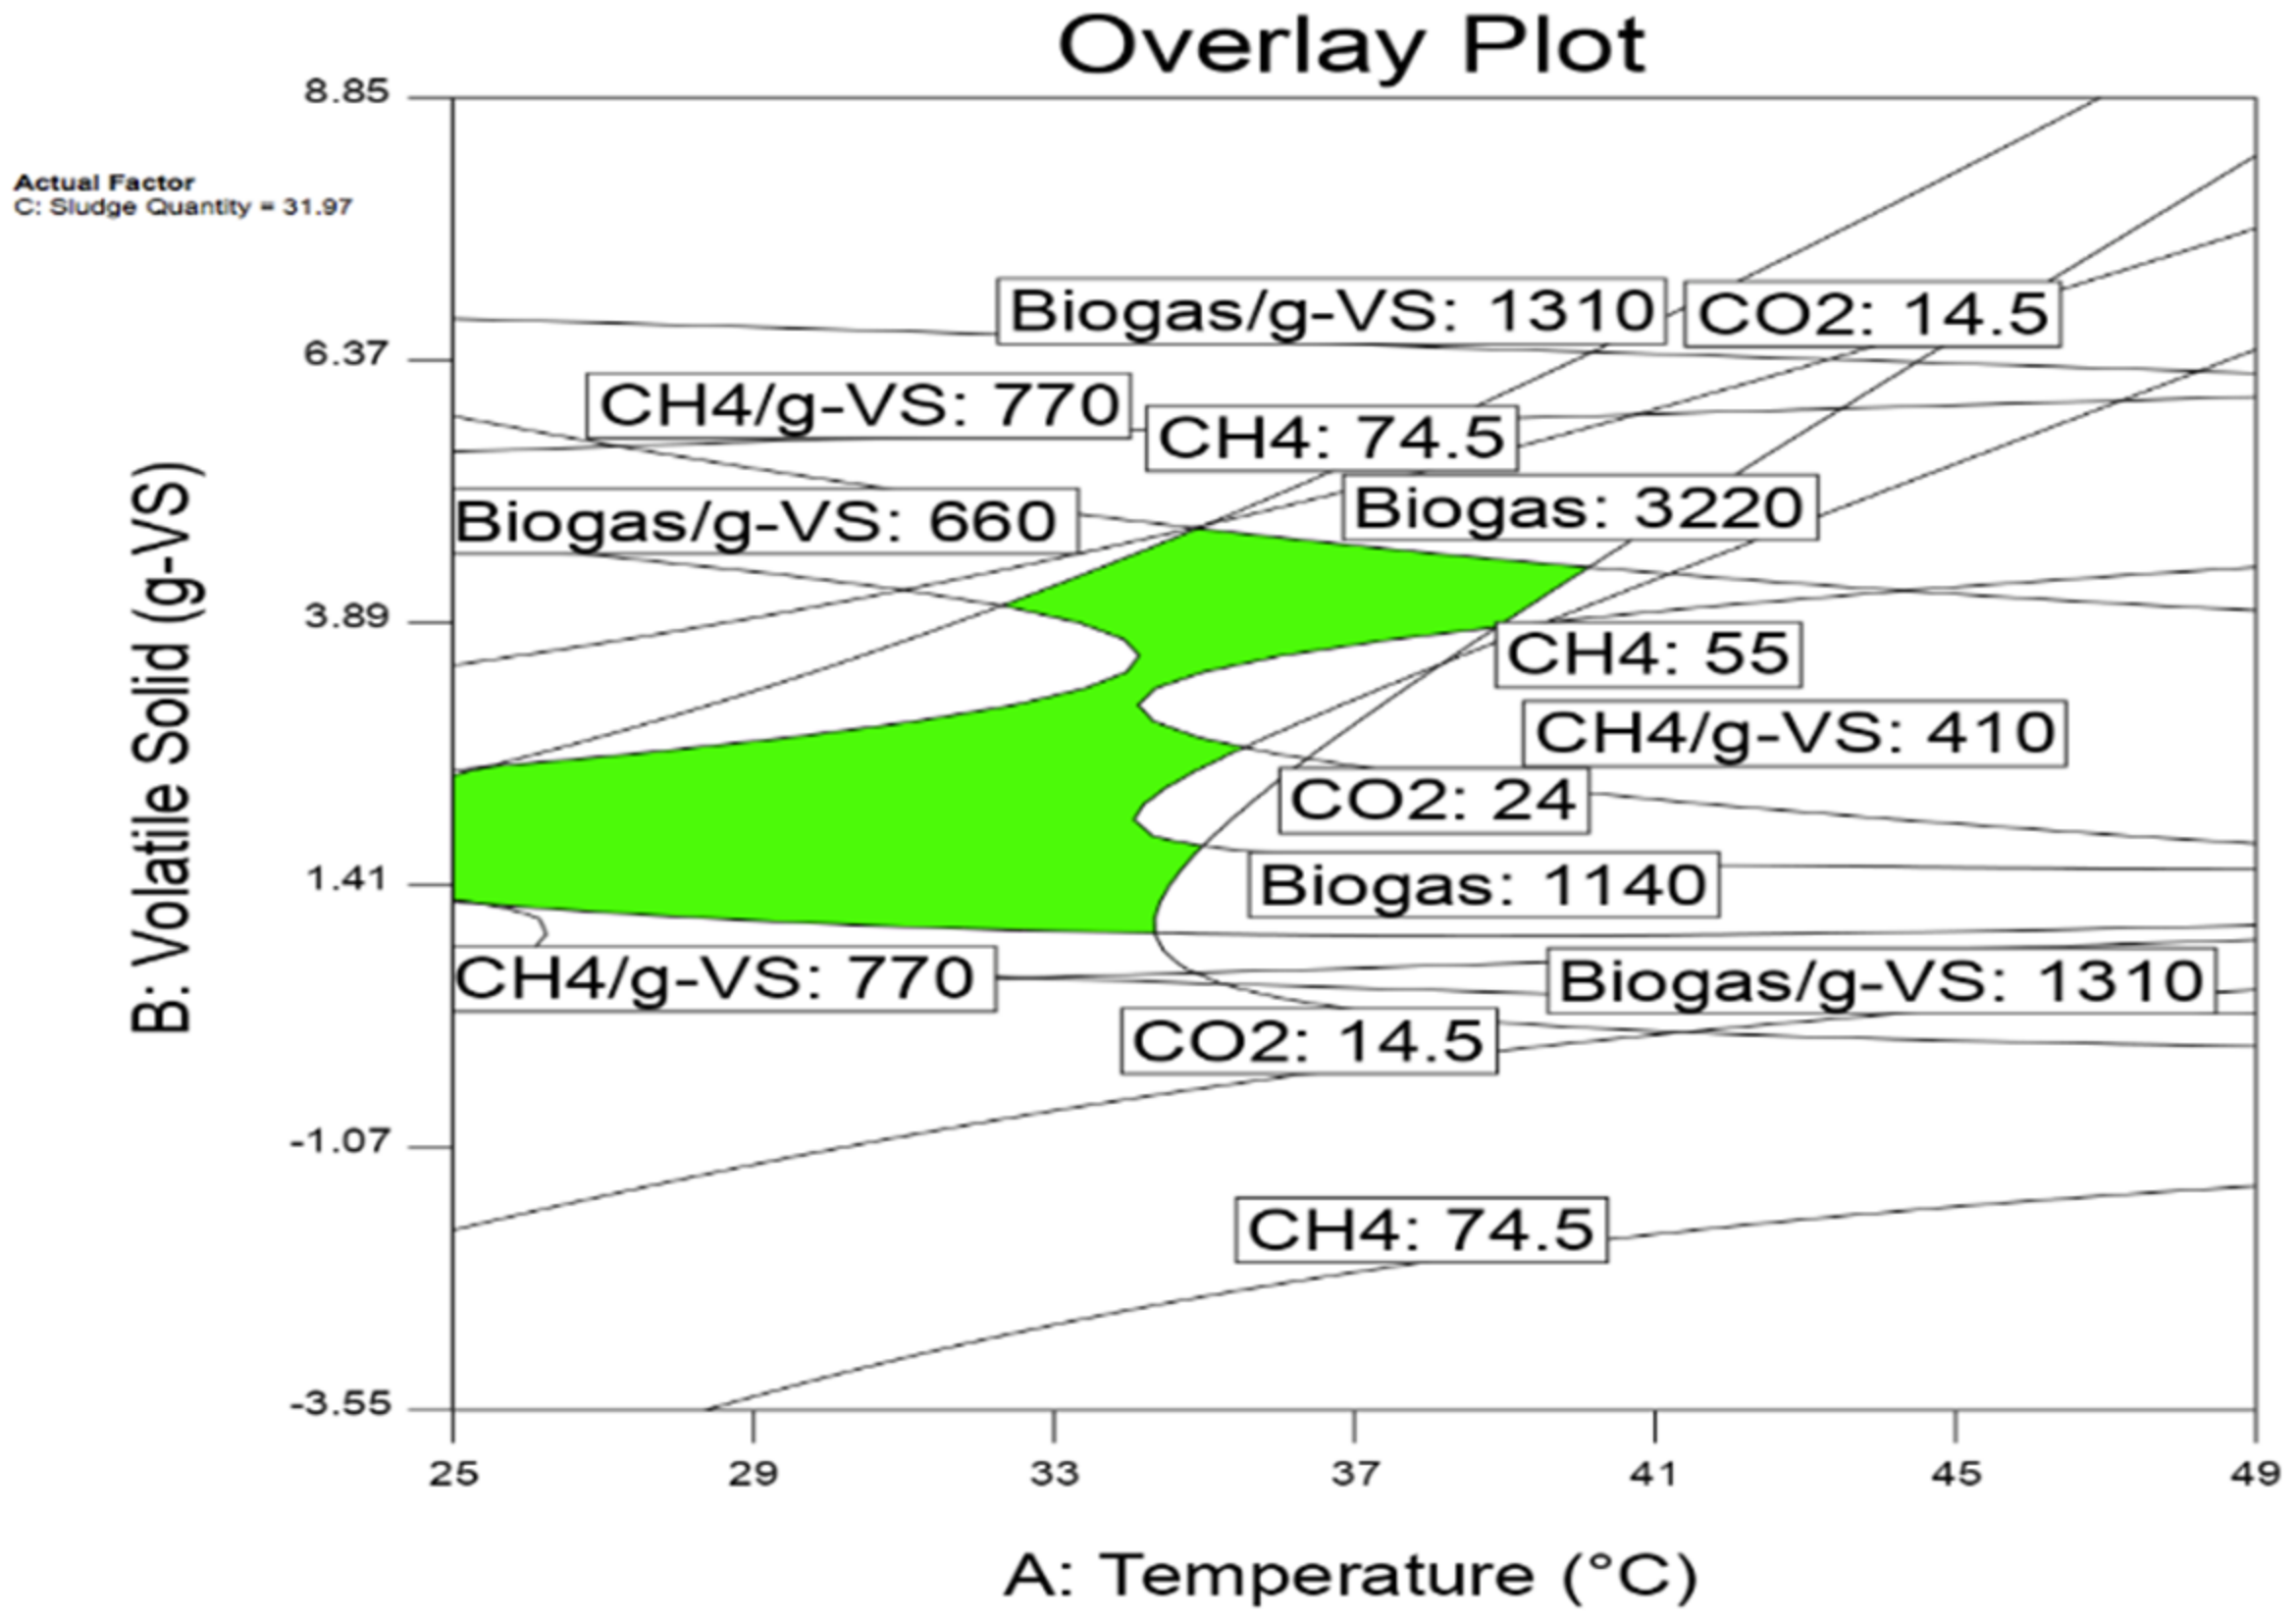
Table 1.
The Characteristics of biodiesel obtained from date seed oil from previous studies.
| Feed Stock | AN (mg KOH/g) | CN | BP (°C) | CP (°C) | D (kg/m3) | FP (°C) | PP (°C) | Vs (mm2/s) | Ref. |
|---|---|---|---|---|---|---|---|---|---|
| Multiple date seed | N/A | 60.3 | N/A | 4 | 877 | 140 | −1 | 3.84 | [43] |
| Unknown date seed | 0.21 | 58.23 | N/A | 4 | 870 | 137 | −1 | 3.97 | [44] |
AN: Acid Number, CN: Cetane Number, BP: Final boiling point, CP: Cloud point, d: Density, FP, Flash point, PP: Pour point, Vs: Viscosity, N/A: not available.
Table 2.
Date seed powder sample specifications.
| Sample Specifications | Unit | Value |
|---|---|---|
| Wet weight | g | 1 |
| Moisture content | % | 13 |
| Total solid | % | 87 |
| Ash weight | % | 1.53 |
| Volatile solid | g | 0.867 |
Table 3.
Biogas, CH4% and methane produced from sludge.
| Temperature °C | Biogas (cc) | CH4 (%) | CH4 (cc) |
|---|---|---|---|
| 34 | 1103 | 51.7 | 570 |
| 37 | 880 | 52.9 | 466 |
| 40 | 801 | 51.3 | 411 |
Table 4.
The experiment responses results for date seed.
| Std. | Run | Factor 1 | Factor 2 | Factor 3 | Resp. 1 | Resp. 2 | Resp. 3 | Resp. 4 | Resp. 5 |
|---|---|---|---|---|---|---|---|---|---|
| A * | B * | C * | Biogas | Biogas/g-VS | CH4 | CO2 | CH4/g-VS | ||
| °C | g-VS | % | cc | cc/g-VS | % | % | cc/g-VS | ||
| 1 | 6 | 34 | 1.10 | 37.5 | 1596 | 1450.5 | 54.3 | 24.0 | 788.1 |
| 2 | 14 | 40 | 1.10 | 37.5 | 1648 | 1497.7 | 52.3 | 22.6 | 783.8 |
| 3 | 2 | 34 | 4.20 | 37.5 | 3398 | 809.1 | 67.7 | 18.3 | 547.5 |
| 4 | 9 | 40 | 4.20 | 37.5 | 3801 | 905.0 | 52.6 | 23.9 | 476.0 |
| 5 | 12 | 34 | 2.65 | 25.0 | 1986 | 749.5 | 67.5 | 15.1 | 505.9 |
| 6 | 17 | 40 | 2.65 | 25.0 | 2108 | 795.6 | 57.4 | 19.6 | 456.4 |
| 7 | 7 | 34 | 2.65 | 50.0 | 2771 | 1045.8 | 56.3 | 21.2 | 588.4 |
| 8 | 1 | 40 | 2.65 | 50.0 | 2888 | 1089.6 | 51.9 | 24.0 | 565.9 |
| 9 | 16 | 37 | 1.10 | 25.0 | 1256 | 1141.6 | 57.9 | 18.2 | 661.0 |
| 10 | 8 | 37 | 4.20 | 25.0 | 3328 | 792.3 | 71.1 | 13.0 | 563.6 |
| 11 | 13 | 37 | 1.10 | 50.0 | 2023 | 1838.9 | 62.2 | 17.6 | 1143.8 |
| 12 | 15 | 37 | 4.20 | 50.0 | 4140 | 985.8 | 58.7 | 17.0 | 579.0 |
| 13 | 5 | 37 | 2.65 | 37.5 | 2515 | 949.0 | 53.4 | 24.9 | 506.4 |
| 14 | 3 | 37 | 2.65 | 37.5 | 2802 | 1057.3 | 56.7 | 26.2 | 599.2 |
| 15 | 11 | 37 | 2.65 | 37.5 | 2606 | 983.5 | 55.7 | 26.6 | 547.8 |
| 16 | 4 | 37 | 2.65 | 37.5 | 2603 | 982.4 | 55.5 | 25.6 | 545.2 |
| 17 | 10 | 37 | 2.65 | 37.5 | 2710 | 1022.7 | 54.4 | 25.5 | 556.4 |
* A = Temperature, B = Volatile solid, C = Sludge quantity.
Table 5.
ANOVA table for the Biogas Response.
| Source | Sum of Squares | df | Mean Square | F-Value | p-Value | |
|---|---|---|---|---|---|---|
| Model | 9.714 × 10⁶ | 5 | 1.943 × 10⁶ | 191.40 | <0.0001 | Significant |
| A-Temperature | 602,04.50 | 1 | 602,04.50 | 5.93 | 0.0331 | |
| B-Volatile Solid | 8.291 × 10⁶ | 1 | 8.291 × 10⁶ | 816.77 | <0.0001 | |
| C-Sludge Quantity | 1.236 × 10⁶ | 1 | 1.236 × 10⁶ | 121.73 | <0.0001 | |
| A2 | 899,68.45 | 1 | 899,68.45 | 8.86 | 0.0126 | |
| B2 | 443,82.50 | 1 | 443,82.50 | 4.37 | 0.0605 | |
| Residual | 1.117 × 10⁵ | 11 | 101,50.41 | |||
| Lack of Fit | 626,19.75 | 7 | 8945.68 | 0.7297 | 0.6648 | Not significant |
| Pure Error | 490,34.80 | 4 | 122,58.70 | |||
| Cor Total | 9.826 × 10⁶ | 16 | ||||
| Adequacy measuring tools | R2 = 0.9886 | Adjusted R2 = 0.9835 | Predicted R2 = 0.9737 | |||
Table 6.
ANOVA table for CH4% Response.
| Source | Sum of Squares | df | Mean Square | F-Value | p-Value | |
|---|---|---|---|---|---|---|
| Model | 503.37 | 7 | 71.91 | 19.11 | 0.0001 | Significant |
| A-Temperature | 124.82 | 1 | 124.82 | 33.17 | 0.0003 | |
| B-Volatile Solid | 68.45 | 1 | 68.45 | 18.19 | 0.0021 | |
| C-Sludge Quantity | 76.88 | 1 | 76.88 | 20.43 | 0.0014 | |
| AB | 42.90 | 1 | 42.90 | 11.40 | 0.0082 | |
| BC | 69.72 | 1 | 69.72 | 18.53 | 0.0020 | |
| B2 | 33.66 | 1 | 33.66 | 8.95 | 0.0152 | |
| C2 | 80.77 | 1 | 80.77 | 21.47 | 0.0012 | |
| Residual | 33.86 | 9 | 3.76 | |||
| Lack of Fit | 27.41 | 5 | 5.48 | 3.40 | 0.1297 | |
| Pure Error | 6.45 | 4 | 1.61 | Not significant | ||
| Cor Total | 537.23 | 16 | ||||
| Adequacy measuring tools | R2 = 0.9370 | Adjusted R2 = 0.8879 | Predicted R2 = 0.6893 | |||
Table 7.
Biogas, CH4% and methane obtained from sludge.
| Temperature °C | Biogas (cc) | CH4 (%) | CH4 (cc) |
|---|---|---|---|
| 34 | 1129 | 54.1 | 611 |
| 37 | 804 | 52.3 | 420 |
| 40 | 763 | 49.7 | 379 |
Table 8.
The Experiment matrix.
| Std. | Run | Factor 1 | Factor 2 | Factor 3 | Resp. 1 | Resp. 2 | Resp. 3 | Resp. 4 | Resp. 5 |
|---|---|---|---|---|---|---|---|---|---|
| A * | B * | C * | Biogas | Biogas/g-VS | CH4 | CO2 | CH4/g-VS | ||
| °C | g-VS | % | cc | cc/g-VS | % | % | cc/g-VS | ||
| 1 | 12 | 34 | 1.10 | 37.5 | 1407 | 1279.0 | 53.1 | 24.6 | 679.2 |
| 2 | 13 | 40 | 1.10 | 37.5 | 1479 | 1344.2 | 50.8 | 23.2 | 682.8 |
| 3 | 17 | 34 | 4.20 | 37.5 | 2933 | 698.4 | 65.4 | 19.3 | 457.0 |
| 4 | 3 | 40 | 4.20 | 37.5 | 3232 | 769.5 | 51.3 | 24.7 | 394.5 |
| 5 | 15 | 34 | 2.65 | 25.0 | 1699 | 641.1 | 66.2 | 16.6 | 424.7 |
| 6 | 11 | 40 | 2.65 | 25.0 | 1786 | 674.0 | 51.1 | 20.5 | 344.4 |
| 7 | 14 | 34 | 2.65 | 50.0 | 2579 | 973.2 | 53.9 | 22.7 | 524.5 |
| 8 | 1 | 40 | 2.65 | 50.0 | 2706 | 1021.1 | 50.7 | 24.8 | 517.3 |
| 9 | 4 | 37 | 1.10 | 25.0 | 971 | 883.1 | 54.6 | 19.4 | 482.5 |
| 10 | 5 | 37 | 4.20 | 25.0 | 2795 | 665.5 | 69.3 | 15.6 | 461.0 |
| 11 | 9 | 37 | 1.10 | 50.0 | 1711 | 1555.1 | 61.1 | 19.0 | 949.6 |
| 12 | 10 | 37 | 4.20 | 50.0 | 3534 | 841.4 | 56.5 | 18.8 | 475.7 |
| 13 | 16 | 37 | 2.65 | 37.5 | 2224 | 839.4 | 52.8 | 26.5 | 443.5 |
| 14 | 8 | 37 | 2.65 | 37.5 | 2346 | 885.2 | 51.2 | 27.4 | 453.2 |
| 15 | 7 | 37 | 2.65 | 37.5 | 2198 | 829.5 | 53.4 | 25.5 | 442.9 |
| 16 | 6 | 37 | 2.65 | 37.5 | 2048 | 772.9 | 52.4 | 26.6 | 405.2 |
| 17 | 2 | 37 | 2.65 | 37.5 | 2249 | 848.6 | 53.4 | 26.8 | 453.5 |
A * = Temperature, B * = Volatile solid, C * = Sludge quantity.
Table 9.
ANOVA table for Biogas/g-VS Response.
| Source | Sum of Squares | df | Mean Square | F-Value | p-Value | |
|---|---|---|---|---|---|---|
| Model | 1.030 × 10⁶ | 5 | 2.059 × 10⁵ | 115.06 | <0.0001 | Significant |
| A-Temperature | 5891.55 | 1 | 5891.55 | 3.29 | 0.0970 | |
| B-Volatile Solid | 5.442 × 10⁵ | 1 | 5.442 × 10⁵ | 304.06 | <0.0001 | |
| C-Sludge Quantity | 2.915× 10⁵ | 1 | 2.915 × 10⁵ | 162.86 | <0.0001 | |
| BC | 615,28.80 | 1 | 615,28.80 | 34.38 | 0.0001 | |
| B2 | 1.266 × 10⁵ | 1 | 1.266 × 10⁵ | 70.70 | <0.0001 | |
| Residual | 196,89.05 | 11 | 1789.91 | |||
| Lack of Fit | 130,78.11 | 7 | 1868.30 | 1.13 | 0.4805 | Not significant |
| Pure Error | 6610.95 | 4 | 1652.74 | |||
| Cor Total | 1.049 × 10⁶ | 16 | ||||
| Adequacy measuring tools | R2 = 0.9812 | Adjusted R2 = 0.9727 | Predicted R2 = 0.9333 | |||
Table 10.
ANOVA table for CH4/g-VS Response.
| Source | Sum of Squares | df | Mean Square | F-Value | p-Value | |
|---|---|---|---|---|---|---|
| Model | 3.201 × 10⁵ | 5 | 640,28.07 | 54.15 | <0.0001 | Significant |
| A-Temperature | 2679.12 | 1 | 2679.12 | 2.27 | 0.1604 | |
| B-Volatile Solid | 1.265 × 10⁵ | 1 | 1.265 × 10⁵ | 106.97 | <0.0001 | |
| C-Sludge Quantity | 711,58.78 | 1 | 711,58.78 | 60.18 | <0.0001 | |
| BC | 511,66.44 | 1 | 511,66.44 | 43.27 | <0.0001 | |
| B2 | 686,56.64 | 1 | 686,56.64 | 58.07 | <0.0001 | |
| Residual | 130,06.00 | 11 | 1182.36 | |||
| Lack of Fit | 114,18.38 | 7 | 1631.20 | 4.11 | 0.0951 | Not significant |
| Pure Error | 1587.61 | 4 | 396.90 | |||
| Cor Total | 3.331 × 10⁵ | 16 | ||||
| Adequacy measuring tools | R2 = 0.9610 | Adjusted R2 = 0.9432 | Predicted R2 = 0.8502 | |||
Table 11.
The test results of the produced digestates.
| Components | Unit | Date Seed | Extracted Oil Date Seed |
|---|---|---|---|
| Total nitrogen | mg/kg | 2322 | 4038 |
| Total phosphorous | mg/kg | 347 | 263 |
| Potassium | mg/kg | 382 | 292 |
| Dry matter | g/100 g | 1.7 | 2.4 |
| N: P: K ratio | - | 1.0: 0.15: 0.16 | 1.0: 0.07: 0.07 |
Table 12.
Biodiesel produced properties.
| Test | Result | Unit |
|---|---|---|
| Colour | Yellowish | Visual |
| Appearance | Hazy Liquid | Visual |
| Acid Number | 0.01 | mg KOH/g |
| Cetane Index | 47.6 | Calculated |
| Sulphur content | 0.005 | %Mass |
| Final Boiling Point | 439 | °C |
| Cloud Point | 0 | °C |
| Density at 15 °C | 890 | kg/m3 |
| Flash Point | 147 | °C |
| Pour point | −2.0 | °C |
| Viscosity Kinematic at 40 °C | 4.11 | mm2/s |
Table 13.
Glycerine produced properties.
| Test | Result | Unit |
|---|---|---|
| Colour | Brownish | Visual |
| Appearance at room T | Gelatinous | Visual |
| Density @ 15 °C | 1.047 | g/ml |
| Flash Point | 149.5 | °C |
| pH value @ 20 °C | 9.16 | |
| Water Content | 38 | % |
Table 14.
The optimisation criterion.
| Factors and Responses | 1st Criteria (Quality) | 2nd Criteria (Cost) | ||
|---|---|---|---|---|
| Goal | Importance | Goal | Importance | |
| A: Temperature | In range | 3 | Minimise | 3 |
| B: Volatile Solid | In range | 3 | Maximise | 3 |
| C: Sludge Quantity | In range | 3 | Minimise | 3 |
| Biogas | In range | 3 | In range | 3 |
| Biogas/g-VS | Maximise | 3 | Maximise | 3 |
| CH4 | Maximise | 5 | Maximise | 5 |
| CO2 | Minimise | 3 | Minimise | 3 |
| CH4/g-VS | Maximise | 3 | Maximise | 3 |
Table 15.
The optimal results of the two criterions for date seed.
| Criterion | A °C | B g-VS | C % | Biogas cc | Biogas/g-VS cc/g-VS | CH4 % | CO2 % | CH4/g-VS cc/g-VS |
|---|---|---|---|---|---|---|---|---|
| 1st | 36.0 | 1.10 | 50.0 | 2049.2 | 1803.3 | 60.2 | 19.6 | 1073.9 |
| 2nd | 36.2 | 4.20 | 25.4 | 3325.5 | 830.5 | 73.4 | 13.0 | 598.8 |
Table 16.
Energy evaluation of optimisation criterion for date seed.
| Criterion | Energy Consumed, kWh | Volatile Solid Weight, g | Bs, kWh/m3 | Ep, kWh/g-VS | Ec, kWh/g-VS | Net Ep, kWh/g-VS | Energy Balance, % |
|---|---|---|---|---|---|---|---|
| 1st | 58.3 | 1.10 | 5.82 | 0.79 | 0.71 | 0.08 | 11.3 |
| 2nd | 58.7 | 4.20 | 7.10 | 0.44 | 0.19 | 0.25 | 131.6 |
Table 17.
The optimal results of the two criterions for extracted oil date seed.
| Criterion | A °C | B g-VS | C % | Biogas cc | Biogas/g-VS cc/g-VS | CH4 % | CO2 % | CH4/g-VS cc/g-VS |
|---|---|---|---|---|---|---|---|---|
| 1st | 40.0 | 1.10 | 49.99 | 1818.2 | 1607.4 | 60.9 | 20.2 | 887.6 |
| 2nd | 34.0 | 4.20 | 31.97 | 2818.7 | 686.9 | 71.2 | 17.5 | 473.7 |
Table 18.
Energy evaluation of optimisation criterion for date seed.
| Criterion | Energy Consumed, kWh | Volatile Solid Weight, g | Bs, kWh/m3 | Ep, kWh/g-VS | Ec, kWh/g-VS | Net Ep, kWh/g-VS | Energy Balance,% |
|---|---|---|---|---|---|---|---|
| 1st | 79.61 | 1.10 | 5.88 | 0.71 | 0.96 | −0.25 | −27.1 |
| 2nd | 50.54 | 4.20 | 6.88 | 0.35 | 0.16 | 0.19 | 121.5 |
Publisher’s Note: MDPI stays neutral with regard to jurisdictional claims in published maps and institutional affiliations. |
© 2021 by the authors. Licensee MDPI, Basel, Switzerland. This article is an open access article distributed under the terms and conditions of the Creative Commons Attribution (CC BY) license (https://creativecommons.org/licenses/by/4.0/).
Share and Cite
MDPI and ACS Style
Alrefai, A.M.; Alrefai, R.; Benyounis, K.Y.; Stokes, J. Biogas Produced by Anaerobic Digestion Process and Biodiesel from Date Seeds. Energies 2021, 14, 4851. https://doi.org/10.3390/en14164851
AMA Style
Alrefai AM, Alrefai R, Benyounis KY, Stokes J. Biogas Produced by Anaerobic Digestion Process and Biodiesel from Date Seeds. Energies. 2021; 14(16):4851. https://doi.org/10.3390/en14164851
Chicago/Turabian StyleAlrefai, Alla Mohammed, Raid Alrefai, Khaled Y. Benyounis, and Joseph Stokes. 2021. "Biogas Produced by Anaerobic Digestion Process and Biodiesel from Date Seeds" Energies 14, no. 16: 4851. https://doi.org/10.3390/en14164851
Note that from the first issue of 2016, this journal uses article numbers instead of page numbers. See further details here.