
Abstract
Surface interaction probabilities are critical parameters that determine the behaviour of low pressure plasmas and so are crucial input parameters for plasma simulations that play a key role in determining their accuracy. However, these parameters are difficult to estimate without in situ measurements. In this work, the role of two prominent surface interaction probabilities, the atomic oxygen recombination coefficient γO and the thermal energy accommodation coefficient αE in determining the plasma properties of low pressure inductively coupled oxygen plasmas are investigated using two-dimensional fluid-kinetic simulations. These plasmas are the type used for semiconductor processing. It was found that αE plays a crucial role in determining the neutral gas temperature and neutral gas density. Through this dependency, the value of αE also determines a range of other plasma properties such as the atomic oxygen density, the plasma potential, the electron temperature, and ion bombardment energy and neutral-to-ion flux ratio at the wafer holder. The main role of γO is in determining the atomic oxygen density and flux to the wafer holder along with the neutral-to-ion flux ratio. It was found that the plasma properties are most sensitive to each coefficient when the value of the coefficient is small causing the losses of atomic oxygen and thermal energy to be surface interaction limited rather than transport limited.
Export citation and abstract BibTeX RIS
1. Introduction
Low temperature plasmas produced in low pressure gases are widely used for industrial applications, prominent examples include the etching and deposition of nano-scale structures in the semi-conductor industry [1–3], electric propulsion of spacecraft [4, 5] and as potential negative ion sources for neutral beam heating of fusion plasmas [6, 7]. For such applications plasma simulations are often used to aid in reactor and process design and to better understand fundamental processes [6, 8–15]. These simulations require a wide range of fundamental input data such as electron impact cross sections, heavy particle rate coefficients and surface interaction probabilities [16]. The accuracy of any plasma simulation is inherently linked to any uncertainty in these fundamental input data [17]. Previous investigations have studied the sensitivity of plasma simulations to the uncertainty in gas phase reaction cross sections and rate coefficients [17] and the consequences of including or neglecting various collisional processes [18, 19]. Such investigations yield valuable information to assess how the accuracy of plasma simulations may be improved and the number of reactions can be minimised in order to simplify chemical reaction mechanisms.
There have also been a number of experimental and computational studies that have discussed the role of surface recombination probabilities for atomic neutral species [20–23] and surface quenching probabilities for excited neutrals [24–26] in defining the plasma dynamics. In this context surface recombination refers to, for example, an oxygen atom recombining with another oxygen atom on a surface, and returning to the plasma as an oxygen molecule. It has been shown that changes in the value of these coefficients can lead to large variations in not only the reactive neutral species densities, to which they are directly linked, but also to the densities of negative ions and the overall electron heating dynamics. As a result the predictive capability of plasma simulations where reactive atomic and radical species or excited neutrals are present is strongly affected by the accuracy of these surface interaction probabilities. The situation is complicated further by the fact that these parameters are prone to vary with specific plasma conditions and reliable predictive formulae for them do not yet exist.
Experimental investigations have been carried out to measure surface recombination probabilities for various atomic or excited species under different plasma and surface conditions [20, 27–30]. However, the often complex dependencies of these probabilities on both the plasma and surface condition means that deriving a general scaling law that is applicable to any atom/molecule in contact with any surface exposed to any type of plasma is, at best, challenging. As a result these probabilities still represent a major uncertainty in plasma modelling and thus constrain the parameter space over which plasma simulations can be expected to yield accurate results.
Another surface interaction probability that has been less studied in the context of non-equilibrium plasmas is the thermal energy accommodation coefficient, often denoted as αE. This coefficient represents the fraction of atoms or molecules which attain thermal equilibrium with a surface after a collision with it and is often defined in the form [31]:

where Ti and Tr are the temperatures of particles incident on the surface and reflected from the surface respectively. Ts represents the surface temperature, or equivalently the temperature of particles reflected from the surface that attain thermal equilibrium with the surface.
The value of the thermal energy accommodation coefficient has been determined for a range of gas-surface combinations experimentally or through numerical simulations [32–41]. Many of these investigations have focused on noble gases or air interacting with metallic surfaces [32, 34, 35, 38]. However, fewer studies have dealt with reactive gases, or interactions with non-metallic surfaces. This is significant for the application of these coefficients in plasma modelling as reactive gases are used in the majority of industrial applications and non-metallic surfaces such as inert metal-oxides commonly make up a large part of the overall surface in contact with the plasma.
Given that the value of αE determines the rate at which gas phase atoms or molecules exchange energy with surfaces it will play an important role in determining the neutral gas temperature in non-thermal plasma sources and have a significant influence on the dynamics of the plasma as a whole. Several physical phenomena in non-thermal plasmas may result in variations of the value of αE from those measured or calculated for 'clean' surfaces, or cause variations from process to process in the same reactor. For example, it has been proposed, based on the results of molecular dynamics simulations, that the value of αE depends on the presence of adsorbed atoms or molecules on surfaces [38]. In non-thermal plasmas the coverage of surfaces by adsorbed atoms or molecules is known to be affected by several plasma parameters such as the flux of atomic neutral species, ion bombardment and surface temperature [42–44]. All of these parameters are susceptible to change from process to process in a given plasma reactor either intentionally as a mechanism to improve process outcomes, or unintentionally due to process drifts [12]. As such, it is reasonable to expect some change in the value of αE under varying plasma conditions, however, it is difficult to quantify how significant this change may be.
Given the uncertainty in the values of thermal accommodation and atomic species recombination coefficients it is necessary to understand, quantitatively, how the variation of these parameters affects the properties of a given plasma. While much is known in a qualitative sense about how these coefficients affect gas temperatures and atomic species densities, it is important to consider the ranges over which these parameters have the most significant effect on the overall plasma properties, in particular those quantities relevant for industrial applications. Quantities of specific relevance in this regard are reactive neutral and ion fluxes to surfaces and the ratio of the two quantities [45]. In addition, the ion bombardment energy at the substrate is known to be an important factor in many industrial plasma processes [13, 45, 46]. In this context a variety of different schemes exist to control these quantities in low pressure plasmas, such as substrate biasing [47–50] and voltage waveform tailoring [11, 26, 47, 49, 51–56]. However, the known importance of recombination and accommodation coefficients in determining atomic species densities and gas temperatures suggests that they have the potential to influence all of these properties of a given plasma which may affect the range over which they can be controlled in industrial applications.
This study seeks to quantify the influence of varying the atomic oxygen recombination coefficient γO and thermal energy accommodation coefficient αE on the plasma properties in a low pressure inductively coupled oxygen plasma through two-dimensional numerical simulations inclusive of charged and neutral particle dynamics. It has been found that the thermal energy accommodation coefficient has a strong influence on the plasma properties through its role in determining the neutral gas temperature and consequently the neutral gas density. The role of the atomic oxygen recombination coefficient is primarily in determining the atomic oxygen density and its flux at the wafer holder as well as the reactive neutral-to-ion flux ratio to the wafer holder. The greatest sensitivity of the plasma to αE and γO occurs at low values of each coefficient when the losses of atomic oxygen and thermal energy are limited by the surface interaction probability as opposed to the rate of diffusion to surfaces. The numerical simulations used to carry out this investigation are described in section 2. The results of this investigation are discussed in detail in section 3 and our conclusions are presented in section 4.
2. Description of the model
In this work a two-dimensional, modular, fluid-kinetic simulation code, the hybrid plasma equipment model (HPEM) has been used to model a planar inductively coupled plasma reactor. The geometry of the simulation domain is shown in figure 1 and is based on the experimental reactor presented in [57, 58]. The simulation domain consists of a cylindrically symmetric chamber 27.5 cm in radius with a gap of 10 cm between the wafer holder and the alumina window separating the gas from a 4-turn inductive coil which is used to drive the plasma. The HPEM code has previously been described in detail elsewhere [9] so only a brief overview of the relevant details is given here. The modular structure of the HPEM allows for the relevant physics of a given system to be addressed in different ways using various modules. In this work the modules used are the fluid kinetics Poisson module (FKPM), the electron Monte Carlo simulation (eMCS), the electromagnetics module (EMM) and the plasma chemistry Monte Carlo module (PCMCM).
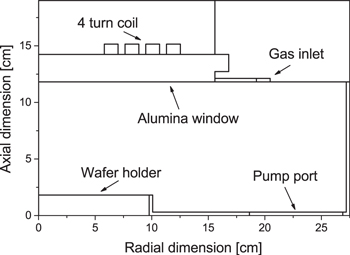
Figure 1. Schematic of the simulation geometry.
Download figure:
Standard image High-resolution imageThe FKPM forms the basis of the simulation and solves the continuity, momentum and energy equations for all heavy particle species separately in combination with Poisson's equation for the electric potential. Electron momentum is solved for using the drift-diffusion approximation. The accommodation coefficient αE and the value of γO are assumed the same for all surfaces. The EMM solves for the electric and magnetic fields associated with the current in the inductive coil which is adjusted to deliver the specified input power. The eMCS simulates the interaction of electron pseudo-particles with electric fields obtained from the EMM and FKPM using a Monte Carlo algorithm which is described in detail in [59]. This algorithm yields the electron energy distribution function (EEDF) at all points in the simulation domain along with the corresponding electron impact rate coefficients and electron transport properties which are used as input for the FKPM in the following iteration.
After the simulation has reached convergence the PCMCM is used to simulate ion and neutral energy distribution functions to the wafer holder, which is marked in the simulation geometry shown in figure 1. The PCMCM launches ion and neutral pseudo-particles from locations in the plasma weighted by their source functions obtained from the FKPM and integrates the trajectories of these pseudo-particles through the time and space dependent electric fields obtained from the FKPM. All particles reaching the wafer holder are recorded and as such the IEDFs and ion/neutral fluxes presented in section 3 are averages over the entire surface of the wafer holder.
The thermal energy accommodation coefficient αE is used to define a 'jump' in the temperature of a given species in the computational cell adjacent to the reactor wall. Following Lofthouse et al [60] the temperature gradient adjacent to a surface is given by:
where Tg is the temperature of the species, γ is the ratio of specific heats (i.e specific heat at constant pressure and specific heat at constant volume), Pr is the Prandtl number and λ is the collisional mean free path for momentum transfer. Requiring that the heat flux from the plasma to the wall is constant this condition is implemented by defining an effective thermal conductivity in the computational cell adjacent to the wall such that:

where κ is the unmodified thermal conductivity and Δx is the computational mesh spacing.
The reaction scheme used in the simulation includes electrons, ground state molecular oxygen (O2(X )), molecular oxygen metastables (O2(a
 ) and O2(b
 )) ground state atomic oxygen (O(3P)), atomic oxygen metastables (O(1D)), molecular oxygen positive ions (O
 ), atomic oxygen positive ions (O+) and atomic oxygen negative ions (O−). The full list of reactions is given in table 1. This reaction scheme has been designed to incorporate the dominant reactions between the main charged and neutral species expected to be present under the conditions studied, based on previous works incorporating larger reaction schemes [19, 61]. The exothermicity of each reaction for use in the gas temperature calculation is calculated based on the enthalpy of formation of each species and for electron impact dissociation from the measurements of Cosby [62]. The metastable molecules O2(a
 ) and O2(b
 ) are assumed to be quenched at surfaces with probabilities of 5 × 10⁻⁵ and 2 × 10⁻² respectively. These coefficients are generally poorly known and as such the values used here represent estimates in the same range as those used in previous works [24–26, 61, 63].
Table 1. Reaction mechanism.
| No. | Reaction | Rate coefficienta,b | Reference |
|---|---|---|---|
| R1 | e + O2(X ) )  e + O2(X e + O2(X ) ) |
f( ) ) |
[64, 65] |
| R2 | e + O2(a1Δg)  e + O2(a1Δg) e + O2(a1Δg) |
f() |
[66] |
| R3 | e + O2(b ) )  e + O2(b e + O2(b ) ) |
f() |
[66] |
| R4 | e + O(3P)  e + O(3P) e + O(3P) |
f() |
[67] |
| R5 | e + O(1D)  e + O(1D) e + O(1D) |
f() |
c |
| R6 | e + O2(X ) )  e + O2(a1Δg) e + O2(a1Δg) |
f() |
[64, 65] |
| R7 | e + O2(X ) )  e + O2(b e + O2(b ) ) |
f() |
[64, 65] |
| R8 | e + O2(a1Δg)  e + O2(b e + O2(b ) ) |
f() |
[68] |
| R9 | e + O2(b ) )  O2(a1Δg) + e O2(a1Δg) + e |
f() |
d |
| R10 | e + O2(a1Δg)  O2(X O2(X ) + e ) + e |
f() |
d |
| R11 | e + O2(b ) )  O2(X O2(X ) + e ) + e |
f() |
d |
| R12 | e + O2(X ) )   + e + e + e + e |
f() |
[64, 65] |
| R13 | e + O2(a1Δg)   + e + e + e + e |
f() |
e |
| R14 | e + O2(b ) )   + e + e + e + e |
f() |
e |
| R15 | e + O2(X ) )  O(3P) + O− O(3P) + O− |
f() |
[64, 65] |
| R16 | e + O2(a1Δg)  O(3P) + O− O(3P) + O− |
f() |
[69] |
| R17 | e + O2(b ) )  O(3P) + O− O(3P) + O− |
f() |
f |
| R18 | e + O2(X ) )  O(3P) +O(3P) + e O(3P) +O(3P) + e |
f() |
[64, 65] |
| R19 | e + O2(a1Δg)  O(3P) + O(3P) + e O(3P) + O(3P) + e |
f() |
e |
| R20 | e + O2(b ) )  O(3P) + O(3P) + e O(3P) + O(3P) + e |
f() |
e |
| R21 | e + O2(X ) )  O(3P) +O(1D) + e O(3P) +O(1D) + e |
f() |
[64, 65] |
| R22 | e + O2(a1Δg)  O(3P) + O(1D) + e O(3P) + O(1D) + e |
f() |
e |
| R23 | e + O2(b ) )  O(3P) + O(1D) + e O(3P) + O(1D) + e |
f() |
e |
| R24 | e + O(3P)  e + O(1D) e + O(1D) |
f() |
[70] |
| R25 | e + O(1D)  e + O(3P) e + O(3P) |
f() |
d |
| R26 | e + O(3P)  O+ + e + e O+ + e + e |
f() |
[70] |
| R27 | e + O(1D)  O+ + e + e O+ + e + e |
f() |
e |
| R28 | e +  O(3P) + e + e O(3P) + e + e |
f() |
[71] |
| R29 | e +  O(3P) + O(3P) O(3P) + O(3P) |
3.72 × 10⁻⁹T
|
[72, 73] |
| R30 | e +  O(3P) + O(1D) O(3P) + O(1D) |
7.44 × 10⁻⁹T
|
[72, 73] |
| R31 | e +  O(1D) + O(1D) O(1D) + O(1D) |
7.44 × 10⁻⁹T
|
[72, 73] |
| R32 |
 + +  O2(X O2(X ) + O(3P) ) + O(3P) |
2.60 × 10⁻⁸T
|
[74] |
| R33 |
 + +  O(3P) + O(3P) + O(3P) O(3P) + O(3P) + O(3P) |
2.60 × 10⁻⁸T
|
[74] |
| R34 | O+ +  O(3P)+ O(3P) O(3P)+ O(3P) |
4.00 × 10⁻⁸T
|
[74] |
| R35 | O(3P) +  O2(X O2(X ) + e ) + e |
1.50 × 10⁻¹⁰T
|
[75] |
| R36 | O2(a1Δg) +  O2(X O2(X ) + O(3P) + e ) + O(3P) + e |
1.10 × 10⁻¹⁰ | [76], g) |
| R37 | O2(b ) + ) +  O2(X O2(X ) + O(3P) + e ) + O(3P) + e |
6.90 × 10⁻¹⁰ | [77] |
| R38 | O+ + O2(X ) )   + O(3P) + O(3P) |
2.30 × 10⁻¹¹ | [78] |
| R39 | O+ + O2(a1Δg)   + O(3P) + O(3P) |
1.00 × 10⁻¹¹ | [78] |
| R40 | O+ + O2(b ) )   + O(3P) + O(3P) |
1.00 × 10⁻¹¹ | h |
| R41 |
 + O2(X + O2(X ) )  O2(X O2(X ) + ) + 
|
4.00 × 10⁻¹⁰ | [79] |
| R42 |
 + O2(a1Δg) + O2(a1Δg)  O2(X O2(X ) + ) + 
|
2.00 × 10⁻¹⁰ | i |
| R43 |
 + O2(b + O2(b ) )  O2(X O2(X ) + ) + 
|
2.00 × 10⁻¹⁰ | i |
| R44 | O(3P) + O(1D)  O(3P)+ O(3P) O(3P)+ O(3P) |
8.00 × 10⁻¹² | [80] |
| R45 | O2(X ) + O(1D) ) + O(1D)  O2(X O2(X ) + O(3P) ) + O(3P) |
0.32 × 10⁻¹¹exp(67/Tg) | [81–83] |
| R46 | O2(X ) + O(1D) ) + O(1D)  O2(a1Δg) + O(3P) O2(a1Δg) + O(3P) |
0.32 × 10⁻¹¹exp(67/Tg) | [81–83] |
| R47 | O2(X ) + O(1D) ) + O(1D)  O2(b O2(b ) + O(3P) ) + O(3P) |
2.56 × 10⁻¹¹exp(67/Tg) | [81–83] |
| R48 | O2(a1Δg) + O(3P)  O2(X O2(X ) + O(3P) ) + O(3P) |
2.00 × 10⁻¹⁶ | [84, 85] |
| R49 | O2(a1Δg) + O2(X ) )  O2(X O2(X )+ O2(X )+ O2(X ) ) |
3.60 × 10⁻¹⁸exp(−220/Tg) | [85] |
| R50 | O2(a1Δg) + O2(a1Δg)  O2(X O2(X ) + O2(b ) + O2(b ) ) |
1.81 × 10⁻¹⁸T exp(700/Tg) exp(700/Tg) |
[86] |
| R51 | O2(b ) + O(3P) ) + O(3P)  O2(X O2(X ) + O(3P) ) + O(3P) |
8.00 × 10⁻¹⁴ | [85] |
| R52 | O2(b ) + O2(X ) + O2(X ) )  O2(a O2(a ) + O2(X ) + O2(X ) ) |
3.90 × 10⁻¹⁷ | [85] |
aUnits: Rate coefficients in cm3/s; T0 = Tg/300; Tg has units K, Te has units eV.
bf() indicates that the rate coefficients are obtained from the EEDF calculated via the eMCS. Electron-impact excitation of O2 into rotationally, vibrationally and electronically excited states and of O(3P) into electronically excited states, according to the cross sections given in [64, 65, 70] is accounted for in the eMCS to properly simulate electron energy losses.
cAssumed to be the same as for O(3P).
dSuperelastic cross section obtained by detailed balance from the corresponding excitation process.
eCross section estimated by shifting and scaling the corresponding cross section for the ground state by the excitation threshold of the metastable.
fCross section estimated by shifting and scaling the corresponding cross section for O2(a1Δg).
gIn reality this reaction proceeds through the production of O3, which is neglected in this model for simplicity.
hAssumed the same as for O2(a ) state.
iLower rate assumed for collisions of
) state.
iLower rate assumed for collisions of  with metastable molecules based on observations of [78] for the case of O+.
In order to gain insight into how the change of atomic oxygen recombination γO and thermal energy accommodation coefficients αE affect the discharge dynamics the values of the two coefficients are varied over ranges which may be expected for the conditions investigated. Here, the same value of γO has been applied at the surface for both O(3P) and O(1D). Due to a lack of experimental data, and in order to simplify analysis of the results presented, no quenching of O(1D) at the surface causing it to return as O(3P) is considered. Values of γO reported in the literature range from ≈ 0.01 [28] to ≈ 0.5 [29] depending on the surface material, in the pressure range considered here. Thus, the value of γO has been varied over this range in order to cover the maximum variation of the plasma parameters resulting from differences in its value for different wall materials, or variations from process to process where the wall material is susceptible to change through deposition or etching.
As discussed previously, relatively few studies have been devoted to the measurement of αE in low temperature plasmas. Given that αE is known to depend on a range of different properties of both the gas and the surface, it is difficult to predict in advance which values should be used for any given system. In this context, αE is varied over a wide range from 0.1 to 0.95. It should be noted that this range is not necessarily claimed to be realistic for an oxygen plasma. It is chosen here to emphasise the maximum range of variation of the other plasma parameters possible under variation of αE in order to assess its importance. However, it is expected that, depending on the plasma-surface combination in question, there exist plasma processes where the effective value of αE may lie at almost any point in the range considered here.
3. Results and discussion
Figure 2 gives examples of the spatial profiles of (a) the ground state atomic oxygen density and (b) the average gas temperature as a function of radial and axial dimensions. The average gas temperature is defined as a mole fraction weighted sum of the temperatures of the individual neutral species in the plasma. The parameters used here represent the base case where the pressure p = 10 mTorr, and the power P = 500 W. The gas flow rate is set at 20 sccm which leads to an average gas residence time of around 1 s. The temperature of all surfaces in contact with the plasma is held constant at 325 K. Here, the accommodation coefficient αE = 0.5 and the atomic oxygen recombination coefficient γO = 0.05. Under these conditions the dominant power deposition process is through electron heating directly below the coil. This heating allows for electrons to gain sufficient energy to dissociate molecular oxygen, via reactions R18–R23 in table 1, producing two oxygen atoms with a total of 0.5–3 eV of thermal energy depending upon the particular dissociation pathway [62]. This thermal energy is produced through a Franck–Condon process where electron impact produces a dissociative excited state with excess potential energy being dissipated into the translational modes of the fragments. The rate of this process is maximum just under the coil at a radial location of around 9 cm from the centre of the reactor. However, the mean free path of oxygen atoms under the low pressure conditions considered here is sufficiently long that these atoms easily diffuse from their point of creation, resulting in a relatively flat atomic oxygen density profile as a function of both radial and axial dimensions. Similarly, the dominant process transferring electron energy into gas heating is through the dissociation process which produces atomic oxygen with excess thermal energy. Overall, the gas temperature takes on a profile typical of conditions where thermal diffusion to the walls is the dominant energy loss process.

Figure 2. Two dimensional profiles of (a) the ground state atomic oxygen density, and (b) the average gas temperature (p = 10 mTorr, P = 500 W, αE = 0.5, γO = 0.05).
Download figure:
Standard image High-resolution imageThe density of atomic oxygen increases towards the walls of the reactor under these conditions because the thermal energy accommodation coefficient αE is much larger than atomic oxygen recombination coefficient γO. As a result, the gas temperature decreases towards the walls, which act as sinks for thermal energy. Losses of atomic oxygen at the walls are proportionally lower as γO is small. The result is that the atomic oxygen density profile does not decrease towards the walls and instead follows approximately the total neutral gas density which increases near the walls due to the decrease in gas temperature. This is facilitated by the essentially constant value of the gas pressure, which varies by only a few percent over the whole reactor. In general, the radial and axial profiles of many plasma parameters change as γO and αE are varied. However, for the low pressures considered here these changes in spatial profile are usually small. For example, the relative variation in the value of each plasma parameter at the centre of the reactor with the two surface coefficients is similar to the change in their volume-averaged values. As a result, in the remainder of this article we discuss the values of each parameter at the centre of the reactor and species fluxes to the centre of the wafer holder to illustrate major trends as a function of both surface coefficients.
The ground state atomic oxygen density and gas temperature at the radial and axial centre of the reactor are shown as a function of the atomic oxygen recombination coefficient γO for αE = 0.5 in figure 3(a). The atomic oxygen density decreases from 8.3 × 1013 cm−3 for γO = 0.01 to around 5.9 × 1012 cm−3 when γO = 0.5. The gas temperature remains comparatively constant over the same range, increasing from 860 K to 990 K. The decrease of the atomic oxygen density with increasing γO is a result of the increasing conversion of atomic oxygen to molecular oxygen at the surface as γO increases.
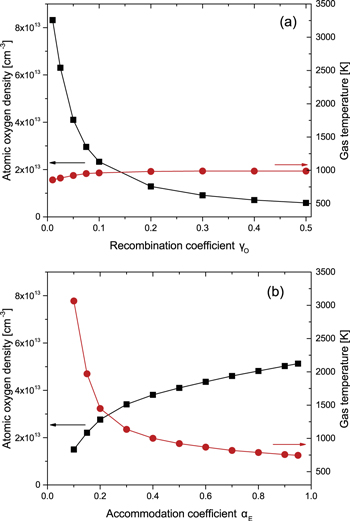
Figure 3. Ground state atomic oxygen density and gas temperature at the radial and axial centre of the simulation as a function of (a) γO for αE = 0.5 and (b) αE for γO = 0.05 (p = 10 mTorr, P = 500 W).
Download figure:
Standard image High-resolution imageUnder the low pressure conditions considered here, where the mean free path between gas phase collisions is long, the diffusion of oxygen atoms to the reactor walls is rapid and as a result wall losses are the dominant destruction pathway of atomic oxygen since the rate of gas-phase reactions is low. As such, even relatively small changes in γO can lead to significant changes in the atomic oxygen density as shown here. This is particularly true at low values of γO where the density of atomic oxygen changes rapidly with varying γO. As γO is increased the loss of atomic oxygen to the walls transitions from being limited by the rate of surface recombination at the walls at low γO to being limited by the rate of diffusion towards the walls at high γO. This trend is approximately in accordance with the formula developed by Chantry [87] for the surface loss rate of active species in low pressure gases and the conclusions of other previous work [29] which suggest that atomic species densities scale with 1/γO under low pressure conditions.
The small increase in the gas temperature with increasing γO is a result of the increasing density of molecular oxygen, both in the ground and metastable states, as the contribution of atomic oxygen to the overall gas density decreases. This results in a higher rate of dissociation per unit volume and thus greater thermal energy deposition through the production of oxygen atoms with high translation energies by the Franck Condon effect, as discussed earlier.
The ground state atomic oxygen density and gas temperature at the radial and axial centre of the simulation as a function of the thermal energy accommodation coefficient αE for γO = 0.05 are shown in figure 3(b). The atomic oxygen density is also dependent on the value of αE, increasing from 1.5 × 1013 cm−3 to around 5.1 × 1013 cm−3 as αE is increased from 0.1 to 0.95. Under this range the degree of dissociation (i.e. the density of atomic oxygen divided by the total gas density) decreases slightly as αE is increased from 0.1 to 0.3 and remains approximately constant for the remainder of the range. The initial decrease in dissociation degree with increasing αE is a result of the decreasing electron temperature as shown in figure 4(b). This leads to a decreased rate coefficient for electron impact dissociation of molecular oxygen, thus decreasing the relative density of atomic oxygen. Overall, despite the decrease in dissociation degree with increasing αE between 0.1 and 0.3, the atomic oxygen density increases with αE as a result of higher total gas densities due to the lower gas temperatures.

Figure 4. Plasma potential and electron temperature temperature at the radial and axial centre of the simulation as a function of (a) γO for αE = 0.5 and (b) αE for γO = 0.05 (p = 10 mTorr, P = 500 W).
Download figure:
Standard image High-resolution imageAs expected, the gas temperature is more significantly affected by changes in the thermal energy accommodation coefficient αE than changes in γO, scaling approximately as 1/αE from 745 K at αE = 0.95 to 3065 K at αE = 0.1. This relationship is similar to that derived by Chantry [87] for the scaling of active species loss rates with their surface loss coefficients and reflects the fact that the dominant loss of thermal energy from the neutral species in the plasma is via interactions with the wall. As the value of αE decreases the loss of thermal energy from the neutral species transitions from a diffusion limited regime to a surface interaction limited regime. This dependence is analogous to the dependence of the atomic oxygen density on γO.
The change in the overall gas density with varying αE has consequences for other plasma parameters such as the plasma potential and electron temperature at the radial and axial centre of the simulation, as shown in figure 4(b). Both quantities decrease in a similar manner to the gas temperature with increasing αE. The mechanism behind these trends is an increase in the electron collision frequency caused by increasing gas density at higher values of αE. Higher electron collision frequencies lead to decreased electron losses to the walls via diffusion. This in turn means that the required positive ion losses to the walls, and consequently the ionization rate, are also decreased. As a result, the electron temperature decreases in order to fulfil the requirement for a lower ionization rate. This in turn leads to a decrease in the plasma potential which is typically proportional to the electron temperature. The same trends are produced by global models where the gas temperature is fixed as a constant and the gas pressure is increased, which causes a similar change in the overall gas density as considered here.
The values of the plasma potential and the electron temperature are affected to a smaller degree by the value of the atomic oxygen recombination coefficient γO for constant αE, shown in figure 4(a). The slight decrease in plasma potential and electron temperature with increasing γO is due to a small increase in the electron collision frequency with increasing γO as the atomic oxygen density decreases and molecular oxygen becomes the dominant component of the neutral gas. This is a result of the higher total electron impact cross section for molecular oxygen, in the ground or metastable states, than that of atomic oxygen due to the opportunity to excite vibrational and rotational modes.
The densities of charged species at the radial and axial centre of the reactor as a function of γO and αE are shown in figures 5(a) and (b) respectively. As γO increases the electron density decreases slightly, while the O− density increases. As a result, the electronegativity (i.e. the density of negative ions divided by that of electrons) increases from ≈ 0.4 to ≈ 1. Since the power deposition is constant the electron density is determined by the rate of power loss of individual electrons in atomic and molecular collisions, which in turn is determined by the electron temperature, Te. Te then depends on the mole fractions of the dominant collision partners, as discussed earlier. Under the conditions investigated in this work the dominant formation pathways for negative ions are through electron attachment to O2(X ), O2(a1Δg) and O2(b
 ) (R15–R17). These processes occur at similar rates, with electron attachment to O2(b
 ) being the dominant formation pathway. As γO increases the degree of dissociation decreases and the densities of O2(X
 ), O2(a1Δg) and O2(b
 ) increase. This results in increased negative ion formation through electron attachment which also acts as a loss channel for electrons. However, the total electron density will be sustained by requiring a constant power deposition.
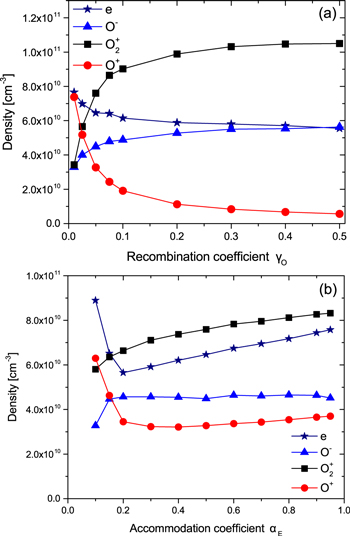
Figure 5. Charged particle densities at the radial and axial centre of the simulation as a function of (a) γO for αE = 0.5 and (b) αE for γO = 0.05 (p = 10 mTorr, P = 500 W).
Download figure:
Standard image High-resolution imageBy contrast, the total loss rate of negative ions remains comparatively constant with increasing γO. Under these conditions, detachment of electrons from O− by collisions with O2(a1Δg), O2(b ) and O(3P) (R35–R37) have a higher total contribution to the loss of O− than recombination with positive ions (R32–R34) over the entire range of γO. However, the contribution of recombination reactions to the total loss of O− increases with increasing γO so that recombination reactions account for ≈ 40% of total the total O− losses when γO = 0.5. As γO increases the dominant detachment process shifts from collisions with O(3P) to collisions with O2(b
 ). The role of O2(b
 ) in the detachment of negative ions in low pressure oxygen ICPs is consistent with the conclusions of previous work by Toneli et al [61]. The increasing importance of detachment collisions with O2(b
 ) at higher values of γO stems from the decreasing dissociation fraction while the gas density remains nearly constant, which means that the density of molecular oxygen in the ground and metastable states increases. Overall, the decrease in detachment collisions with O(3P) as γO is increased is compensated by the increase in detachment collisions with O2(b
 ), which results in the total loss rate of O− remaining relatively constant. The increase in the density of O− with increasing γO is therefore determined by the increase in the electron attachment processes, in particular that involving O2(b
 ).
).
The variation of the densities of  and O+ with increasing γO is consistent with the decrease in the density of atomic oxygen, which provides the dominant source of O+, and the increase in the density of molecular oxygen, which provides the dominant source of
  The total positive ion density remains approximately constant with increasing γO.
As the thermal energy accommodation coefficient αE increases from 0.1 to 0.2 the electron density decreases. With a constant power deposition, the electron density is determined by the volume integral of neRE(Te)N, where RE is the rate coefficient for electron power loss and N is the gas density. With the increase in gas density and moderate change in RE(Te), the electron density decreases. Over the same range of αE the density of O− increases as a result of the increased electron attachment rate as the density of molecular oxygen, in both the ground and metastable states, increases. As αE increases above 0.2 the electron collision frequency continues to increase causing electrons to be more effectively confined to the centre of the reactor which results in an increase in the central electron density.
Conversely, for αE ≥ 0.2 the density of O− remains approximately constant as the rate of electron attachment to oxygen molecules increases at a similar rate to the rate of electron detachment from O− with increasing gas density. The density of  ions at the centre of the reactor increases with αE due to the increasing ion-neutral collision frequency as the gas density is increased. This results in enhanced confinement of ions at the centre of the reactor. The density of O+ ions at αE ≥ 0.2 increases slowly with increasing αE, behaving similarly to
  over the same range. However, from αE = 0.1 to αE = 0.2 the density of O+ ions decreases due to a decrease in the dissociation degree, and a decrease in the ionization rate coefficient of atomic oxygen which occurs due to the decreasing electron temperature. The ionization rate of atomic oxygen, producing O+, is more sensitive to changes in electron temperature than the ionization rate of molecular oxygen, producing
  , as a result of the higher electron impact ionization threshold for atomic oxygen. This means that the density of O+ is more significantly affected by the change in electron temperature over this parameter range.
For surface processing applications the most relevant plasma parameters are species fluxes to surfaces where wafers are placed and treated, rather than plasma bulk properties in themselves. Figure 6 shows the ion energy distribution functions (IEDFs) for  and
and  , as calculated by the PCMCM, for several combinations of αE and γO. Figure 6(a) shows the IEDFs for γO = 0.01 and 0.5 (αE = 0.5). The IEDFs shown are integrated over all angles of ion impact. At γO = 0.01 the IEDFs of
  and O+ are similar in both the total flux and average energy with the peak in ion flux occurring at an energy approximately equal to the plasma potential. As γO is increased to 0.5 the total ion flux remains approximately the same, however, the flux of
  becomes greater than that of O+. This is a result of lower atomic oxygen densities in the gas phase leading to decreased production of O+, whose dominant formation pathway is through direct electron impact ionization of atomic oxygen. The small decrease in the energy at the peak in ion flux is as a result of the decrease in plasma potential with increasing γO shown in figure 4(a).

Figure 6. Ion energy distribution functions for  and O+ at the wafer holder for (a) γO = 0.01 and 0.5 (αE = 0.5) and (b) αE = 0.1 and 0.9 (γO = 0.05) (p = 10 mTorr, P = 500 W).
Download figure:
Standard image High-resolution imageFigure 6(b) shows the IEDFs for αE = 0.1 and 0.9 (γO = 0.05). The IEDFs for αE = 0.1 exhibit a peak in ion flux at higher energy than those for αE = 0.9. This is a result of the higher plasma potential at lower αE, as shown in figure 4(b). The IEDFs at αE = 0.1 also exhibit a smaller spread in ion energies. The reason for this is that ions experience fewer collisions with neutral species on transit to the surface due to the lower neutral gas density at low values of αE. In addition, the relative contribution of O+ to the total ion flux decreases as αE is increased. This is a result of the lower dissociation degree and electron impact ionization rate for atomic oxygen at higher values of αE discussed previously, leading to decreased O+ production and thus lower fluxes of O+.
The total fluxes of  , O+ and ground state atomic oxygen at the wafer holder as a function of γO for αE = 0.5 are shown in figure 6(a). Here, the fluxes of
  and O+ are almost equal for γO = 0.01 but diverge as γO is increased with the flux of
  increasing and the flux of O+ decreasing. The trend in the neutral atomic oxygen flux to the wafer holder is similar to that for O+ with increasing γO. These trends are consistent with the variation in the gas phase atomic oxygen density with increasing γO discussed earlier.
The total fluxes of  , O+ and ground state atomic oxygen at the wafer holder as a function of αE for γO = 0.05 are shown in figure 7(b). As αE increases from 0.1 to 0.3 the fluxes of both ions to the wafer holder decrease and remain approximately constant with increasing αE thereafter. The more significant decrease in the flux of O+ compared to that of
  is as a result of the decrease in the rate coefficients for electron impact dissociation and ionization with decreasing electron temperature as αE increases leading to a lower degree of dissociation and O+ density. The flux of
  to the wafer holder does not correlate directly with the density of
  at the reactor centre, shown in figure 5(b). This is a result of the changing shape of the
  density profile as the ion-neutral collision frequency increases with increasing αE, meaning that the relationship between the ion density at the centre of the reactor and the ion flux to the wall changes as a function of αE. The atomic oxygen flux to the wafer holder increases with increasing αE consistent with the higher atomic oxygen densities at the reactor centre at larger values of αE due to the higher total gas density.

Figure 7. Positive ion and atomic oxygen fluxes to the wafer holder as a function of (a) γO for αE = 0.5 and (b) αE for γO = 0.05 (p = 10 mTorr, P = 500 W).
Download figure:
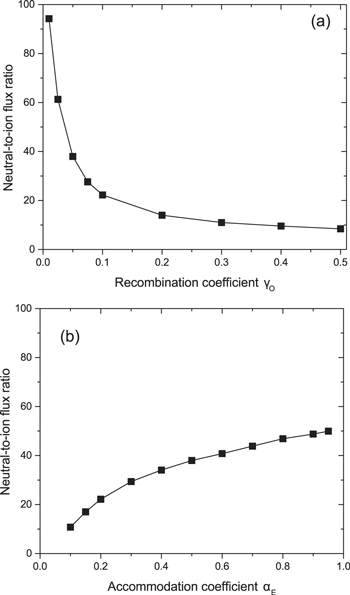
Standard image High-resolution imageThe reactive neutral-to-ion flux ratio at the wafer holder as a function of γO for αE = 0.5 is shown in figure 8(a) and the reactive neutral-to-ion flux ratio at the wafer holder as a function of αE for γO = 0.05 is shown in figure 8(b). Here, the ion flux is defined as the sum of the fluxes of both  and O+. In both cases the trend in neutral-to-ion flux ratio approximately follows the respective trend of the ground state atomic oxygen flux. The neutral-to-ion flux ratio is shown to vary over a range of 94 to 8 with increasing γO and between 10 and 50 with increasing αE.
Figure 8. Reactive neutral-to-total ion flux ratio at the wafer holder as a function of (a) γO for αE = 0.5 and (b) αE for γO = 0.05 (p = 10 mTorr, P = 500 W).
Download figure:
Standard image High-resolution image
It has previously been predicted by Brichon et al via molecular dynamics simulations of chlorine plasma etching of silicon that the damaged layer thickness on an etched surface, a critical parameter for atomic layer etching, is strongly dependent on the reactive neutral-to-ion flux ratio in the range considered here (i.e. 10–200) [45]. Specifically, it was found that higher neutral-to-ion flux ratios were favourable to minimise damaged layer thickness. Since the chemistry used in this work is different, the results of the study by Brichon et al cannot be directly applied here, but it is reasonable to expect that similar dependencies are possible when using plasmas produced in oxygen, as considered here, or in other gases, for atomic layer processes. In this context, it is expected that reactor walls with very low atomic species recombination coefficients and high thermal energy accommodation coefficients should be favourable for minimising damaged layer thickness in such applications. These conditions have the additional advantage of offering low ion bombardment energies, which are advantageous for certain processes, due to the dependence of the plasma potential on αE. A potential disadvantage of operating in this parameter regime is that the neutral flux, and neutral-to-ion flux ratio are very sensitive to changes in γO, meaning that the outcomes of plasma processes may be sensitive to small changes in wall condition.
4. Conclusions
The dependence of the plasma bulk properties and fluxes to the wafer holder on the atomic oxygen surface recombination coefficient γO and the thermal energy accommodation coefficient αE in a low pressure inductively coupled oxygen plasma have been investigated using two-dimensional fluid-kinetic plasma simulations. It has been shown that the thermal energy accommodation coefficient has significant influence on most of the plasma properties investigated through its role in determining the neutral gas temperature and consequently the neutral gas density. The primary role of the atomic oxygen recombination coefficient is in determining the atomic oxygen density and its flux at the wafer holder in combination with the reactive neutral-to-ion flux ratio at the wafer holder. The greatest sensitivity of the plasma parameters to αE and γO occurs when the value of each coefficient is low. This is as a result of the transition from diffusion limited losses of atomic oxygen and thermal energy to surface interaction limited losses as the value of each coefficient is decreased. The trends presented offer insight into the roles played by both investigated coefficients in low pressure plasmas used in industry. In particular, the thermal energy accommodation coefficient has been shown to be an important input parameter in plasma simulations which warrants further study, both experimentally and computationally.
Acknowledgments
This work has been done within the LABEX Plas@Par project, and received financial state aid managed by the 'Agence Nationale de la Recherche', as part of the 'Programme d'Investissements d'Avenir' under the reference ANR-11-IDEX-0004-02. Funding through UK EPSRC (EP/ K018388/1) and the York-Paris Low Temperature Plasma Collaborative Research Centre is also acknowledged. The work of MJK was supported by the US Department of Energy Office of Fusion Energy Science and the US National Science Foundation. This work was supported by the Applied Materials University Research Partnership Programme.