Article

Magnesium Nanoparticle Synthesis from Powders via Pulsed Laser Ablation in Liquid for Nanocolloid Production

1
I-Form, Advanced Manufacturing Research Centre, D04 V1W8 Dublin, Ireland
2
EPSRC & SFI Centre for Doctoral Training (CDT) in Advanced Metallic Systems, Sheffield S10 2JA, UK
3
Advanced Processing Technology Research Centre, School of Mechanical & Manufacturing Engineering, Electronic Engineering, and Chemical Sciences, Dublin City University, Glasnevin, D09 NA55 Dublin, Ireland
4
Oriel Sea Salt Ltd., Clogherhead, A92 V97C Drogheda, Ireland
*
Author to whom correspondence should be addressed.
Appl. Sci. 2021, 11(22), 10974; https://doi.org/10.3390/app112210974
Submission received: 22 October 2021 / Revised: 15 November 2021 / Accepted: 16 November 2021 / Published: 19 November 2021
(This article belongs to the Special Issue Advances in Flexible Electronics toward Wearable Sensing)

Abstract

:
Magnesium nanoparticles of various mean diameters (53–239 nm) were synthesised in this study via pulsed laser ablation in liquid (PLAL) from millimetre sized magnesium powders within isopropyl alcohol. It was observed via a 3 × 3 full factorial design of experiments that the processing parameters can control the nanoparticle distribution to produce three size-distribution types (bimodal, skewed and normal). Ablation times of 2, 5, and 25 min where investigated. An ablation time of 2 min produced a bimodal distribution with the other types seen at higher periods of processing. Mg nanoparticle Ultraviolet–Visible spectroscopy (UV–Vis) absorbance at 204 nm increased linearly with increasing ablation time, indicating an increase in nanoparticle count. The colloidal density (mg/mL) generally increased with increasing nanoparticle mean diameter as noted via increasing UV–Vis absorbance. High laser scan speeds (within the studied range of 3000–3500 mm/s) tend to increase the nanoparticle count/yield. For the first time, the effect of scan speed on colloidal density, UV–Vis absorbance and nanoparticle diameter from metallic powder ablation was investigated and is reported herein. The nanoparticles formed dendritic structures after being drop cast on aluminium foil as observed via field emission scanning electron microscope analysis. Dynamic light scattering was used to measure the size of the nanoparticles. Magnesium nanoparticle inks show promise for use in the fabrication conductive tracks or thermal insulation in electronics.

1. Introduction

Pulsed laser ablation in liquid (PLAL), also termed laser ablation synthesis in solution (LASIS), is a process by which nanoparticles are produced from bulk material via the irradiation of the bulk material submerged in a liquid medium (usually DI water) [1,2,3,4]. The bulk material can be in the form of a cylindrical rod, thin films or powders. Thin films and powders have advantages over rods including increased surface area and reduced energy losses due to thermal diffusion on the material surface. The main disadvantage of PLAL of powders is the need to take extra care when collecting the resulting colloid such that the powders are not included in the nanocolloid, which may require additional processes such as centrifugation and filtration that may cause the loss of some of the nanoparticles. PLAL has gained much attention in the literature due to its environmentally friendly nature and the ability to control the nanoparticle mean diameter size and type of size distribution (e.g., normal distribution or bimodal distribution). PLAL enables a precise control of nanoparticle size, count and colloidal density (mg/mL) by controlling the processing parameters such as laser fluence (J/cm2), repetition rate (kHz), scan speed (mm/s), pulse width (ps), wavelength (nm) and ablation time (min). Other processing parameters that influence the PLAL process include the laser scan pattern (e.g., spiral or linear pattern) and hatch spacing (μm); however, little attention has been paid to these in the literature. One of the most important factors during PLAL is the choice of liquid medium. The liquid medium influences the nanoparticle size, yield (mg/mL), ablation efficiency (mg/s), nanoparticle size distribution type (e.g., normal vs. skewed distribution), morphology, chemical composition and surface morphology, all of which directly influence the electrical/mechanical properties of these nanoparticles which directly express their usefulness in wearable industries. DI water is the most used liquid medium during PLAL owing to its simplistic nature [5,6,7,8]. The as-fabricated colloid can be printed as a conductive ink on flexible material to fabricate flexible sensors [9] without the need of additional chemicals. Other liquid media have been used in PLAL including ethanol [10,11,12,13], isopropanol alcohol [14,15], 2- propanol [13] and methanol [16,17]. These organic liquids are also non-toxic and have an advantage of having a lower boiling point than water, enabling a quicker evaporation of the liquid medium during 3D printing (e.g., inkjet printing or aerosol jetting) or drop casting.
Various types of nanoparticles have been fabricated via PLAL including silver [18], copper [19] and magnesium [20,21,22]. Magnesium nanoparticles (Mg NPs) are of special interest in this report owing to their versatile uses. In 2020, Leonés et al. [23] reviewed the use of Mg/MgO/MgOH NPs in various fields including biomedical, micro-batteries, environmental (removal of heavy metals in water and air filtration), electronics and high-temperature uses. Mg NPs have gained so much attention in the literature owing to their diverse and excellent properties including high melting point (2852 °C for MgO), low density, biocompatibility, high specific strength, stiffness, electrical conductivity, absorption of vibrations, plasmonic effects and anti-bacterial effects [23,24,25].
Beginning with Mg NPs uses in biomedical applications, Mg is used in commercial wound healing products due to its cell growth-promoting effects [26]. Additionally, Mg NPs (or MgO NPs) have been used in developing sensors for cholera detection [27]. Magnesium tablets/gels have been sold for decades in shops and pharmacies (without requiring a prescription) for improving bone/joint health, fighting illnesses associated with menopause, fighting against heart disease and fighting against constipation just to mention a few. In fact, Mg is involved in over 300 chemical reactions in the human body [26], making it a requisite mineral/metal for the body. Mg is used in medicine and hygiene products owing to its anti-bacterial effects, low toxicity (biocompatibility) and low cost (due to high abundance). In a report in 2021 by Nakamura et al. [28], MgOH NPs were proven to have the ability to kill bacterial cells (Escherichia coli), a result confirmed via SEM analysis. The researchers experimented with various nanoparticle sizes, coming to the conclusion that nanoparticles of a size around 75 nm showed the best anti-bacterial effects. The aforementioned point indicates the need for a nanoparticle-fabrication process with precise nanoparticle size control such as PLAL. Wearables are becoming increasingly useful tools for people with health conditions such as diabetes and heart disease. They can help people keep track of their medical data and provide a personalised view of their condition. The advances in miniaturisation of electronic components and biosensors have led to the development of wearable devices that can collect data about their environment. Wearable devices that can collect medical data are becoming more prevalent in the Internet of Things, enabling doctors to remotely monitor patients and easily store data. Furthermore, Mg NPs are used to enhance mechanical properties in composites. Metallic nanoparticles in general are extensively used in 3D/4D printing [24,29] and the development of flexible electronics [25,30] for the enhancement of mechanical/electrical properties.
Lastly, MgO has been used in electronics for insulation applications due to its low heat capacity and high melting point [31]. Mg NPs have plasmonic effects; additionally, Mg is fully biocompatible and is ranked as the fourth most common element on Earth, making it a good candidate for plasmonics [32]. Due to the rate of population/economic growth, the world energy consumption is estimated to double [33,34]; therefore, research on clean energy sources such as magnesium-based batteries has gained much attention in the literature. Magnesium-based batteries were reviewed in a report published in 2021 [34]. Magnesium has gained this interest in battery technology owing to its high theoretical volumetric capacity (i.e., 3833 mAh cm−3 vs. 2046 mAh cm−3 for lithium), and dendrite-free attribute when used as an anode during cycling [34]. Magnesium is a promising product for the replacement of lithium for batteries, with Mg being more than 10,000 times more abundant than Li in the Earth’s crust. In 2020, a group of researchers reported a hydrogen sensor composed from nano-blocks of magnesium [35]. Magnesium undergoes a phase transition to a dielectric material upon absorbing hydrogen and the research team utilised this special property as a sensing mechanism. The far-field scattering distribution of the sensor varies after exposure to hydrogen. In another report, MgO NPs were used as a coating layer to improve the efficiency of dye-sensitised solar cells owing to their wide bandgap [36]. Furthermore, an increase in environmental pollutants and the awareness thereof has led to a rapid increase in research concerning environmental rescue. Adsorption has been extensively used as a means to eliminate organophosphates, metal ions (e.g., Pb and Cd ions) and dyes in waste water [37,38,39].
Herein the fabrication of clean Mg NPs with controllable sizes via the variation of processing parameters such as laser fluence, scan speed and ablation time is presented. To our knowledge, this is the first report to analyse Mg NP size distributions and morphologies synthesised via PLAL in IPA from powders using a picosecond Nd:YAG laser system. This report is the first to investigate the effect of scan speed on PLAL of metallic powders. The laser scan speed is an important factor during PLAL and has not been reported extensively in the literature.

2. Materials and Methods

2.1. Design of Experiments (DOE) and Sample Preparation

Magnesium powder (99% purity, 0.06–0.3 mm diameter supplied from Sigma Aldrich Ireland Limited, Wicklow, Ireland) was ablated at various laser fluences, ablation times and scan speeds as shown in Table 1. Table 1 shows a 3 × 3 full factorial design of experiments (DOE). Three repeat experiments (n = 3) were conducted for each sample set, making it a total of 81 samples (27 × 3). Ablations were performed by an Nd:YAG laser system (WEDGE HF 1064, Bright Solutions) with pulses centred at 1064 nm. Three ablation durations were investigated (2, 5 and 25 min). Three laser fluences were investigated (1.83, 1.88, 1.91 J/cm2) and three laser scan speeds were investigated (3000, 3250 and 3500 mm/s). All experiments were conducted at a repetition rate of 10 kHz and a pulse width of 600 ps. These parameters were chosen after preliminary experiments which showed that the magnesium nanoparticle yield was high within these parameters. DI water is the most commonly used liquid for PLAL; however, water reacts with magnesium which affects the ablation process especially when powders are used (foam and bubbles are produced when water reacts with Mg powder). Therefore, a simple organic solvent called isopropyl alcohol (IPA) was used. Ethanol was also investigated; however, IPA was more compatible with the powder (the powder settled down the bottom of the liquid much faster even after vigorous mixing and showed no mixing/reactivity with the powder). A thin powder layer (2 mm thickness) was carefully placed and evenly spread on the bottom of a glass beaker (60 mm diameter). A 3 mm height of liquid (IPA) above the powder layer was ensured for each sample. Fresh powder was used for each ablation experiment. The laser scanning pattern was in a spiral shape (outer diameter of 55 mm) with a hatch spacing of 50 μm. Each PLAL experiment was carefully timed using a stopwatch and the resulting nanocolloid was immediately collected by carefully pipetting some of the colloid (5 mL) on top of the remaining powder using a standard plastic pipette, ensuring that no powder particles (large particles) were collected. The as-collected colloid was used in characterisation processes without any filtration process to demonstrate the simplistic nature of PLAL and also to observe the effects of processing parameters alone without additional processing steps.

2.2. Dynamic Light Scattering (DLS)

Dynamic light scattering (DLS) characterisation experiments were conducted via a Zetasizer Nano ZS system (Malvern Instruments Ltd, Malvern, United Kingdom.) on each sample immediately after PLAL experiments. Twenty runs/measurements on the DLS machine were conducted per sample and averaged, outputting raw data of nanoparticle size distribution per sample and nanoparticle mean diameter.

2.3. Ultraviolet–Visible Spectroscopy (UV–Vis)

A volume of 1 mL of each sample was diluted by 2 mL of IPA immediately after DLS analysis for ultraviolet–visible spectroscopy (UV–Vis). Twenty runs/measurements per sample were taken and averaged. The dilution is necessary to avoid saturation in the UV–Vis spectrum which makes it difficult/impossible to discover distinct peaks especially in highly concentrated nanocolloids. UV–Vis spectroscopy was conducted with a Varian Cary 50 UV–Vis spectrophotometer using a quartz cuvette (10 mm path length, Helma). The scan range was 190–900 nm with a scan rate of 600 nm/min. All the optical spectra were corrected for IPA absorption by subtracting the contribution of IPA from the recorded spectrum. UV–Vis was used to verify the presence of magnesium nanoparticles and as a measure of the nanoparticle count.

2.4. Scanning Electron Microscopy (SEM)

Field emission scanning electron microscopy (FESEM) (5–30 kV excitation voltages) was used to study the morphology of the dried nanoparticles. A volume of 1 mL of the as-synthesised nanocolloid was drop casted on aluminium foil and the liquid medium evaporated in air, leaving the nanoparticles on the aluminium foil.

2.5. Analytical Mass Balance

A laboratory analytical mass balance with 4 decimal places precision (FisherbrandTM Balances Precision & Analytical Series) was used to measure the mass of 1 mL of each of the 81 colloidal samples. The density of the colloid was calculated according to Equation (1).
Colloidal   density ( mg / mL ) = mass   of   1   mL   of   colloid 1   mL  

3. Results and Discussion

3.1. Effect of Laser Processing Parameters on Nanoparticle Count/Yield, Colloidal Density, Mean Diameter and Size Distribution

The nanoparticle UV–Vis absorbance at 204 nm (this peak is observed for all 81 samples), mean diameter, and colloidal density (mg/mL) are shown in Figure 1, Figure 2, Figure 3, respectively, for each of the 27 sample groups. It was observed that all the inputs (ablation time, fluence and scan speed) have some influence on the outputs (nanoparticle size distribution, mean nanoparticle diameter, absorbance and colloidal density (mg/mL)). This section will examine the effect of each input on the outputs individually. The section will examine the trends in nanoparticle size distributions; particularly three types of distributions were observed: normal, positively skewed and bimodal distributions. Figure 1 shows a clear pattern in absorbance and sample number. This is attributed to ablation time; the absorbance increases with ablation time at any combination of processing parameters examined in this study as per the 3 × 3 full factorial DOE (Table 1). A high absorbance is an indication of a high number of nanoparticles. The scan speed and the fluence do not affect the UV–Vis absorbance of the colloids as much as ablation time; however, they still have an effect as evident by comparing various samples synthesised at the same ablation time showing different absorbance values (e.g., samples 3 and 27 in Figure 1). The overall absorbance seems to increase from left to right signifying proportionality with laser fluence which increases after every nine samples (see Table 1 for DOE). A general increase in absorbance is observed from left to right in Figure 1 demonstrating a direct proportionality with scan speed which increases after every three samples (for every nine samples from left to right).
It was discovered that the colloidal density tends to be affected by larger particles; this will be discussed in the sections that follow. Figure 2 demonstrates that similar colloidal densities can be achieved by multiple combinations of processing parameters, e.g., samples 10 and 11 had mean densities of 691 and 692 mg/mL, respectively, but different processing parameters were used. Incidentally, samples 10 and 11 have the same mean nanoparticle diameter of 101 nm (Figure 3). This is proof that the laser processing parameters have a combined effect on the nanoparticle size and yield.
The nanoparticle mean diameter for each of the 81 samples ranged from 53 to 239 nm. The average of mean nanoparticle diameter per sample group (1–27) ranged from 77 to 171 nm. The mean nanoparticle diameter per sample group is shown in Figure 3. IPA is clear in colour but the colloid had a yellow colour after PLAL experiments due to the presence of magnesium nanoparticles (Mg NPs) due to their plasmonic effects.

3.1.1. Ablation Time

Three ablation times (2, 5, 25 min) were studied and their effects on UV–Vis absorbance (nanoparticle yield), colloidal density (mg/mL) and nanoparticle mean diameter are examined in the sections that follow. Samples are categorised in sets of 3 (samples 1,2,3 in one set, 4,5,6 in another set, etc.) such that the only variable in each set is the ablation time. This enables us to individually study the ablation time while also observing the effects of other parameters (refer to Table 1 for the DOE). The ablation time influences the nanoparticle yield and diameter. The colour and colour-intensity of the resulting nanocolloid depends on both the nanoparticle mean size (due to plasmonic effects) and nanoparticle yield (population of nanoparticles).

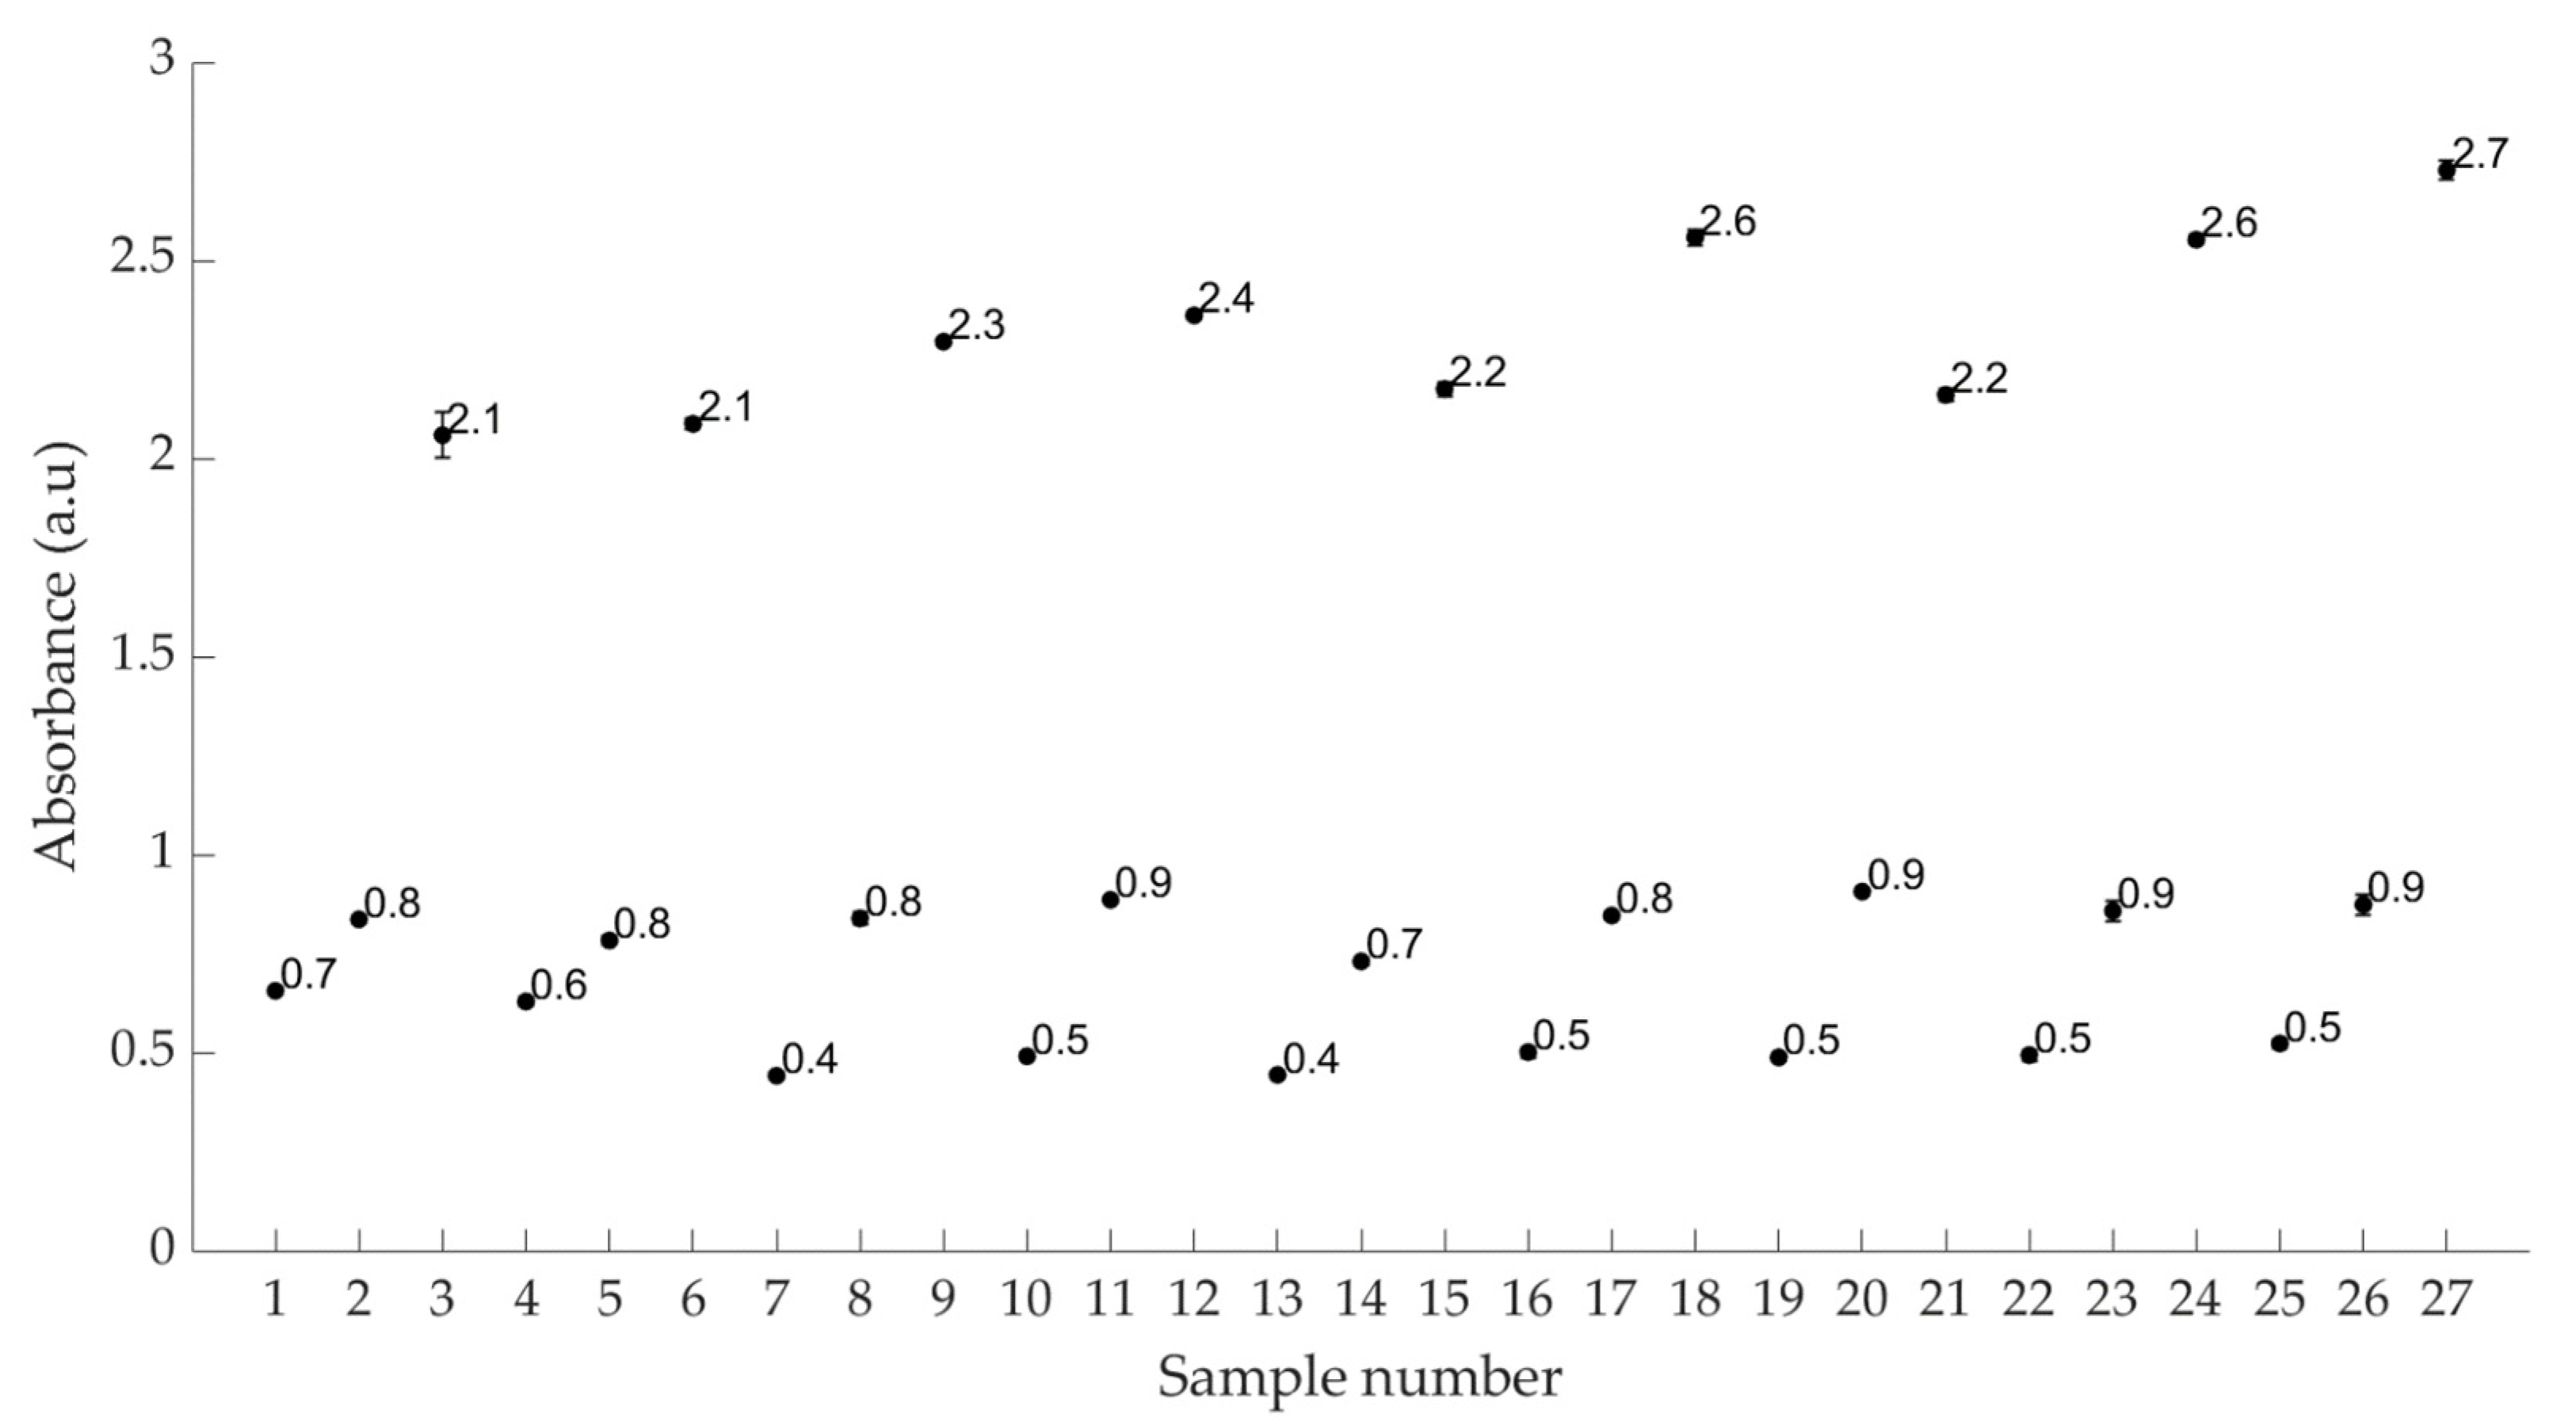
Effect of Ablation Time on UV–Vis Absorbance (Nanoparticle Yield)

All UV–Vis curves for the 81 samples showed a similar distinct large peak 204 nm and differed in absorbance. The difference in absorbance at this peak was used to compare the samples. A typical UV–Vis curve of a magnesium colloid is shown in Figure 4e. The absorbance increases linearly with ablation time (Figure 1), regardless of the changes in other processing parameters (fluence and/or scan speed). This is an important property to discover, thus we can conclude that when a high nanoparticle yield is required without a major concern about nanoparticle size, a long ablation time is preferable, keeping in mind that a limit exists before shielding effects slow down ablation efficiency significantly. The average absorbance at 2, 5 and 25 min ablation time are 0.43, 0.70, 1.94, respectively. The average rate of change in absorbance between 2–5 min and 5–25 min ablation times are 0.089 and 0.062 a.u/min, respectively; thus, the ablation rate decreases with increased ablation time. This is attributed to shielding effects that cause primary/initial nanoparticles to absorb incoming laser photons, thereby shielding the laser from interacting with the powder to fabricate new (primary) nanoparticles. It is worth mentioning that the shielding effects reduced the ablation efficiency by about 30% when moving from 2–5 to 5–25 min, which is a promising result for batch mode PLA; the significance of this result is that we can still produce more nanoparticles at a decent rate even after 25 min of laser ablation without any flow of liquid required. This was supported by the high scan speeds (3000–3500 mm/s), large ablation paths supported by the spreading of the powder (55 mm outer diameter) and large hatch spacings (50 μm). Additionally, powders reduce energy losses due to increased surface area, thereby increasing ablation efficiency.

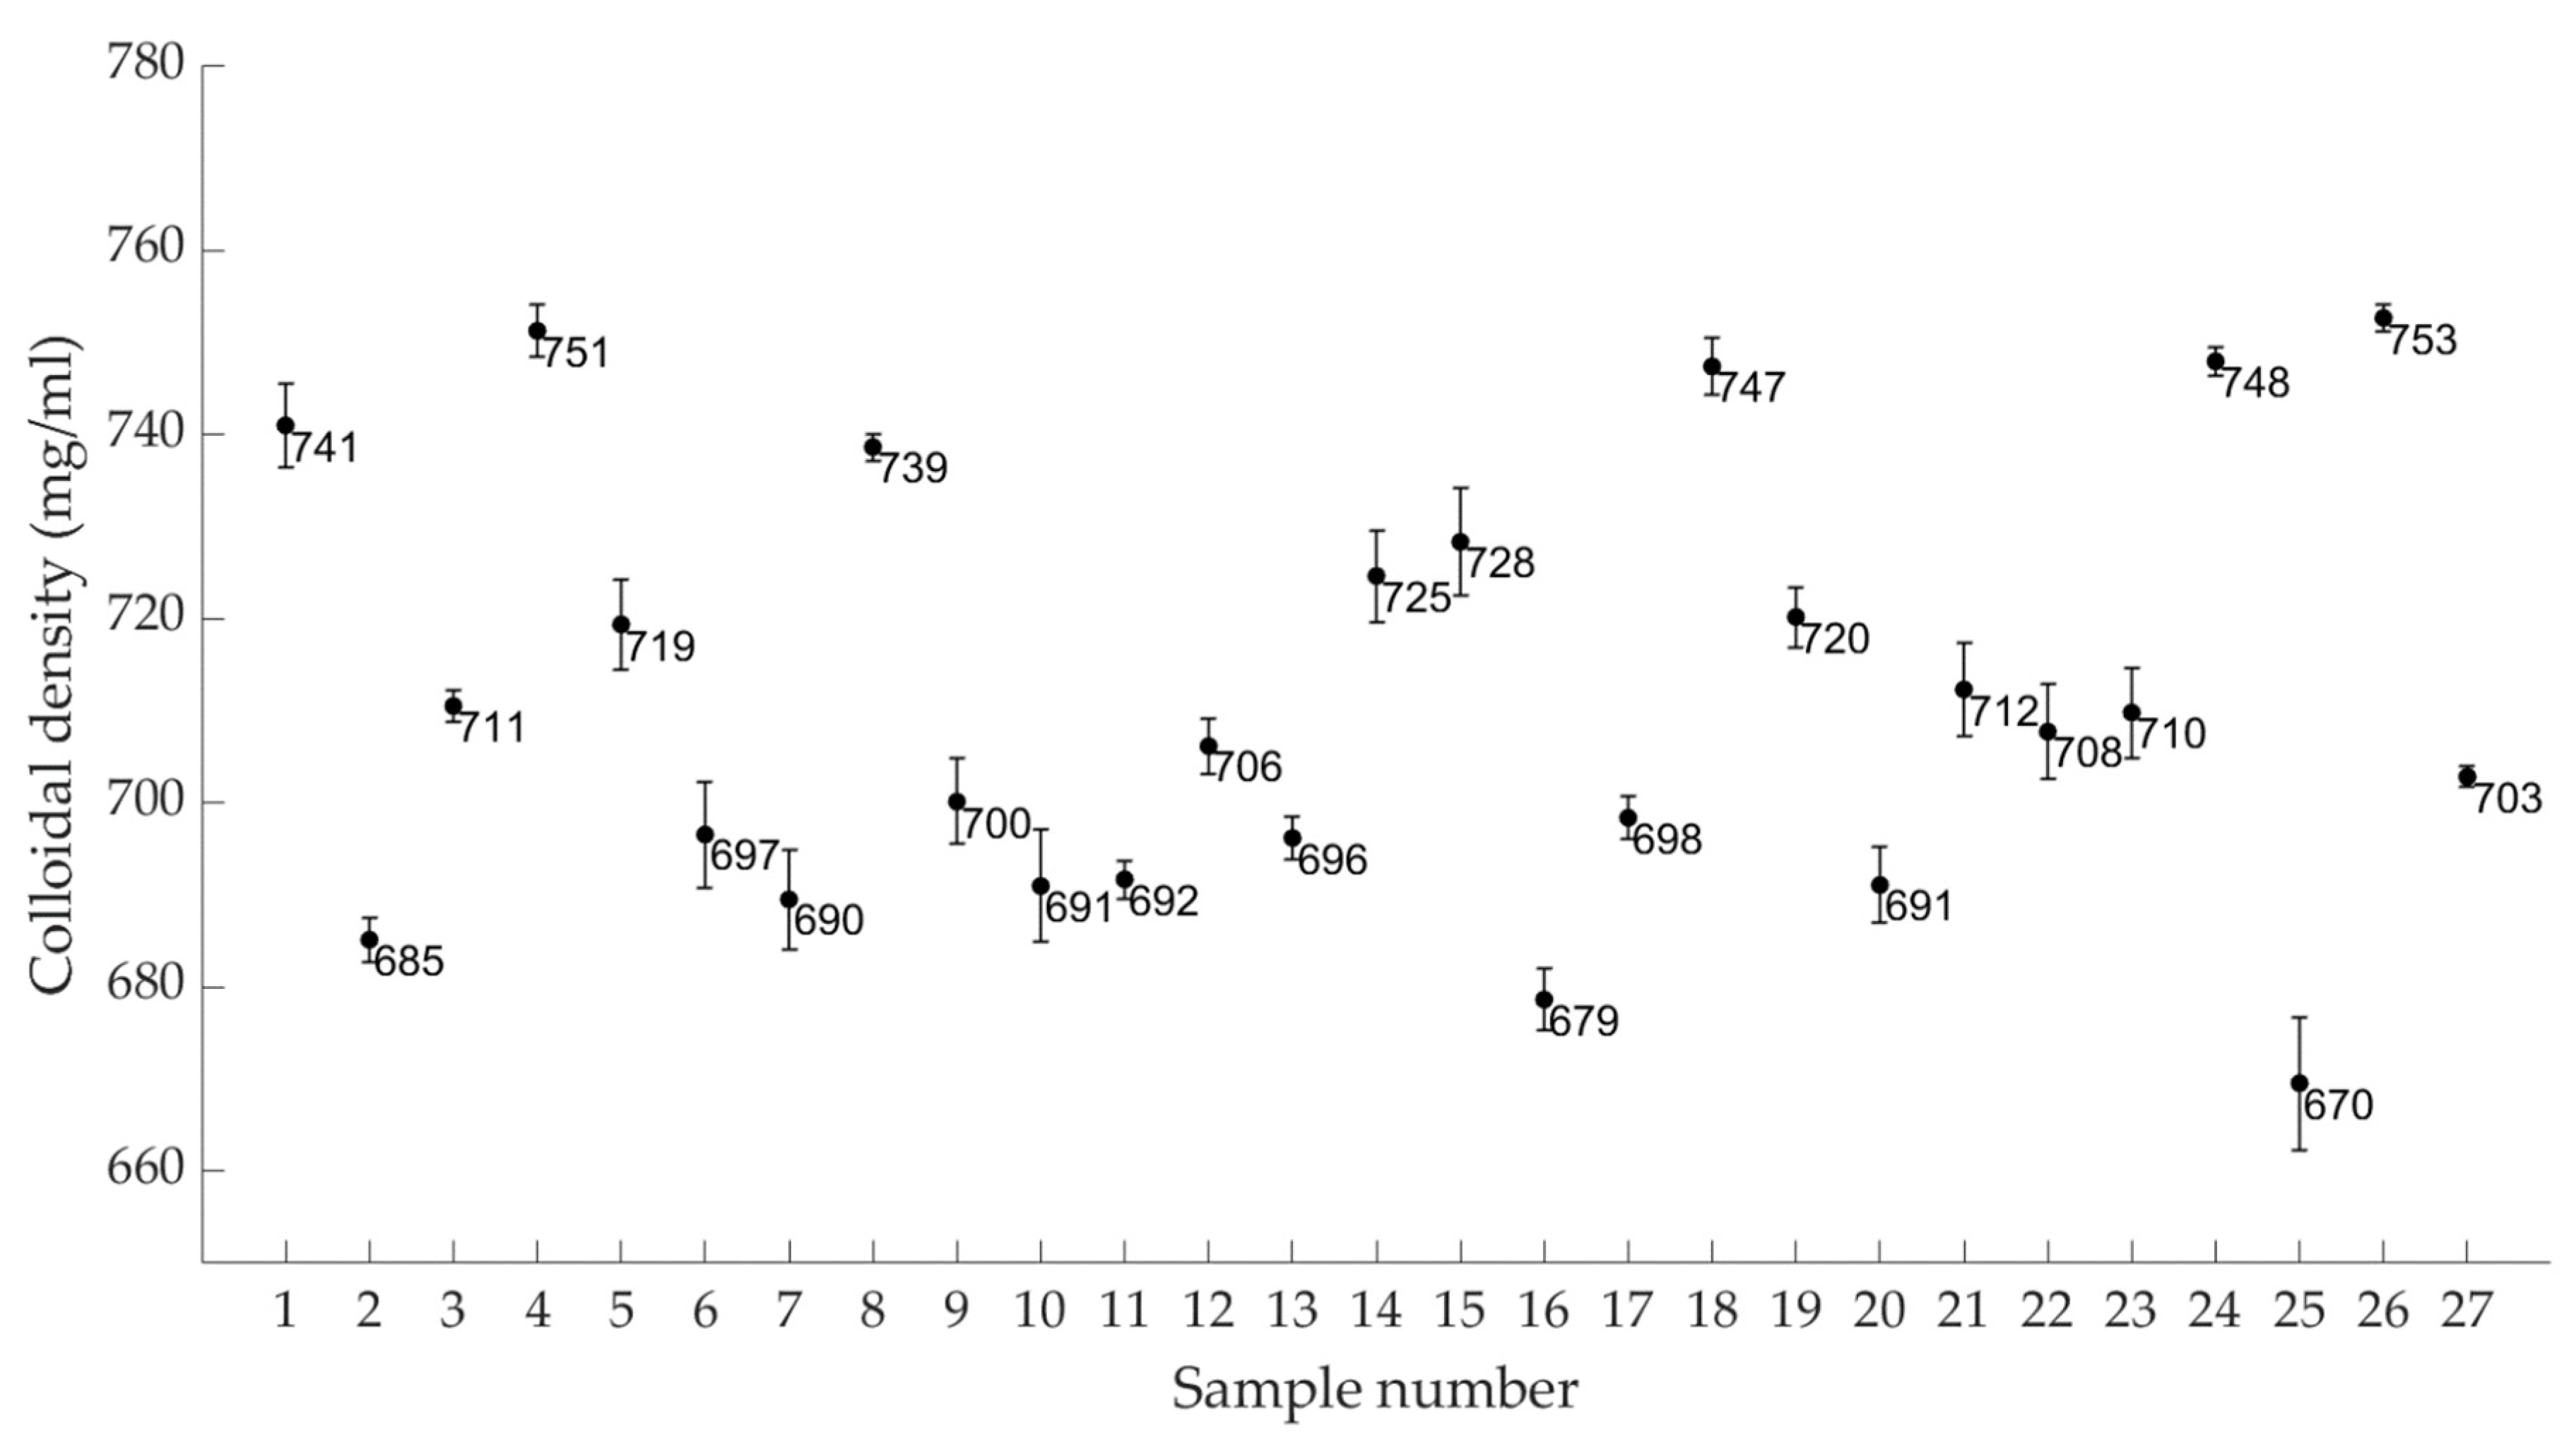
Effect of Ablation Time on Colloidal Density (mg/mL)

Another indicator for nanoparticle yield is colloidal density (mg/mL). A volume of 1 mL of each sample was weighted and the density was calculated according to Equation (1). Colloidal density per sample is shown in Figure 2; a general increase in in colloidal density with time is observed from 2 to 5 min of ablation time (six of nine sample sets exhibited this trend, see samples 7–8, 10–11, 13–14, 16–17, 22–23, and 25–26) with some samples showing a decrease (three of nine sample sets, see samples 1–2, 4–5, and 19–20). Similarly, a general increase in colloidal density is observed with an increase in ablation time from 5 to 25 min (six of nine sample sets exhibited this trend, see samples 2–3, 11–12, 14–15, 17–18, 20–21, and 23–24). In all cases (nine of nine sample sets, thus samples 1–2–3, 4–5–6, etc.), the rate of change of colloidal density with respect to time from 2 to 5 min is different to that from 5 to 25 min (magnitude and/or direction), signifying a shift in ablation efficiency. We can conclude that there is some correlation in colloidal density and ablation time; however, time is not the only factor affecting the density. Some correlation exists between the nanoparticle mean diameter size and colloidal density (compare Figure 1 and Figure 2). A higher colloidal density is generally observed at higher nanoparticle mean sizes. This can be attributed to the fact that larger nanoparticles are heavier and hence the colloidal density is higher. For instance, a colloid with a mean nanoparticle diameter of 50 nm will require twice the number of nanoparticles as a colloid with a mean diameter of 100 nm for it to have the same colloidal density. Comparing samples 26 and 27, the former has a larger mean nanoparticle diameter (132 nm) than the latter (95 nm). This led to a higher colloidal density for sample 26 (753 mg/mL) than for sample 27 (703 mg/mL). The same results are observed for other samples (e.g., samples 1–2–3–4–5–6, 8–9 and others). Thus, it can be generalised that a high colloidal density is caused by a large nanoparticle mean size. It is observed that some samples are not in agreement with this hypothesis (increase in nanoparticle mean diameter = increase in colloidal density)—for example, Sample 18. Sample 18 has a relatively low nanoparticle mean diameter (97 nm) yet with a high colloidal density. This can be explained by observing the UV–Vis data for this sample as shown in Figure 1; this sample has a high colloidal density due to the higher number of nanoparticles (high absorbance). The size distribution of this sample is positively skewed which means that is has a higher number of small particles than large ones. Other samples also exhibit low colloidal density but show a large nanoparticle mean size and low absorbance which is in agreement with the hypothesis (e.g., sample 13). The low absorbance signifies a low nanoparticle count and hence a low colloidal density. Additionally, the absence of colloidal filtration after PLAL experiments is a source of error during colloidal density analysis. Partially ablated powder particles (submicron particles) can be pipetted within the colloid for weigh measurements which raise the colloidal density. This is supported by observing the nanoparticle size distributions for sample 13 (see Supplementary Information Figure S1 whereby a small number of particles in the range of 300–600 nm are present (these particles are in the sub-micron range which is much smaller than the minimum size of the original powder (0.06 mm) which means that some powder particles were partially ablated/fragmented). SEM images of some samples also showed the presence of submicron particles which increase the colloidal density if unfiltered (see Figure 4f). It is worth noting that a significant number of nanoparticles is lost during filtration processes and the size of the filter may influence the result, which is why filtration was avoided.

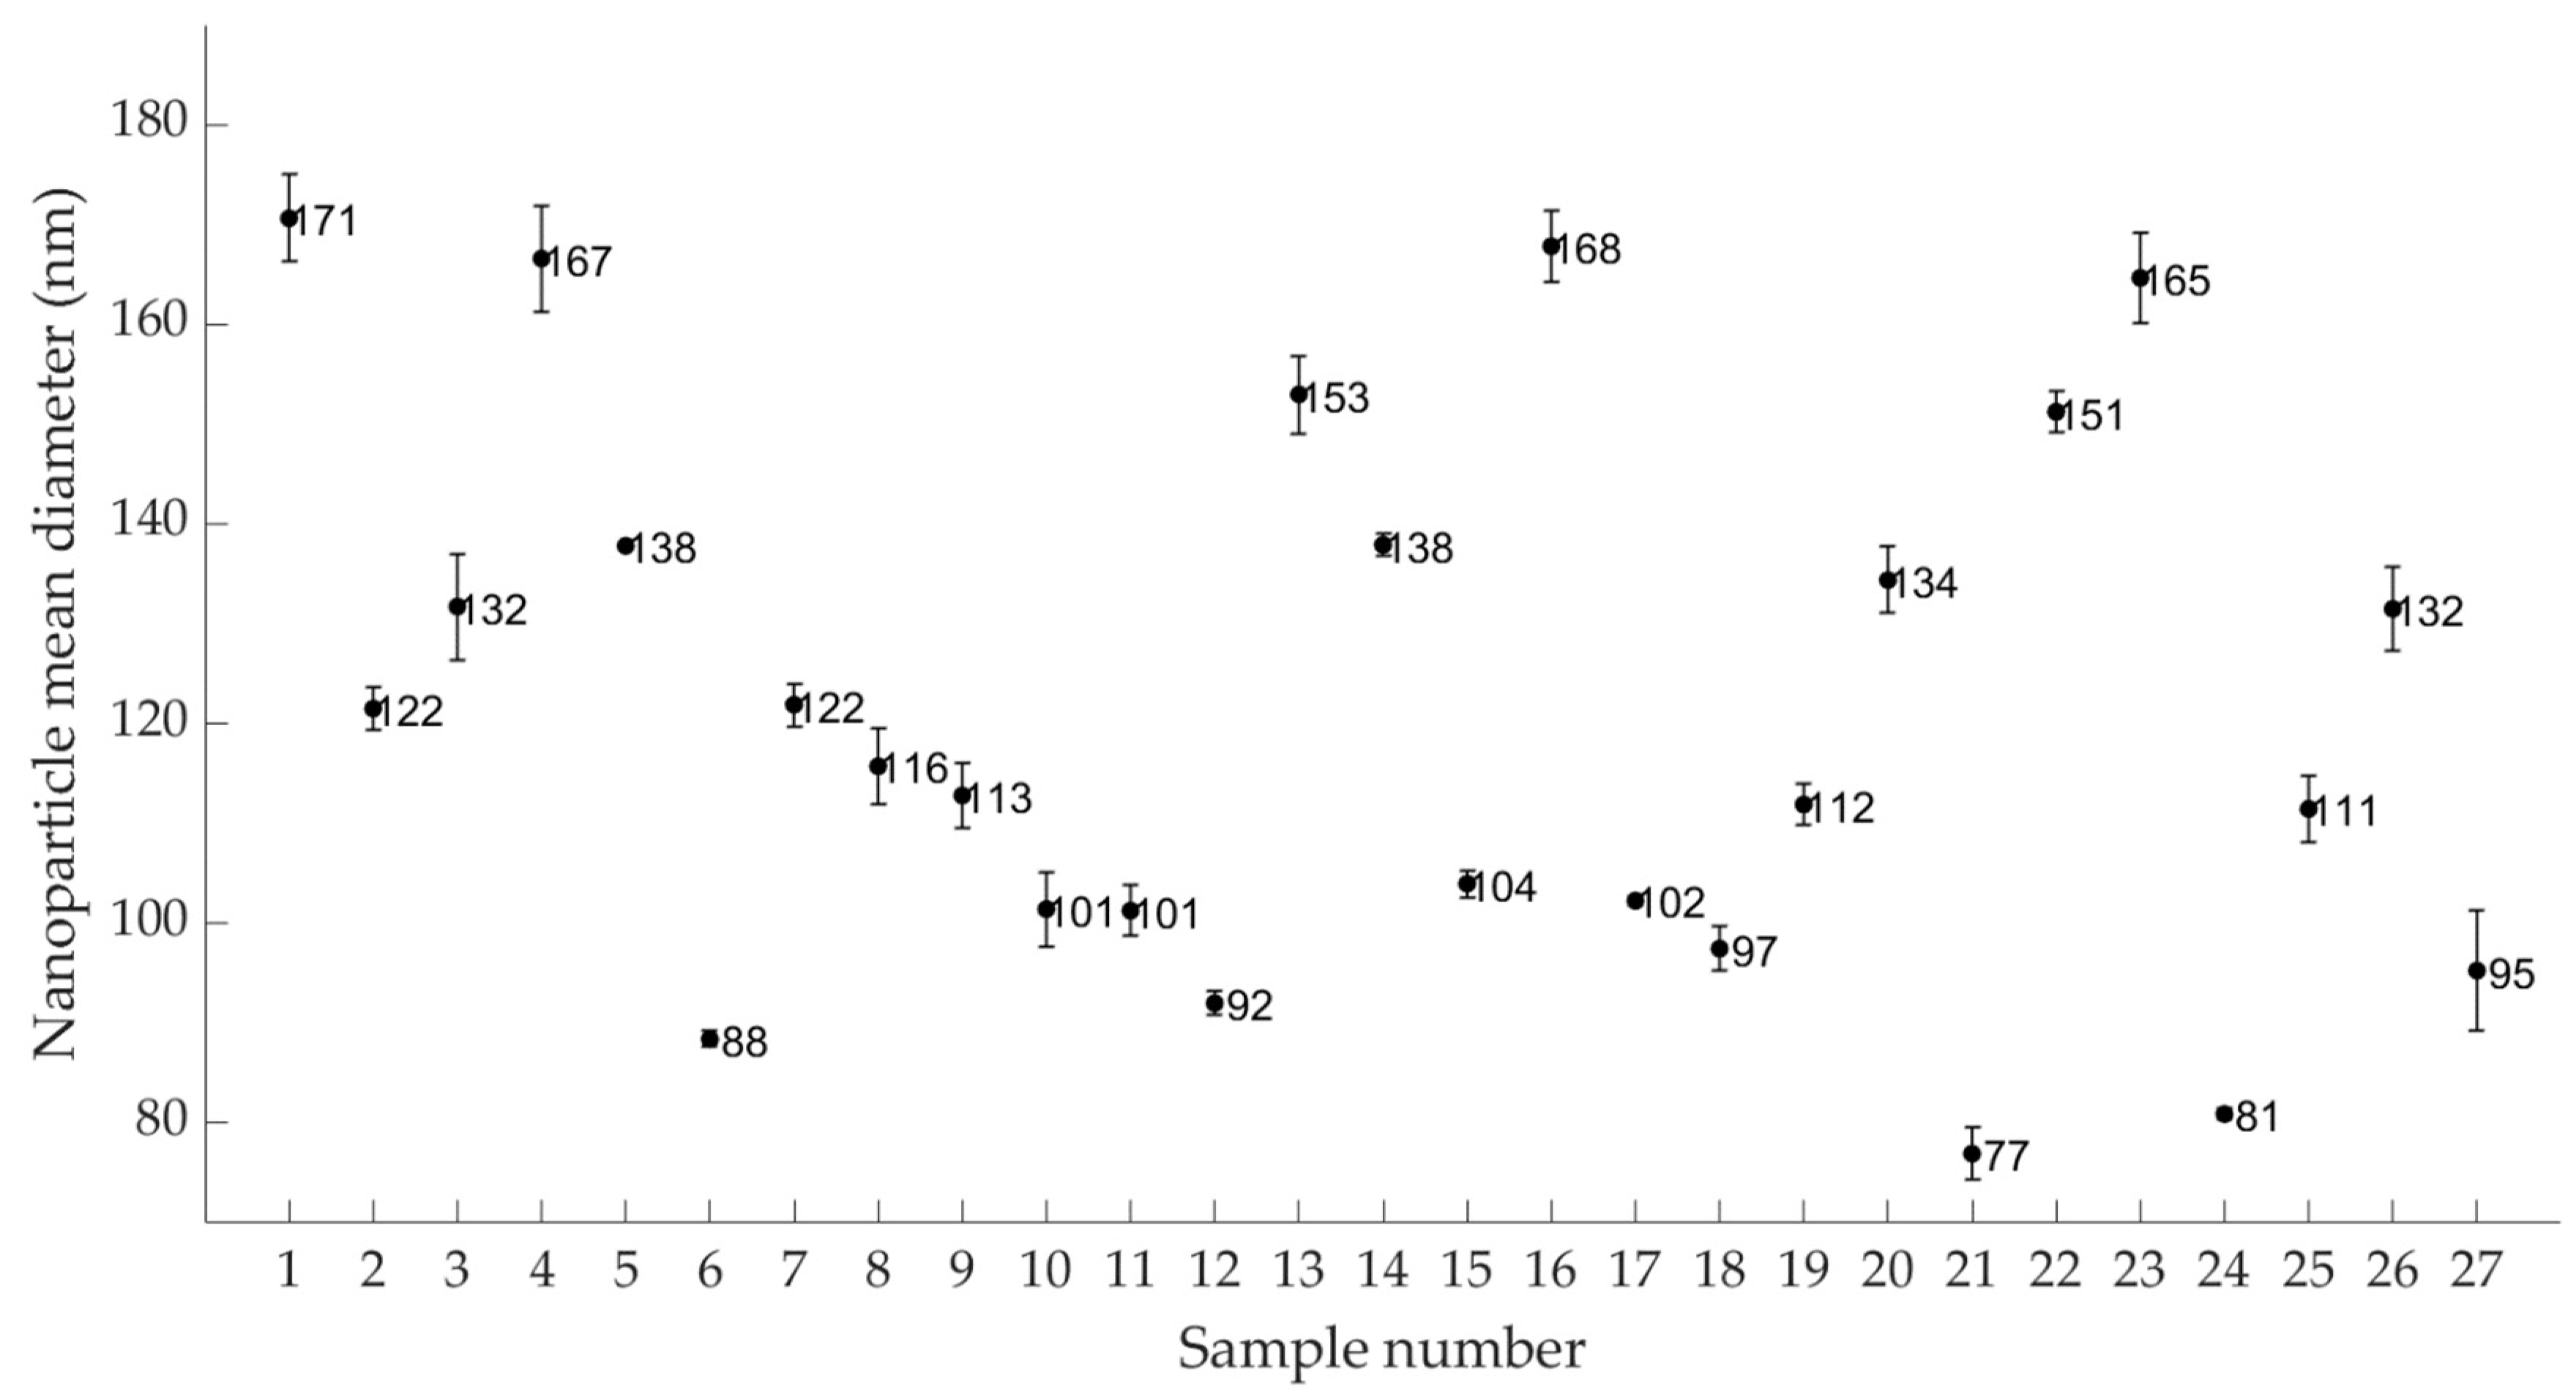
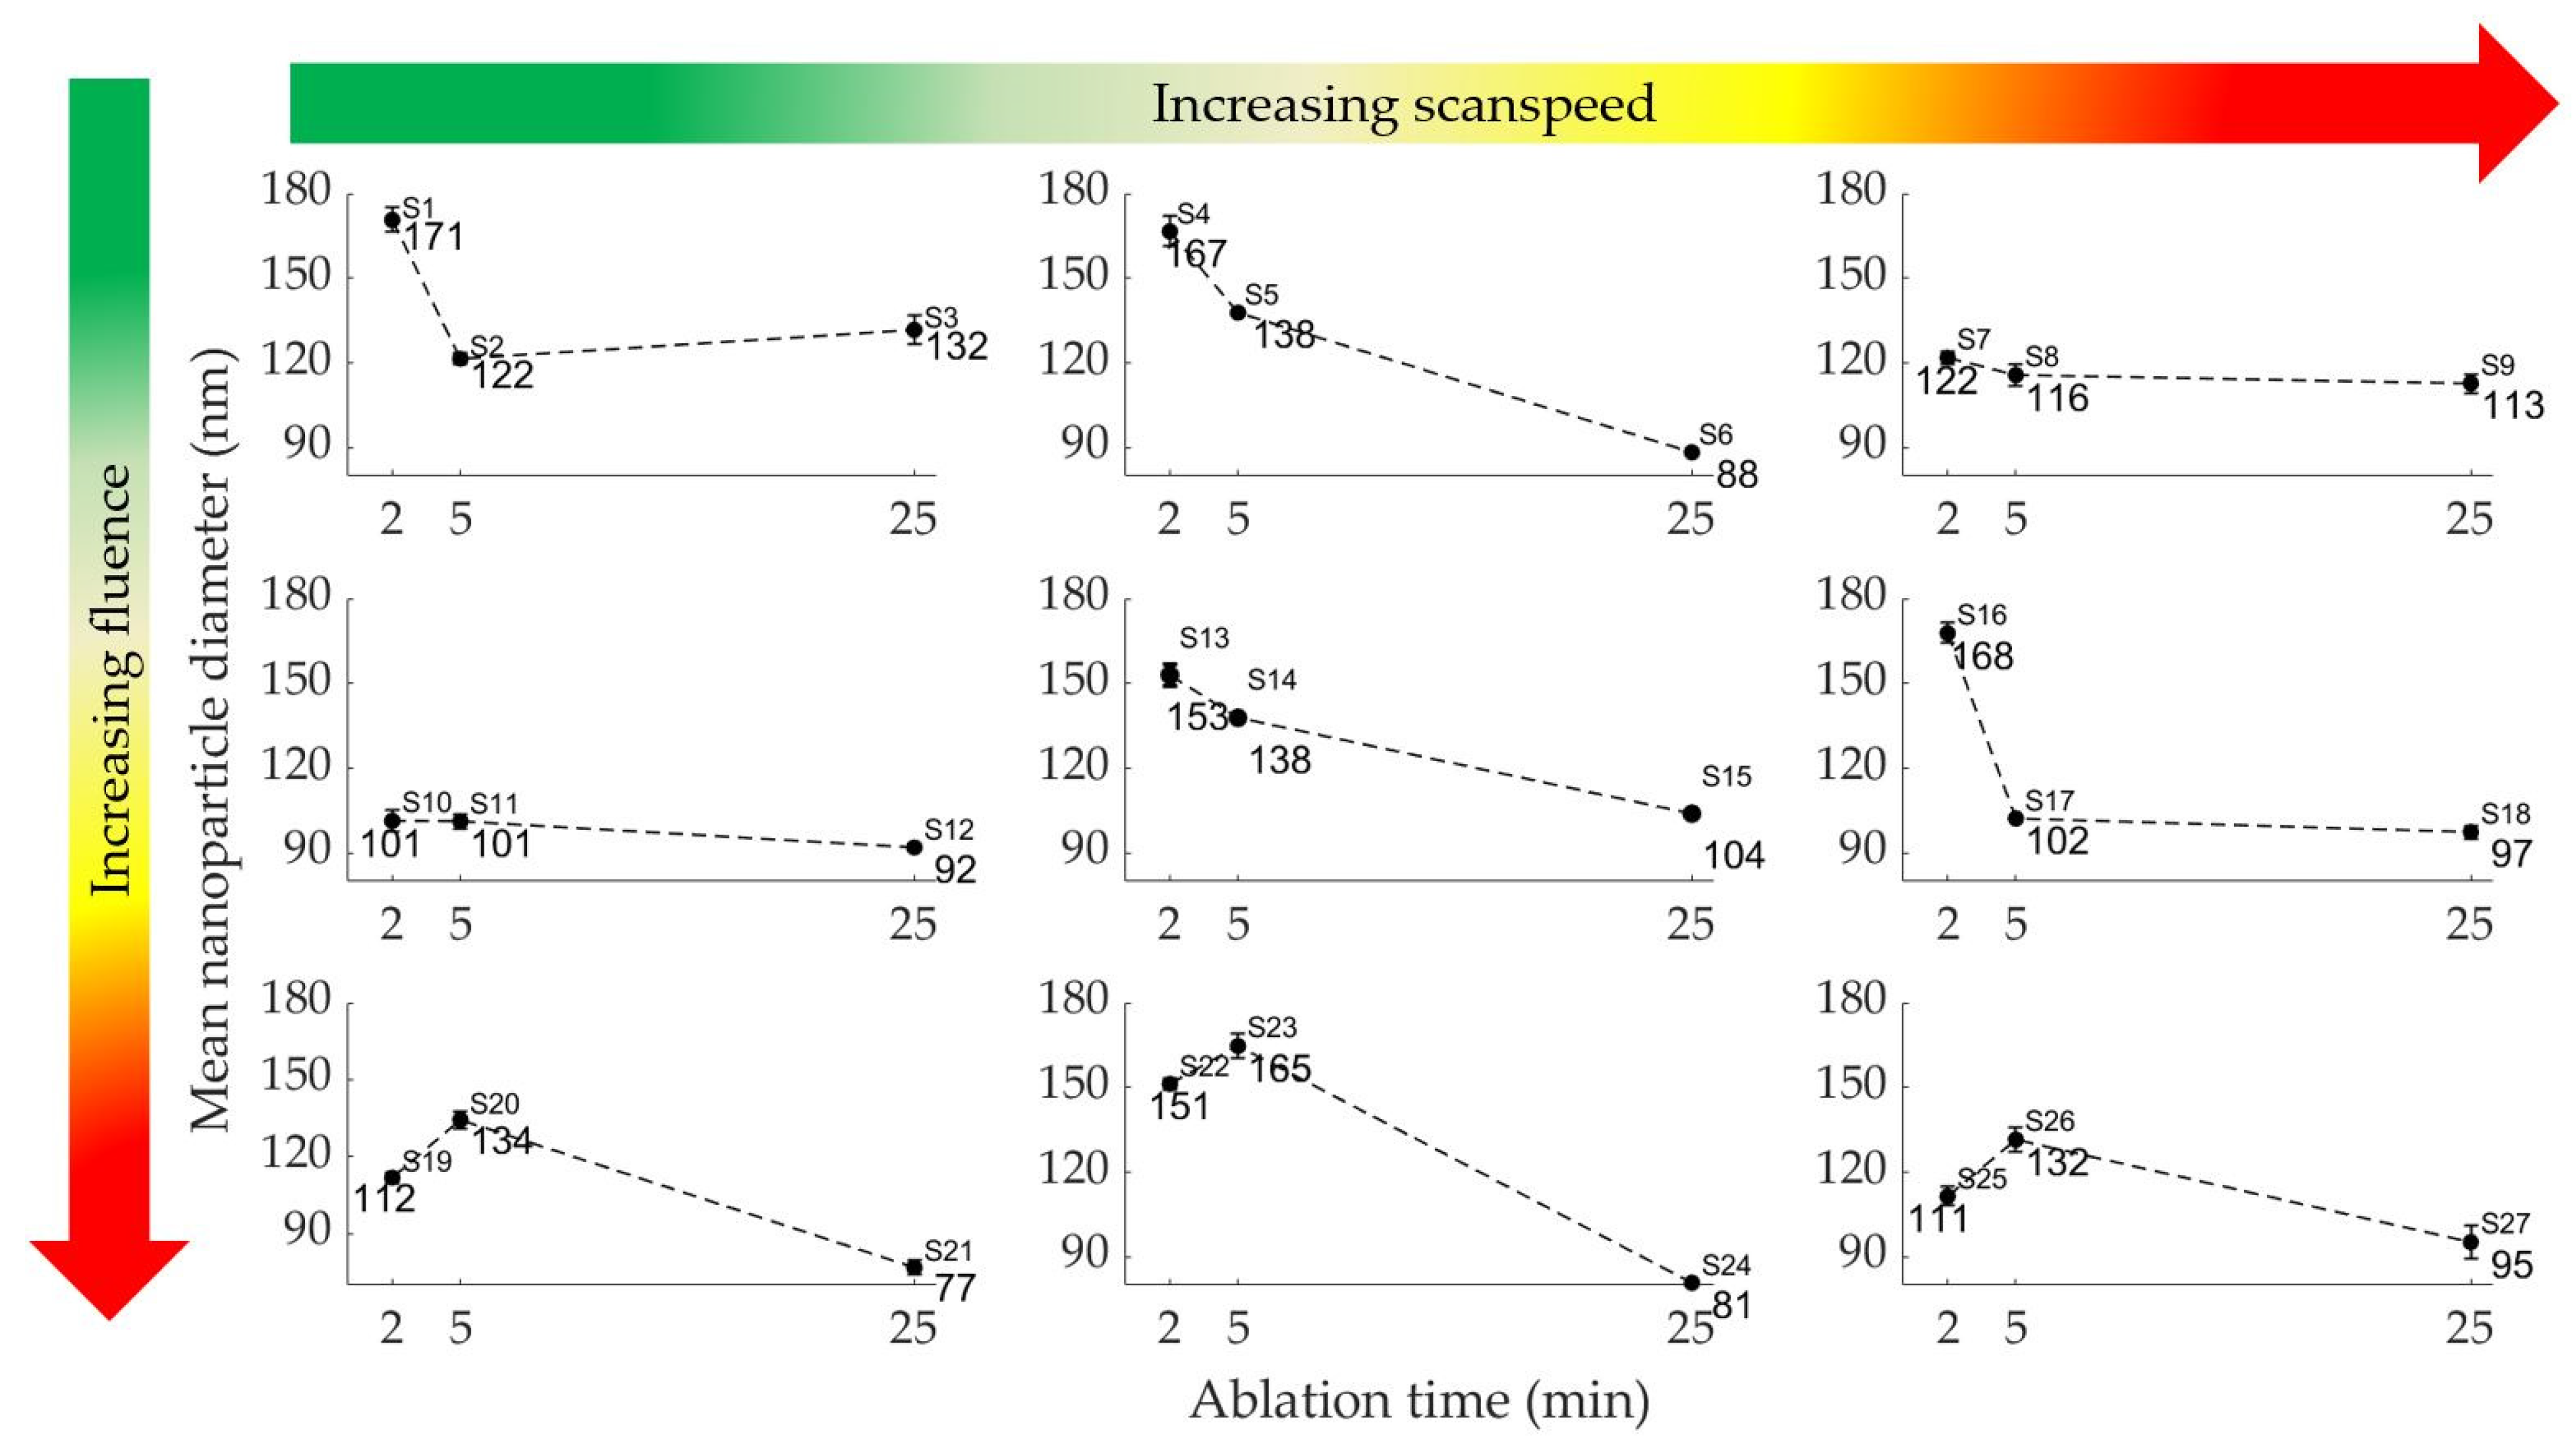
Effect of Ablation Time on Nanoparticle Mean Diameter

The nanoparticle diameter tends to decrease with increasing ablation time from 5 to 25 min; seven of nine sample sets exhibited this trend as shown in Figure 5. This trend is observed for all samples at medium-high scan speeds (3250–3500 mm/s) and/or medium-high laser fluences (1.83–1.91 J/cm2). High scan speeds enable a fast nanoparticle fragmentation; thus, the fragmented particles increase with ablation time and scan speed. A high fluence encourages fragmentation even at low scan speeds due to the increased energy density. On the contrary, an increase in nanoparticle diameter (at low scan speeds) with increasing ablation time from 2 to 5 min is observed for some samples (e.g., samples 19–20, and samples 22–23). This can be explained by the short ablation time that does not allow many fragmentations to occur and the low scan speeds that reduce the rate of nanoparticle fragmentation.
It can be concluded that the laser processing parameters have a combined effect on the nanoparticle mean diameter as shown in Figure 5. As presented in Figure 5, a clear pattern exists for each row. In row 1, there is a decrease in nanoparticle diameter (2–5 min) then a further decrease at a slower rate. In row 2, a similar pattern is present. In row 3, there is first an increase in nanoparticle diameter (2–5 min), then a decrease (5–25 min). These trends can be partly attributed to laser fluence that changes in each row.

3.1.2. Laser Fluence

Laser fluences below 1.30 J/cm2 did not produce a significant number of nanoparticles judging by the little to no colloid colour changes and limited/completely absent UV–Vis absorbance peaks. Three levels of laser fluence were studied: 1.83, 1.88 and 1.91 J/cm2.

Effect of Laser Fluence on Colloidal Density (mg/mL) and Nanoparticle Yield (UV–Vis Absorbance)

Increase in fluence increases the nanoparticle yield (UV–Vis absorbance) as shown in Figure 1 (refer to Table 1 for DOE). There is no obvious trend between laser fluence and colloidal density. The changes in laser fluence seems to not have a significant influence on the colloidal density when one of ablation time or scan speed are low while the other is high. Additionally, there is no significant influence of fluence on the density at an ablation time of 5 min with scan speeds of either 3000 or 3250 mm/s. Conversely, there is a clear direct proportionality between laser fluence and colloidal density at an ablation time of 25 min and a scan speed of 3250 mm/s. This signifies that the colloidal density is controlled by a combination of factors (ablation time, scan speed, fluence).

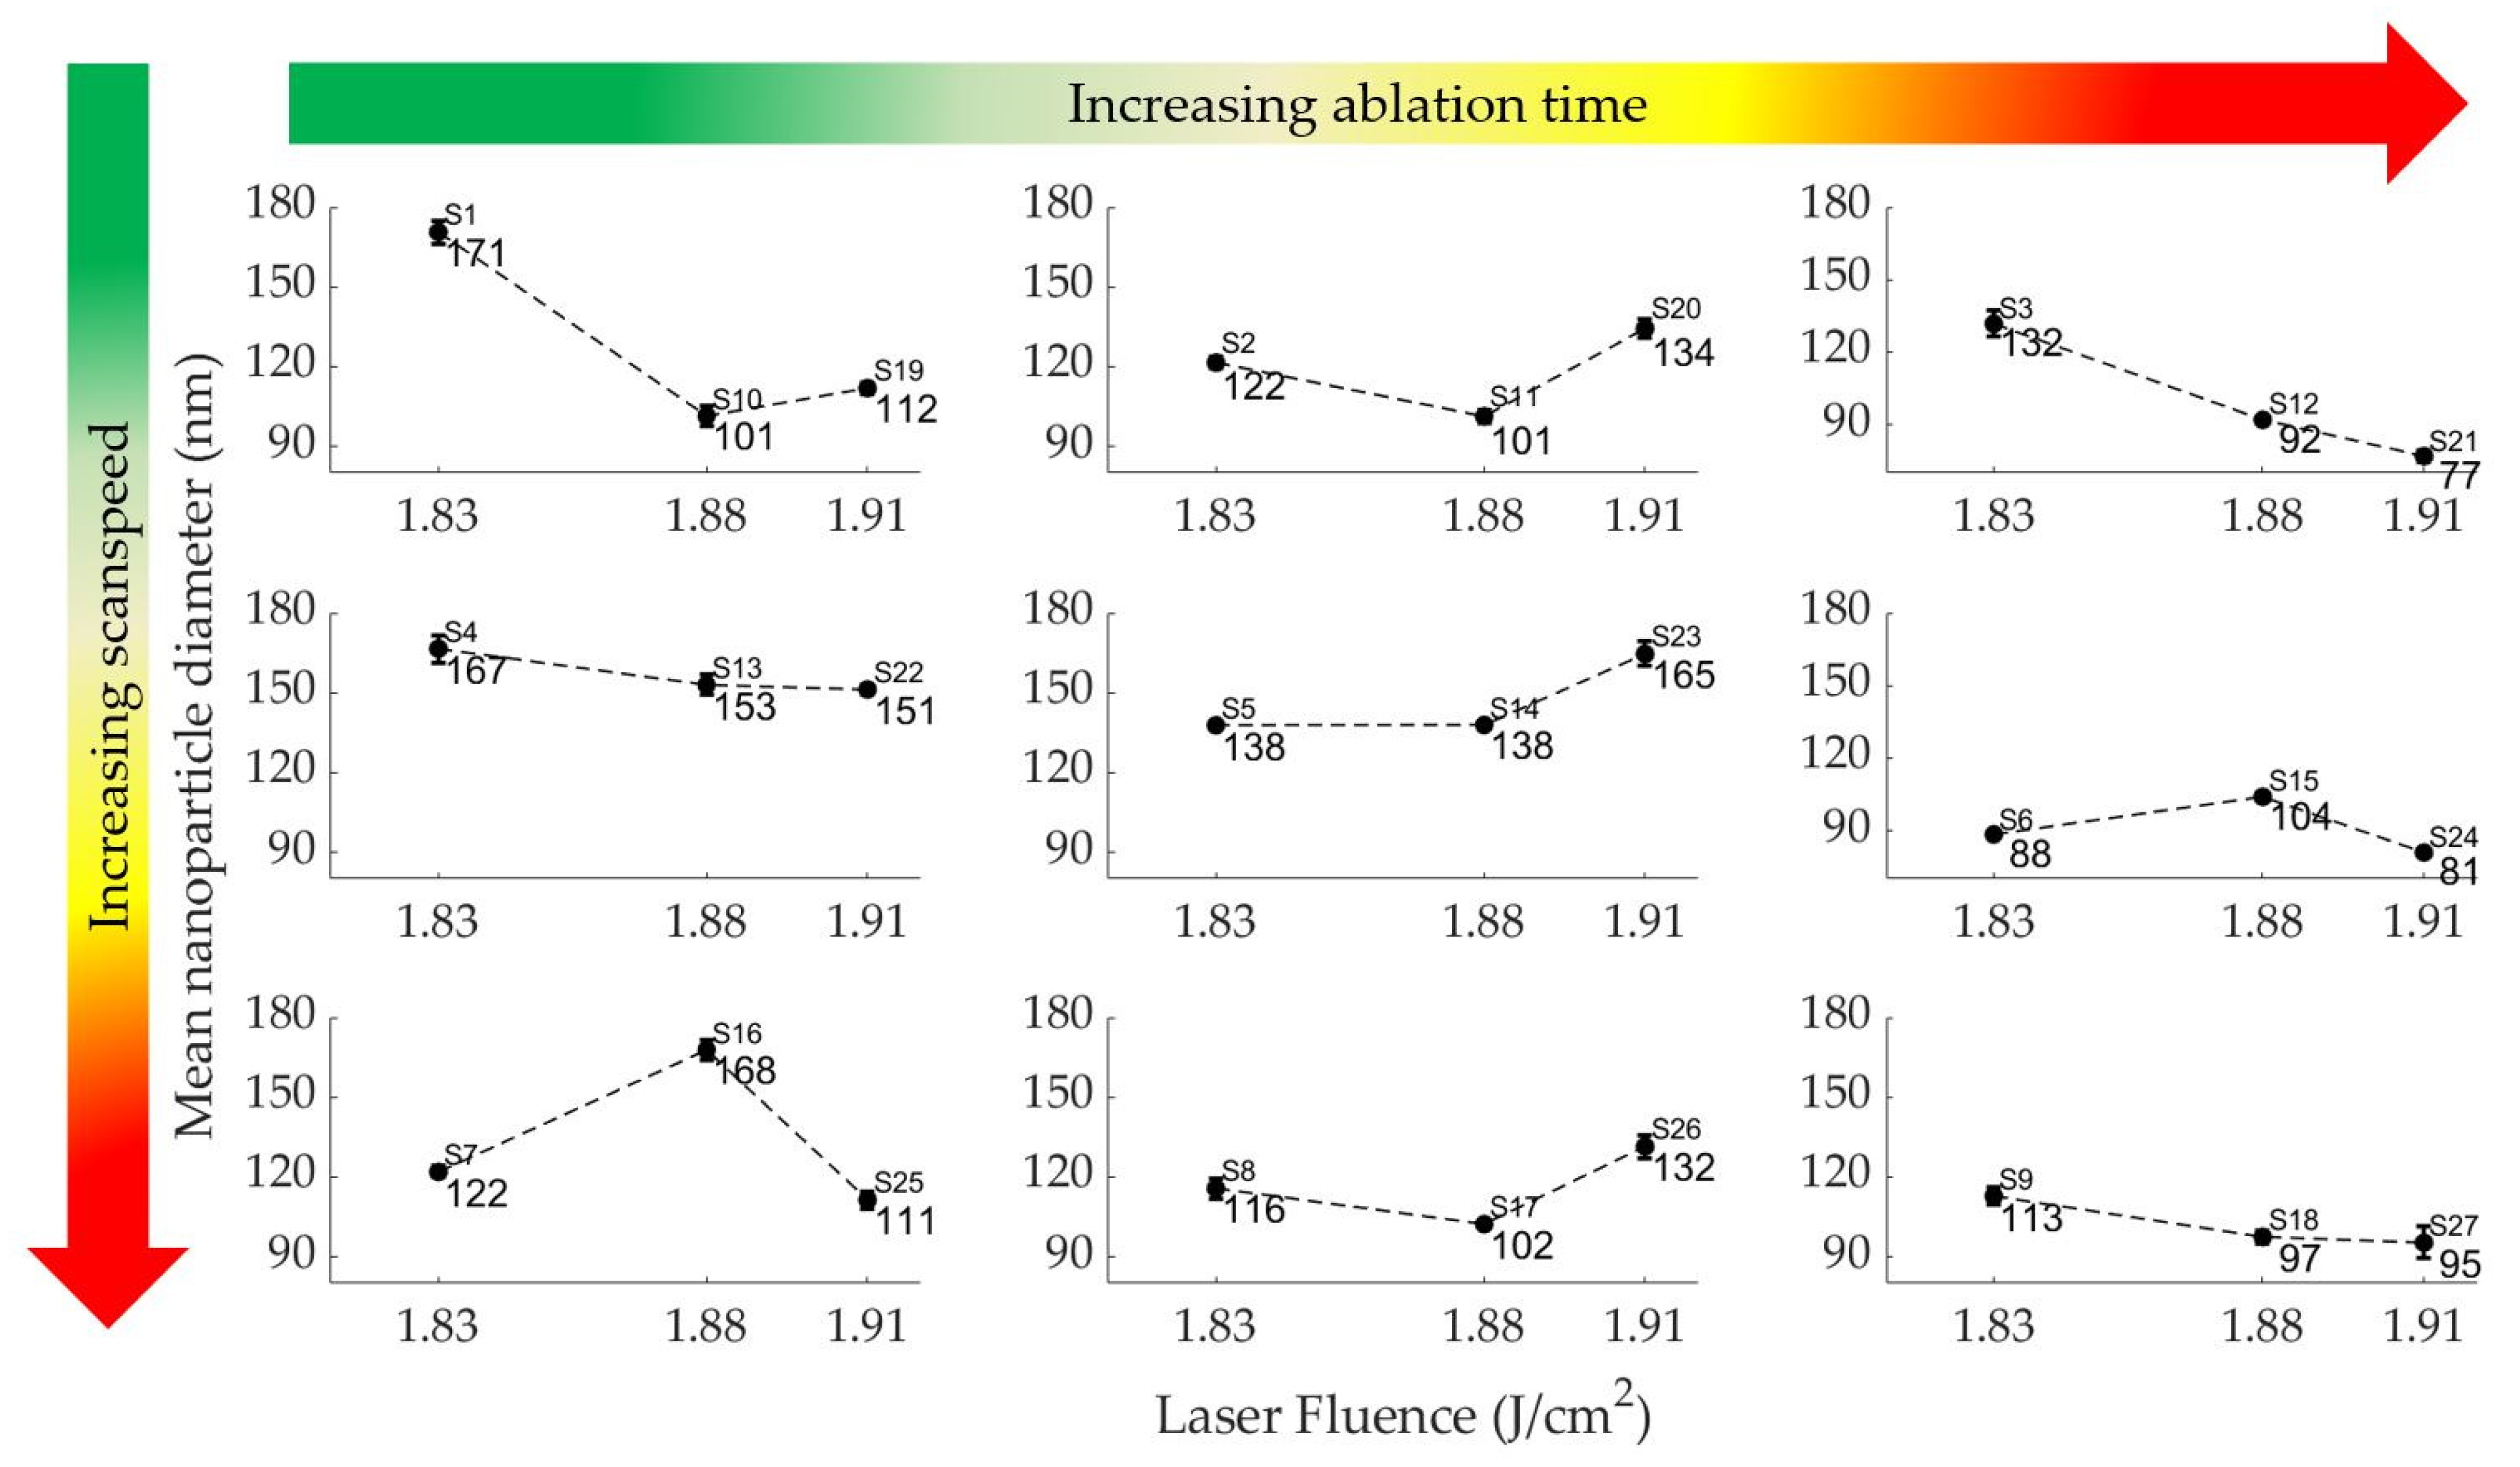
Effect of Laser Fluence on Nanoparticle Mean Diameter

The nanoparticle mean diameter is of major importance as the end-use of the produced nanocolloids depends on the mean size of the nanoparticles. For instance, a certain nanoparticle mean size (and distribution) is required for use in an inkjet printer for the production of flexible sensors [30]. To avoid printing problems, different inkjet printers will work best with different nanoparticle mean sizes. At all combinations of scan speed and ablation time studied herein, the laser fluence has some influence on the resulting nanoparticle mean diameter, as shown in Figure 6. There is a general linear decrease in nanoparticle size with increasing fluence at long ablation times (25 min, far right column). A similar general trend is also observed at low ablation times (2 min) and moderate scan speeds (3250 mm/s, middle column). At 5 min of ablation time (middle column), a general pattern exists whereby there is a decrease in nanoparticle mean diameter as the fluence increases from 1.83 to 1.88 J/cm2, followed by an increase in diameter with increasing fluence from 1.88 to 1.91 J/cm2, making a crooked ‘v’ shape. Although the laser fluence does not have one obvious trend (linear trend) in influence over any of UV–Vis absorption, colloidal density and mean diameter, a threshold fluence is required for ablation to commence.

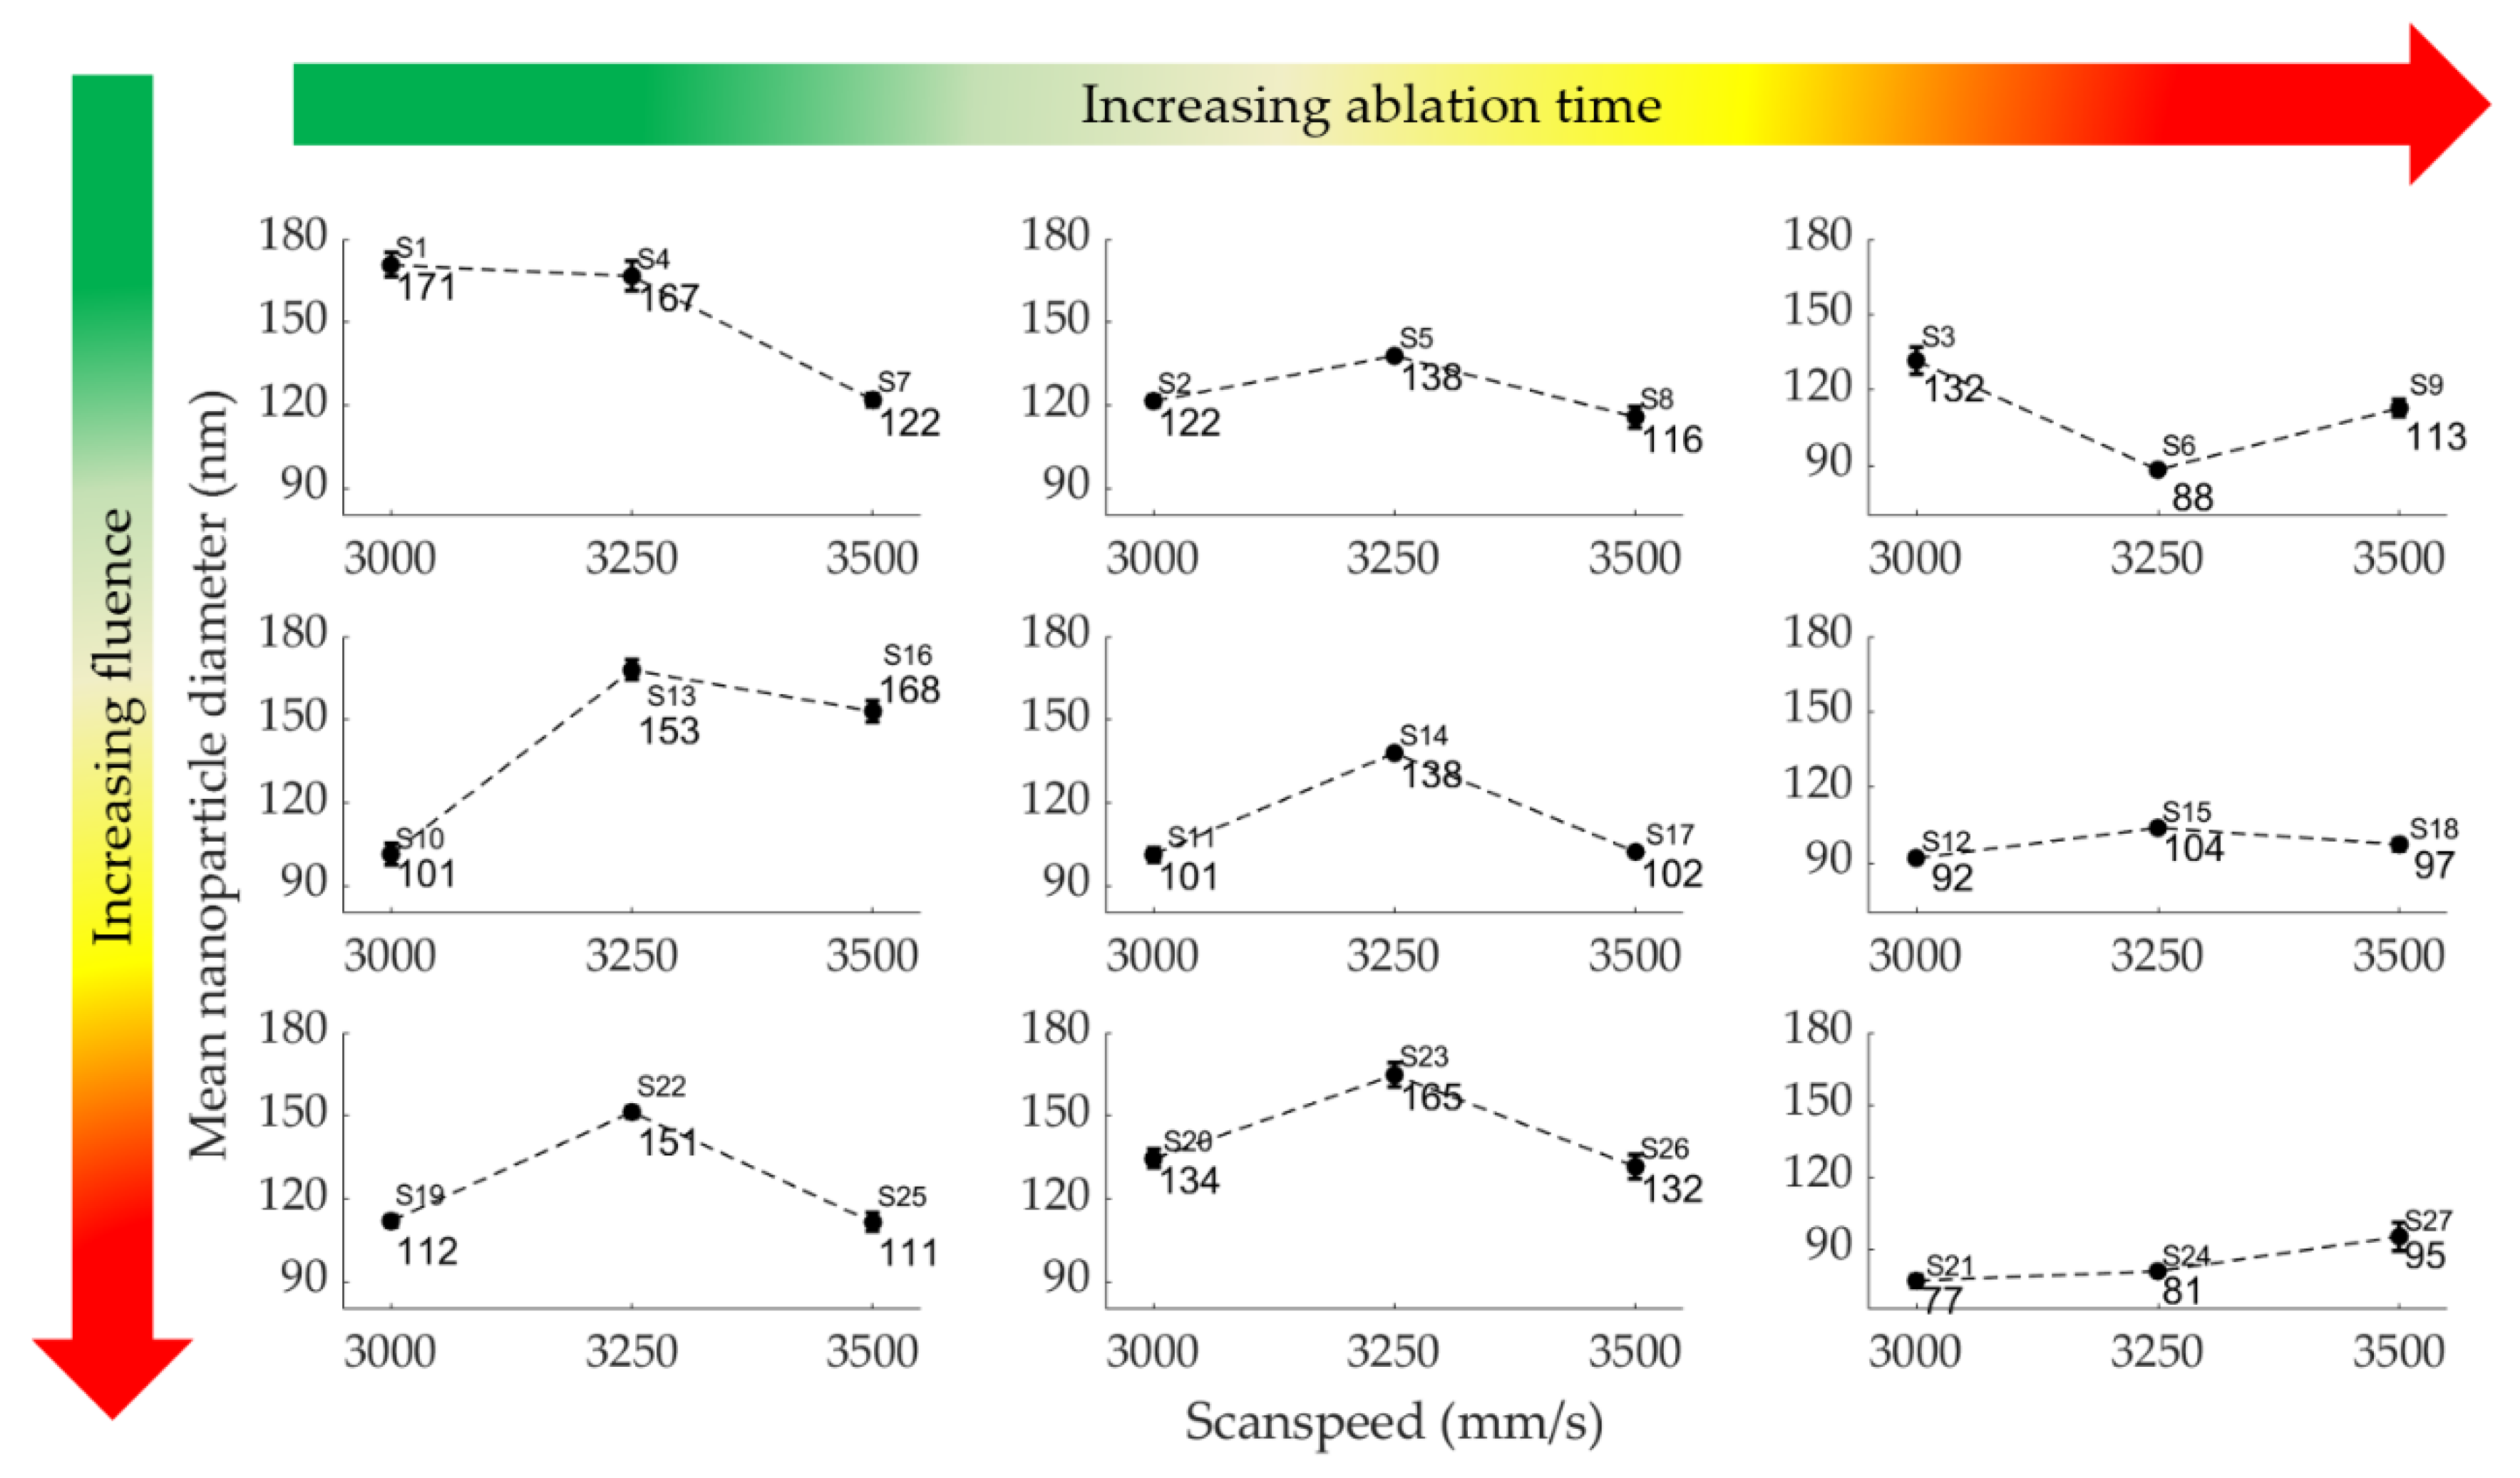
3.1.3. Effect of Scan Speed on Nanoparticle Yield, Colloidal Density and Mean Diameter

A scan speed that is too slow leads to shielding effects whereby the current cavitation bubble absorbs many secondary photons, disenabling further cavitation bubbles (more primary nanoparticles) to be produced. A laser scan speed that is too fast disenables the powders to absorb enough energy for ablation to occur (to overcome the threshold fluence). Initially, various scan speeds below 2000 mm/s (and below 100 mm/s) were studied. None of them yielded a significant number of nanoparticles and the colour of the colloid barely changed (remained clear) even after 60 min of ablation time. Similarly, scan speeds over 4000 mm/s did not yield a significant number of nanoparticles. The colloids synthesised at above 4000 mm/s were all clear (or almost clear) in colour, signifying a low nanoparticle yield. A scan speed of 99,000 mm/s (maximum scan speed for this laser) was examined and no significant number of nanoparticles was synthesised regardless of ablation time, laser fluence, pulse width and repetition rate (kHz).
A general increase in absorbance concurrent with increase in scan speed is observed regardless laser fluence/ablation time. By examining Figure 2, it can be observed that a general pattern exists whereby the colloidal density increases and then decreases (and vice versa) as one goes from low to middle to high laser scan speeds (3000–3250–3500 mm/s) generating a sort of zig-zag pattern. Hence, we can conclude that the scan speed has a non-linear relationship with the colloidal density.
The laser scan speed influenced the nanoparticle mean diameter at all combinations of processing parameters as shown in Figure 7. A linear decrease in nanoparticle mean diameter with increasing scan speed is observed at low fluences (1.83 J/cm2) and short ablation times (2 min) (Figure 7, top left corner). On the other hand, a linear increase in mean diameter with increasing scan speed is observed at high fluences (1.91 J/cm2) and 25 min ablation time (Figure 7, bottom right corner). Additionally, an ‘n’ shaped pattern is observed in five of nine sample sets where there is an increase in nanoparticle mean diameter with increase scan speed from 3000 to 3250 mm/s followed by a decrease from 3250 to 3500 mm/s. Conversely, a ‘u’ shaped pattern is observed once (Figure 7, top right corner).
The absence of a similar trend across all sample sets in Figure 7 proves that the nanoparticle mean diameter is controlled by a combination of processing parameters which is why a model of the process enables the researcher to get some insights into the PLAL technology while simultaneously saving experimental time and costs. A change in the liquid medium from IPA (to ethanol for example) will yield significantly different results to those presented herein, again showing the importance of modelling work in this field.

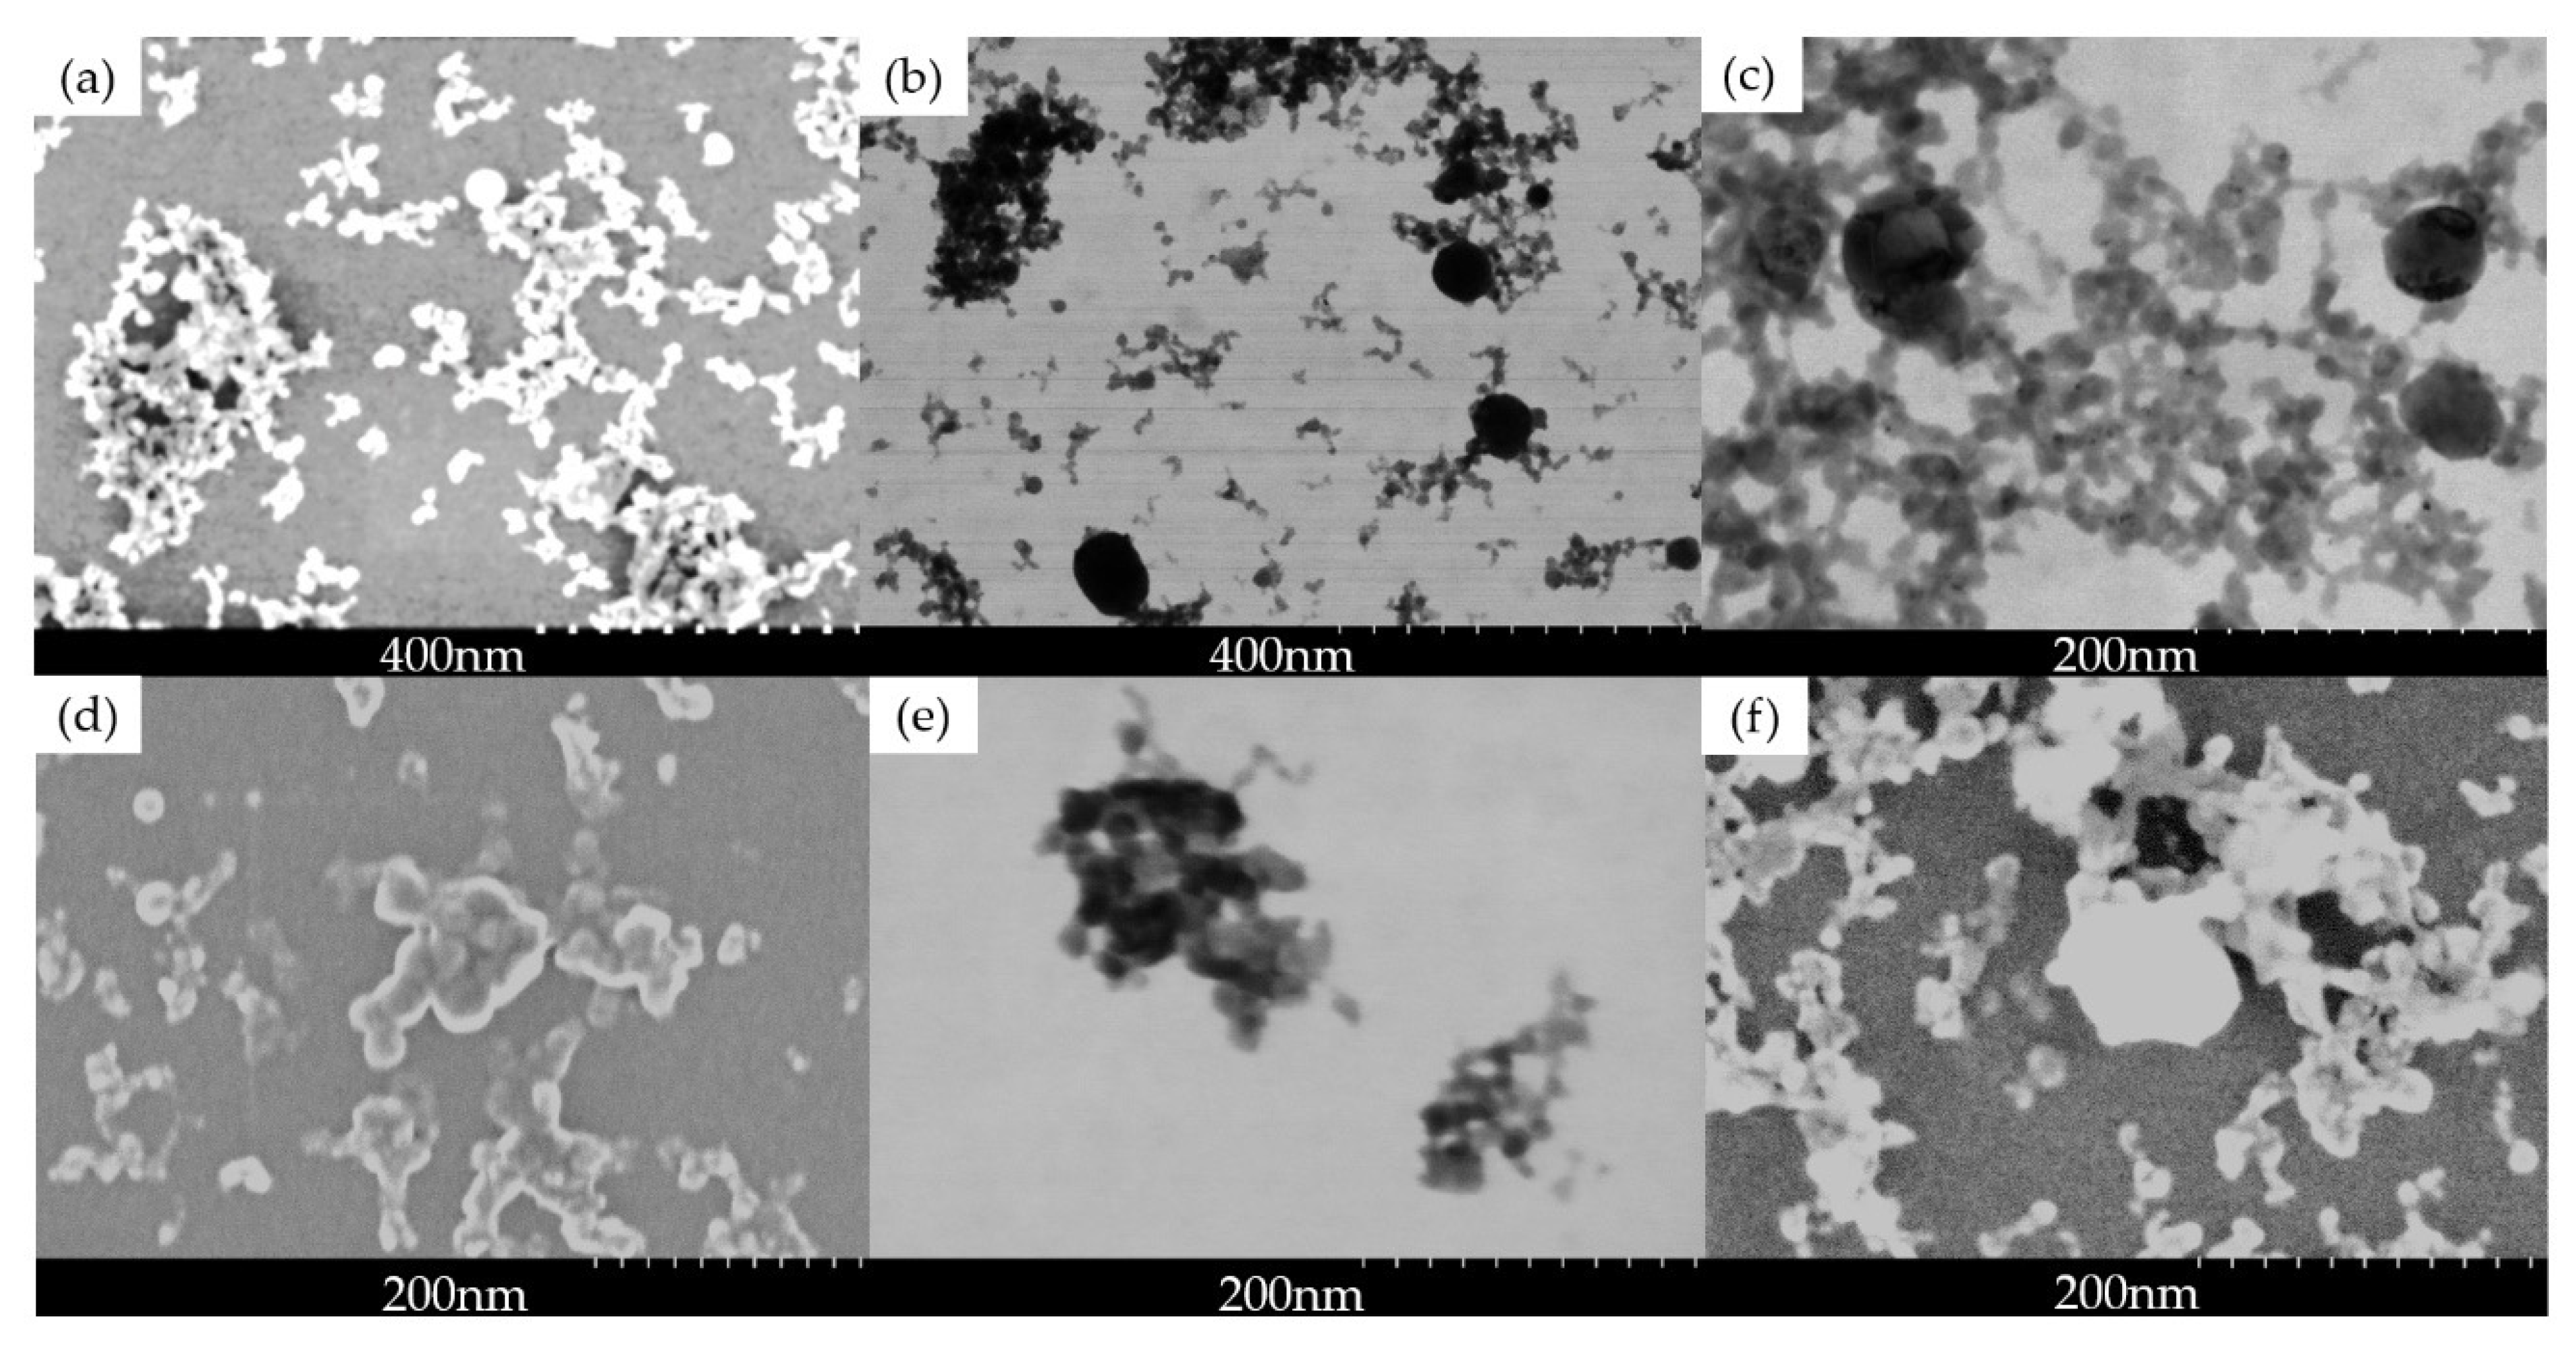
3.2. SEM Analysis—Effect of Processing Parameters on Morphology

SEM was used to analyse the morphology of the nanoparticles as shown in Figure 8. Three samples (27C, 21C and 9C) that were fabricated at different processing parameters were analysed via SEM (refer to Table 1 and Figure 1, Figure 2, Figure 3 for details/processing parameters for these samples). Figure 8d–f are representative of three different samples at the same magnification; differences among these figures prove that laser processing parameters influence the nanoparticle size and yield. All samples show some agglomeration of the nanoparticles; they tend to form dendritic, tree-like structures as shown in Figure 8. This can be attributed to the drop-casting and evaporation method that was used for sample preparation. It is natural for a liquid to form colonies or divide into ‘mini reservoirs’ during evaporation, hence when the liquid is gone, the nanoparticles that remain will resemble the shape of the evaporated liquid. Furthermore, during heating, the viscosity of the liquid decreases, causing the liquid to start moving, thereby splitting into sections as some of the liquid starts to evaporate. The nanoparticles can be deposited onto the substrate with higher accuracy using 3D printing techniques such as inkjet printing (moderate resolution/quality) and aerosol jetting (very high quality and resolution) for fabricating flexible nano/microelectronics. Most of the nanoparticles are spherical and tend to attach to each other due to weak van der Waal forces of attraction between them as shown in Figure 8a,f. It is worth noting that the nanoparticles attach well to the aluminium substrate through the simple drop-casting method without any surface modification or need for adhesive or laser sintering; this implies that drop casting is a viable manufacturing method for specific cases that do not require precise nanoparticle location placement.
SEM images of samples 21C (Figure 8e) and 9C (Figure 8f) can be compared to observe the effect of laser fluence since the fluence is the only processing parameter differentiating these samples. Sample 21C and 9C were processed at a laser fluence of 1.83 J/cm2 and 1.91 J/cm2, respectively. At 200 nm magnification, it can be observed that both samples have similar nanoparticle sizes which is in agreement with the DLS data that gave a mean nanoparticle diameter for sample 21C and 9C of 149.2 and 161.5 nm, respectively.
Samples 27C (Figure 8d) and 21C (Figure 8e) can be compared to study the effect of scan speed. Sample 27C was processed at a scan speed of 3500 mm/s while 21C was processed at 3000 mm/s. Comparison of SEM images clearly show that sample 27C has a higher nanoparticle yield, meaning that a higher scan speed yields more nanoparticles. This is in agreement with the UV–Vis data of these samples. A higher scan speed means the laser is moving faster, hence it will interact with more powder particles per second. However, there is a limit to the scan speed as observed earlier (scan speeds >4000 mm/s is too fast and did not yield nanoparticles).

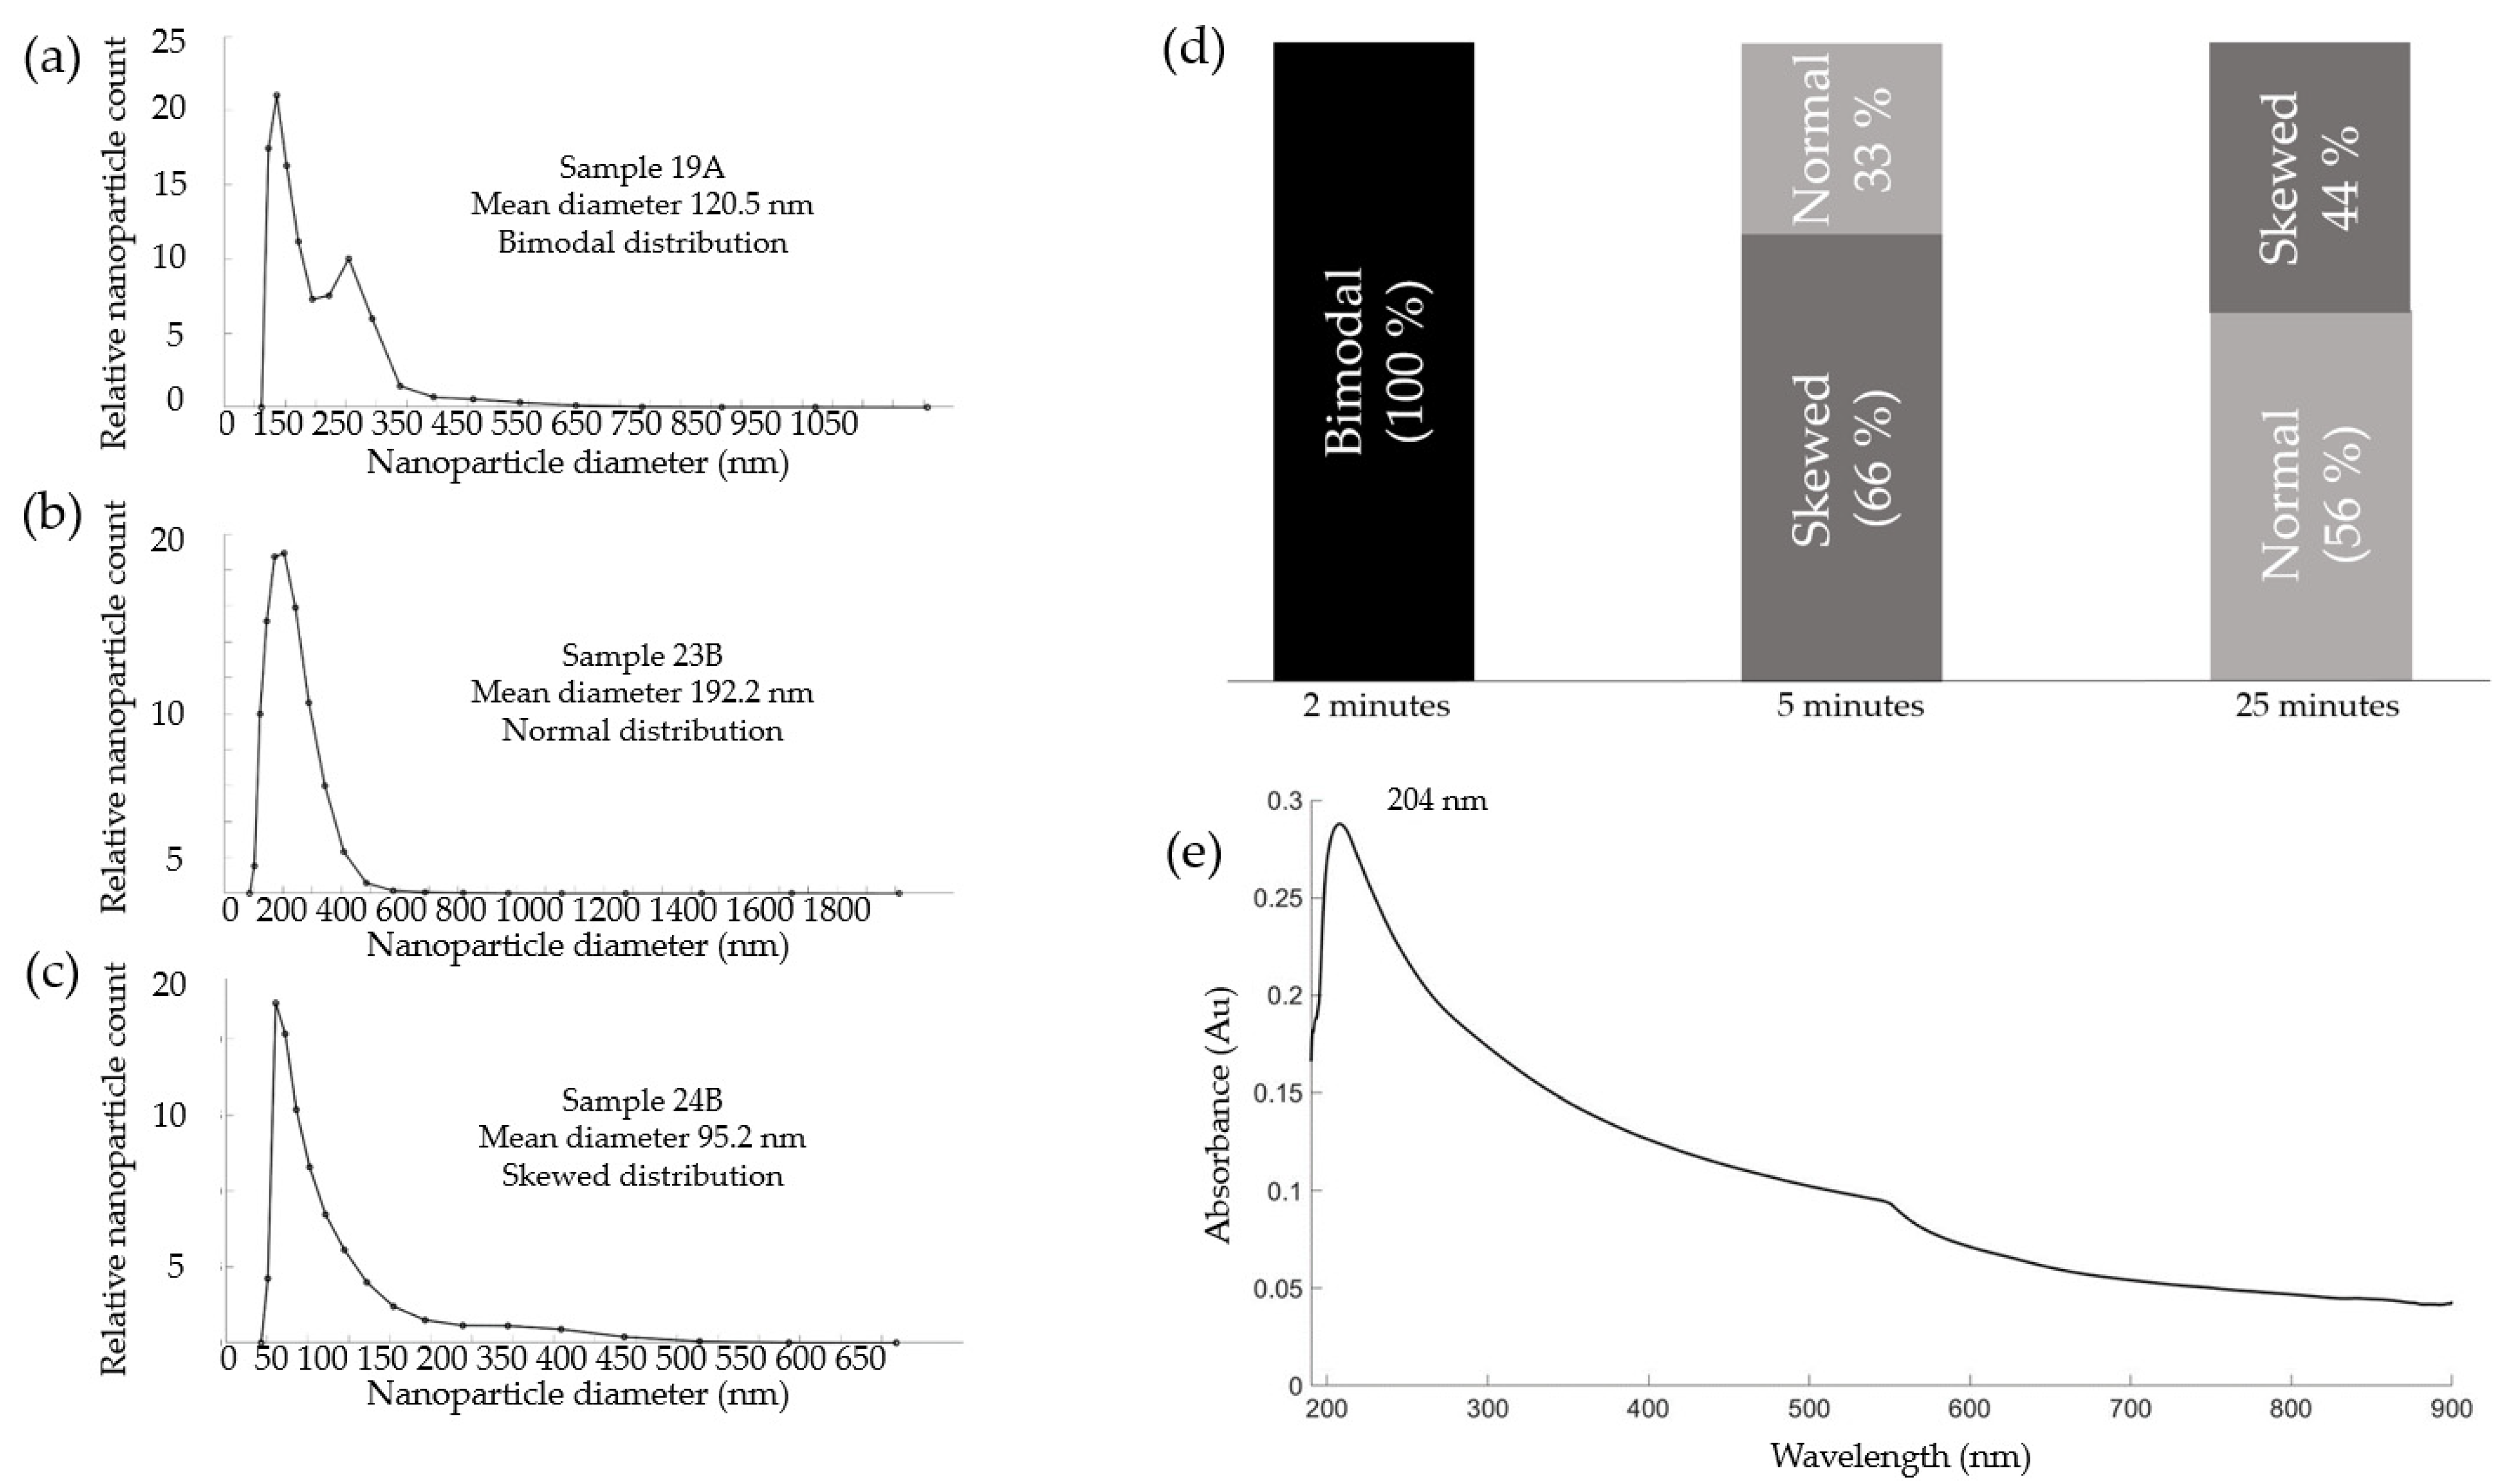
3.3. Size Distribution

Three types of frequency distributions were observed among the 81 samples, namely normal, positively skewed and bimodal distributions (see Figure 4a–c). The probability for a sample picked at random from the 81 to have a particular type of distribution is almost equal, 35% of the samples exhibited a normal distribution, 33% of the samples exhibited a positively skewed distribution (right skewed) and 32% of the samples exhibited a bimodal distribution (the frequency size distribution for each of the 81 samples can be found in the Supplementary Information Table S1). The main cause of differences in distribution types can be attributed to laser processing parameters. All samples synthesised at 2 min ablation time produced a bimodal distribution and bimodal distributions were only observed for 2 min ablation times. At short ablation times, the number of primary nanoparticles (large slightly fragmented particles) and secondary nanoparticles (smaller nanoparticles with multiple fragmentations) are almost equal since there has not been enough time for multiple nanoparticle fragmentation to occur, hence the bimodal distribution (both large and smaller particles exist in large numbers). An increase in ablation time from 2 to 5\25 min shifts the distribution from being bimodal to being normal/skewed as shown in Figure 4d. An increase in ablation time from 2 to 5 min changes the distribution from being bimodal (100% of the samples) to mostly skewed (66% of the samples) and some normally distributed (46%). A further increase in ablation time from 5 to 25 min changes the distribution from being mostly skewed (66% of the samples) to being mostly normal (56% of the samples). This can be explained by the fact that at the beginning of the ablation process, the laser breaks the powder particles into smaller particles. Further ablation will enable nanoparticle fragmentation, causing the distribution to be skewed towards smaller sizes, and additional ablation time will enable the distribution to become normal. It can be concluded that at each ablation time, a most probable nanoparticle size distribution type (normal, skewed or bimodal) exists; this is in agreement with the statistical data mentioned earlier stating that about a third of the samples exhibited a normal distribution, about another third of the samples exhibited a skewed distribution and about another third of the samples exhibited a bimodal distribution. Hence, one can control the size distribution type by simply varying the ablation time. The size distribution is an important factor in the development of nano/micro flexible sensors based on nanomaterials [30]. A bimodal distribution may provide a wide spread of nanoparticles whereby the larger nanoparticles cover larger surface areas while the smaller nanoparticles fill in the gaps for good conductivity. On the other hand, a positively skewed distribution may be ideal when mostly small nanoparticles are required, such as during surface coating for solar cells. A narrow normally distributed sample could be good for inkjet printing as the nanoparticles must be of a certain narrow size range to avoid clogging the printer (a major problem faced with inkjet printing of nanoinks at the moment). It is worth noting that one can produce a normally/uniformly distributed colloid from a bimodal/skewed sample by using a filter of certain size; however, one always runs the risk of losing nanoparticles during the filtering and transferring of colloids from one vessel to another, which is why no filtering was conducted in this study. Similarly, one can produce a skewed/bimodal distributed colloid from normally distributed colloids by mixing or sonicating colloids of different mean nanoparticle diameters.

4. Conclusions

An increase in nanoparticle diameter and/or UV–Vis absorbance leads to an increase in colloidal density (mg/mL). The nanoparticle mean size and the density of a colloid are controlled by a combination of laser processing parameters. The most probable nanoparticle size distribution can be determined depending on the ablation time. An ablation time of 2 min always produces a bimodal distribution. The UV–Vis absorbance is directly proportional to ablation time and does not seem to be affected significantly by laser scan speed/fluence. An increase in scan speed tends to reduce the nanoparticle mean size while increasing the nanoparticle count according to DLS, UV–Vis and FESEM analyses. This is the first time that the influence of scan speed on metallic powder PLAL for nanoparticle synthesis has been reported. SEM images show the nanoparticles forming dendritic structures, a phenomenon attributed to the drop-casting/evaporation method implemented in sample preparation. The as-fabricated magnesium nanocolloids have the potential to be used in wearables and flexible sensors whereby they can be printed on flexible substrates for thermal insulation, conductivity enhancement, antibacterial effects or battery electrodes.

Supplementary Materials

The following are available online at https://www.mdpi.com/article/10.3390/app112210974/s1, Figure S1: Nanoparticle size distribution for sample 13A. A small number of partially fragmented particles (300–60 nm) is observed. Table S1: Nanoparticle size distribution per sample set. 3 types of distributions were observed (bimodal, positively skewed and normal).

Author Contributions

Conceptualisation, A.N., M.V. and D.B.; methodology, A.N., M.V. and D.B.; validation, M.V., S.C., B.F. and D.B.; formal analysis, M.V. and D.B.; investigation, A.N., M.V., S.C., B.F. and D.B.; resources, M.V., S.C., B.F. and D.B.; data curation, A.N., M.V. and D.B.; writing—original draft preparation, A.N.; writing—review and editing, A.N., M.V., S.C. and D.B.; visualisation, B.F.; supervision, M.V. and D.B.; project administration, M.V. and D.B.; funding acquisition, M.V., B.F. and D.B. All authors have read and agreed to the published version of the manuscript.

Funding

This publication has emanated from research supported by a research grant from Science Foundation Ireland (SFI) under grant numbers 18/EPSRC-CDT/3584 and 16/RC/3872 and is co-funded under the European Regional Development Fund.

Institutional Review Board Statement

Not applicable.

Informed Consent Statement

Not applicable.

Data Availability Statement

Not applicable.

Acknowledgments

This work is supported by I-Form, the Science Foundation Ireland Research Centre for Advanced Manufacturing. This work is also supported by Advanced Metallic Systems Centre of Doctoral Training (AMSCDT) which incorporates four universities, namely Dublin City University, University College Dublin, The University of Sheffield and The University of Manchester.

Conflicts of Interest

The authors declare no conflict of interest.

References

  1. Inogamov, N.A.; Khokhlov, V.A.; Petrov, Y.V.; Zhakhovsky, V.V. Hydrodynamic and molecular-dynamics modeling of laser ablation in liquid: From surface melting till bubble formation. Opt. Quantum Electron. 2020, 52, 63. [Google Scholar] [CrossRef]
  2. Scholz, T.; Dickmann, K. Investigation on particle formation during laser ablation process with high brilliant radiation. Phys. Procedia 2010, 5, 311–316. [Google Scholar] [CrossRef] [Green Version]
  3. Povarnitsyn, M.E.; Itina, T.E.; Levashov, P.R.; Khishchenko, K.V. Mechanisms of nanoparticle formation by ultra-short laser ablation of metals in liquid environment. Phys. Chem. Chem. Phys. 2013, 15, 3108–3114. [Google Scholar] [CrossRef] [PubMed]
  4. Fazio, E.; Gökce, B.; De Giacomo, A.; Meneghetti, M.; Compagnini, G.; Tommasini, M.; Waag, F.; Lucotti, A.; Zanchi, C.G.; Ossi, P.M.; et al. Nanoparticles engineering by pulsed laser ablation in liquids: Concepts and applications. Nanomaterials 2020, 10, 2317. [Google Scholar] [CrossRef]
  5. Kim, K.; Zhu, W.; Qu, X.; Aaronson, C.; McCall, W.R.; Chen, S.; Sirbuly, D.J. 3D optical printing of piezoelectric nanoparticle-polymer composite materials. ACS Nano 2014, 8, 9799–9806. [Google Scholar] [CrossRef]
  6. Tsuji, T.; Iryo, K.; Nishimura, Y.; Tsuji, M. Preparation of metal colloids by a laser ablation technique in solution: Influence of laser wavelength on the ablation efficiency (II). J. Photochem. Photobiol. A Chem. 2001, 145, 201–207. [Google Scholar] [CrossRef]
  7. Smejkal, P.; Pfleger, J.; Vlcková, B.; Dammer, O. Laser ablation of silver in aqueous ambient: Effect of laser pulse wavelength and energy on efficiency of the process. J. Phys. Conf. Ser. 2007, 59, 185–188. [Google Scholar] [CrossRef] [Green Version]
  8. Letzel, A.; Santoro, M.; Frohleiks, J.; Ziefuß, A.R.; Reich, S.; Plech, A.; Fazio, E.; Neri, F.; Barcikowski, S.; Gökce, B. How the re-irradiation of a single ablation spot affects cavitation bubble dynamics and nanoparticles properties in laser ablation in liquids. Appl. Surf. Sci. 2019, 473, 828–837. [Google Scholar] [CrossRef]
  9. Nyabadza, A.; Vázquez, M.; Coyle, S.; Fitzpatrick, B.; Brabazon, D. Review of Materials and Fabrication Methods for Flexible Nano and Micro-Scale Physical Property Sensors. Appl. Sci. 2021, 11, 8563. [Google Scholar] [CrossRef]
  10. Yogesh, G.K.; Shuaib, E.P.; Kalai Priya, A.; Rohini, P.; Anandhan, S.V.; Krishnan, U.M.; Kalyanavalli, V.; Shukla, S.; Sastikumar, D. Synthesis of water-soluble fluorescent carbon nanoparticles (CNPs) from nanosecond pulsed laser ablation in ethanol. Opt. Laser Technol. 2021, 135, 106717. [Google Scholar] [CrossRef]
  11. Thongpool, V.; Asanithi, P.; Limsuwan, P. Synthesis of carbon particles using laser ablation in ethanol. Procedia Eng. 2012, 32, 1054–1060. [Google Scholar] [CrossRef] [Green Version]
  12. Baladi, A.; Mamoory, R.S. Effect of Laser Wavelength and Ablation Time on Pulsed Laser Ablation Synthesis of Al Nanoparticles in Ethanol. Int. J. Mod. Phys. Conf. Ser. 2012, 5, 58–65. [Google Scholar] [CrossRef]
  13. García Guillén, G.; Zuñiga Ibarra, V.A.; Mendivil Palma, M.I.; Krishnan, B.; Avellaneda Avellaneda, D.; Shaji, S. Effects of Liquid Medium and Ablation Wavelength on the Properties of Cadmium Sulfide Nanoparticles Formed by Pulsed-Laser Ablation. ChemPhysChem 2017, 18, 1035–1046. [Google Scholar] [CrossRef]
  14. Kudryashov, S.I.; Saraeva, I.N.; Lednev, V.N.; Pershin, S.M.; Rudenko, A.A.; Ionin, A.A. Single-shot femtosecond laser ablation of gold surface in air and isopropyl alcohol. Appl. Phys. Lett. 2018, 112, 203101. [Google Scholar] [CrossRef] [Green Version]
  15. Sukhov, I.A.; Simakin, A.V.; Shafeev, G.A.; Viau, G.; Garcia, C. Formation of nanoparticles during laser ablation of an iron target in a liquid. Quantum Electron. 2012, 42, 453. [Google Scholar] [CrossRef]
  16. Ismail, R.A.; Mousa, A.M.; Khashan, K.S.; Mohsin, M.H.; Hamid, M.K. Synthesis of PbI2 nanoparticles by laser ablation in methanol. J. Mater. Sci. Mater. Electron. 2016, 27, 10696–10700. [Google Scholar] [CrossRef]
  17. Zhao, J.; Zhang, Y.; Fang, Y.; Fan, Z.; Ma, G.; Liu, Y.; Zhao, X. Synthesis of polyynes by intense femtosecond laser irradiation of SWCNTs suspended in methanol. Chem. Phys. Lett. 2017, 682, 96–100. [Google Scholar] [CrossRef]
  18. Menazea, A.A. Femtosecond laser ablation-assisted synthesis of silver nanoparticles in organic and inorganic liquids medium and their antibacterial efficiency. Radiat. Phys. Chem. 2020, 168, 108616. [Google Scholar] [CrossRef]
  19. Al-Antaki, A.H.M.; Luo, X.; Duan, X.; Lamb, R.N.; Hutchison, W.D.; Lawrance, W.; Raston, C.L. Continuous Flow Copper Laser Ablation Synthesis of Copper(I and II) Oxide Nanoparticles in Water. ACS Omega 2019, 4, 13577–13584. [Google Scholar] [CrossRef] [PubMed] [Green Version]
  20. Abrinaei, F.; Torkamany, M.J.; Hantezadeh, M.R.; Sabbaghzadeh, J. Formation of Mg and MgO nanocrystals by laser ablation in liquid: Effects of laser sources. Sci. Adv. Mater. 2012, 4, 501–506. [Google Scholar] [CrossRef]
  21. Abdulkhaleq, N.A.; Nayef, U.M.; Albarazanchi, A.K.H. MgO nanoparticles synthesis via laser ablation stationed on porous silicon for photoconversion application. Optik 2020, 212, 164793. [Google Scholar] [CrossRef]
  22. Phuoc, T.X.; Howard, B.H.; Martello, D.V.; Soong, Y.; Chyu, M.K. Synthesis of Mg(OH)2, MgO, and Mg nanoparticles using laser ablation of magnesium in water and solvents. Opt. Lasers Eng. 2008, 46, 829–834. [Google Scholar] [CrossRef] [Green Version]
  23. Leonés, A.; Lieblich, M.; Benavente, R.; Gonzalez, J.L.; Peponi, L. Potential applications of magnesium-based polymeric nanocomposites obtained by electrospinning technique. Nanomaterials 2020, 10, 1524. [Google Scholar] [CrossRef]
  24. Dhivya, S.; Ajita, J.; Selvamurugan, N. Metallic Nanomaterials for Bone Tissue Engineering. J. Biomed. Nanotechnol. 2015, 11, 1675–1700. [Google Scholar] [CrossRef]
  25. Tan, J.; Ramakrishna, S. Applications of Magnesium and Its Alloys: A Review. Appl. Sci. 2021, 11, 6861. [Google Scholar] [CrossRef]
  26. Liquid Magnesium, Trace Minerals and Sea Salt from Deep Ocean—Oriel Sea Salt. Available online: https://orielmarineextracts.com/ (accessed on 25 August 2021).
  27. Patel, M.K.; Azahar Ali, M.; Agrawal, V.V.; Ansari, Z.A.; Ansari, S.G.; Malhotra, B.D. Nanostructured magnesium oxide biosensing platform for cholera detection. Appl. Phys. Lett. 2013, 102, 144106. [Google Scholar] [CrossRef]
  28. Nakamura, Y.; Okita, K.; Kudo, D.; Phuong, D.N.D.; Iwamoto, Y.; Yoshioka, Y.; Ariyoshi, W.; Yamasaki, R. Magnesium Hydroxide Nanoparticles Kill Exponentially Growing and Persister Escherichia coli Cells by Causing Physical Damage. Nanomaterials 2021, 11, 1584. [Google Scholar] [CrossRef]
  29. Nyabadza, A.; Kane, J.; Sreenilayam, S.; Vázquez, M.; Brabazon, D.; Sreenilayam, S.; Brabazon, D. Multi-Material Production of 4D Shape Memory Polymer Composites. Encycl. Mater. Compos. 2021, 2, 879–894. [Google Scholar] [CrossRef]
  30. Nayak, L.; Mohanty, S.; Kumar Nayak, S.; Ramadoss, A. A review on inkjet printing of nanoparticle inks for flexible electronics. J. Mater. Chem. C 2019, 7, 8771. [Google Scholar] [CrossRef]
  31. Ge, G.; Tang, Y.; Li, Y.; Huang, L. Effect of environmental temperature on the insulating performance of epoxy/MgO nanocomposites. Appl. Sci. 2020, 10, 7018. [Google Scholar] [CrossRef]
  32. Ringe, E. Shapes, Plasmonic Properties, and Reactivity of Magnesium Nanoparticles. J. Phys. Chem. C 2020, 124, 15665–15679. [Google Scholar] [CrossRef]
  33. Saha, P.; Datta, M.K.; Velikokhatnyi, O.I.; Manivannan, A.; Alman, D.; Kumta, P.N. Rechargeable magnesium battery: Current status and key challenges for the future. Prog. Mater. Sci. 2014, 66, 1–86. [Google Scholar] [CrossRef]
  34. Bella, F.; Luca, S.; De Fagiolari, L.; Versaci, D.; Amici, J.; Francia, C.; Bodoardo, S. An Overview on Anodes for Magnesium Batteries: Challenges towards a Promising Storage Solution for Renewables. Nanomaterials 2021, 11, 810. [Google Scholar] [CrossRef]
  35. Shin, E.; Lee, Y.J.; Nam, H.; Kwon, S.-H. Hydrogen Sensor: Detecting Far-Field Scattering of Nano-Blocks (Mg, Ag, and Pd). Sensors 2020, 20, 3831. [Google Scholar] [CrossRef]
  36. Avellaneda, C.O.; Gonçalves, A.D.; Benedetti, J.E.; Nogueira, A.F. Preparation and characterization of core-shell electrodes for application in gel electrolyte-based dye-sensitized solar cells. Electrochim. Acta 2010, 55, 1468–1474. [Google Scholar] [CrossRef]
  37. Ali, A.; Gul, A.; Mannan, A.; Zia, M. Efficient metal adsorption and microbial reduction from Rawal Lake wastewater using metal nanoparticle coated cotton. Sci. Total Environ. 2018, 639, 26–39. [Google Scholar] [CrossRef]
  38. Gao, C.; Zhang, W.; Li, H.; Lang, L.; Xu, Z. Controllable Fabrication of Mesoporous MgO with Various Morphologies and Their Absorption Performance for Toxic Pollutants in Water. Cryst. Growth Des. 2008, 8, 3785–3790. [Google Scholar] [CrossRef]
  39. Sharma, L.; Kakkar, R. Hierarchically structured magnesium based oxides: Synthesis strategies and applications in organic pollutant remediation. CrystEngComm 2017, 19, 6913–6926. [Google Scholar] [CrossRef]
Figure 1. Mean nanoparticle UV–Vis absorbance at ~204 nm per sample group (1–27), giving an indication of nanoparticle count/yield per sample group (95% CI).
Applsci 11 10974 g001
Figure 2. Mean nanoparticle diameter per sample group (1–27) (95% CI).
Applsci 11 10974 g002
Figure 3. Mean colloidal density (mg/mL) per sample group (1–27) (95% CI).
Applsci 11 10974 g003
Figure 4. (a) Sample with bimodal nanoparticle size distribution after 2 min; (b) sample with normal nanoparticle size distribution after 5 min; (c) sample with positively skewed nanoparticle size distribution after 25 min; (d) effect of ablation time on nanoparticle size distribution. All samples are bimodal at 2 min, mostly skewed at 5 minutes and mostly normally distributed at 25 min; (e) typical UV–Vis curve for a magnesium colloid. A distinct peak is observed at a wavelength of about 204 nm.
Applsci 11 10974 g004
Figure 5. Effect of ablation time on nanoparticle mean diameter (nm).
Applsci 11 10974 g005
Figure 6. Effect of laser fluence on nanoparticle mean diameter (nm).
Applsci 11 10974 g006
Figure 7. Effect of laser scan speed on nanoparticle mean diameter (nm).
Applsci 11 10974 g007
Figure 8. SEM images: (a) SEM image of sample 27C at 400 nm magnification and 30 kV acceleration voltage. (b) SEM image of sample 9C at 400 nm magnification and 20 kV acceleration voltage. (c) SEM image of sample 9C at 200 nm magnification and 30 kV acceleration voltage. (d) SEM image of sample 27C at 200 nm magnification and 30 kV acceleration voltage. (e) SEM image of sample 21C at 200 nm magnification and 20 kV acceleration voltage. (f) SEM image of sample 9C at 200 nm magnification and 9 kV acceleration voltage.
Applsci 11 10974 g008
Table 1. A 3 × 3 full factorial DOE showing the laser processing parameters for each sample group (1–27). Note that 3 repeat experiments were conducted for each sample group (n = 3).
#Ablation Time
(min)
Scan Speed
(mm/s)
Fluence (J/cm2)
1230001.83
2530001.83
32530001.83
4232501.83
5532501.83
62532501.83
7235001.83
8535001.83
92535001.83
10230001.88
11530001.88
122530001.88
13232501.88
14532501.88
152532501.88
16235001.88
17535001.88
182535001.88
19230001.91
20530001.91
212530001.91
22232501.91
23532501.91
242532501.91
25235001.91
26535001.91
272535001.91
Publisher’s Note: MDPI stays neutral with regard to jurisdictional claims in published maps and institutional affiliations.

