
Abstract
We report on the first measurement of resonant three-step, two-colour ionization of atomic molybdenum, using a hollow cathode lamp (HCL) with optogalvanic detection. Wavelength scans were made for two specific transitions involved in the ionization pathways under investigation, namely 4d5(6S)5s 7S3–4d5(6S)5p 7P4 and 4d5(6S)5p 7P4–4d5(6S)6d 7D5. So-called 'slow' and 'fast' optogalvanic signals were respectively observed for each resonant quantum jump and for the simultaneous excitation of the two laser frequencies. This successful detection confirms the HCL as a cost effective spectroscopic investigation tool. In particular its use in the optogalvanic mode of operation allows one to precisely, easily and reliably tune the wavelength of one or more lasers to resonances of interest for experiments in the general domain of atomic vapour laser isotope selection (AVLIS). This activity has been undertaken in the framework of the Selective Production of Exotic Species (SPES) project at the ISOL facility of the Legnaro National Laboratories of INFN. These measurements are a necessary step towards the realization of the MOLAS subproject of SPES, whose aim is to verify the production of 99m technetium for medical application via laser ionization of the 99 uma isotope of Molibdenum.
Export citation and abstract BibTeX RIS

Original content from this work may be used under the terms of the Creative Commons Attribution 4.0 licence. Any further distribution of this work must maintain attribution to the author(s) and the title of the work, journal citation and DOI.
1. Introduction
The resonance ionization laser ion source (LIS) [1, 2] technique is versatile and widely applied in isotope separator on-line (ISOL) facilities [3–7] where several radioactive ionic species are normally delivered to the target area for study. Due to its elemental specificity, LIS is employed in order to produce ion beams exhibiting selective physical composition such as mass and charge state. More specifically, by carefully tuning the photon energy of the laser(s), stepwise single and/or multicolour resonant excitations are induced resulting in atomic ionization [8, 9]. For a more detailed theoretical description of such processes the reader is directed to reference [10]. Since the electronic structure of each atom is unique, such ionization schemes are naturally element-selective and can even form the basis for schemes leading to isotope selection of a particular element. Hence, several off-line laboratories carry out investigations in order to develop efficient ionization schemes, tailored for different elements [11, 12].
In particular, atomic molybdenum has attracted significant interest from the radioactive ion beams (RIB's) community due to its use in nuclear medicine. Thus, the Molybdenum production with LASer techniques (MOLAS) project at the Selective Production of Exotic Species (SPES) ISOL facility in Legnaro National Laboratories (LNL) of INFN [13], focuses on the production of the 99mTc, which is a well-known medical radioisotope, by the combined use of a cyclotron proton beam and of selectively extracting laser beams.
The work reported here falls under the broad category of atomic vapour laser isotope separation (AVLIS) schemes [14]. More particularly, two colour resonant ionization studies on stable Mo were performed at the off-line laboratory that was recently installed in LNL [15]. Two dye lasers were used in order to excite Mo in a hollow cathode lamp (HCL) for measurements of multiphoton/ multicolour ionization of the metal vapour. The spectroscopic information is obtained via the well-established optogalvanic spectroscopy (OGS) technique [16–18]. In particular, the first dye laser can be tuned to the resonant energy jump connecting the ground state with an excited level of the atomic Mo, while the second one allows for a further resonant step towards a higher level, closer to the ionization limit. The Mo absorption of a third photon as taken from one of the two laser beams provides the final ionization in the continuum of states. The OGS signal shows the excitation induced dynamics triggered by the laser pulses and it is related to the changes in the electric discharge induced by the laser–vapor interaction. It contains complementary information on two different time scales: in fact, a signal on the nanosecond timescale and another signal on the microsecond timescale can be distinguished and analysed. The former component is the result of the direct photoionization process that occurs in the presence of the laser pulses [19], whereas the latter follows the changes that take place in the populations of the bound atomic levels. This signal is due to the exchange of energy of the Mo via collisions with the buffer gas in the HCL and those between excited ensembles of atoms. Despite its use in nuclear medicine and the fact that different versions of the LIS technique have been applied to a plethora of elements (for a review see e.g. reference [1]), specific two and three-step resonant excitation and ionization pathways in Mo have not been investigated yet. This is the main motivation for this short paper.
2. Experiment
A sketch of the experimental setup is shown in figure 1. In brief, a TDL50 dye laser was pumped by a frequency doubled Nd:YAG laser (Quantel YG580 series) delivering pulses at 532 nm at a 10 Hz repetition rate. The TDL50 dye laser was tuned to provide output pulses at a wavelength of 590.949 nm, by using a solution of Rhodamine 610 Perchlorate in methyl alcohol. The second laser was a LambdaPhysik FL2002 dye laser that was also pumped by a frequency tripled Nd:YAG laser (Quantel YG980 series) at a central wavelength of 355 nm. The active medium is a solution of Stilbene 420 in methyl alcohol. The output wavelength in that case was tuned to a centre value of 415.907 nm. A Toptica WS7 wavemeter was used to measure the laser wavelengths with a precision of a few parts in 107.
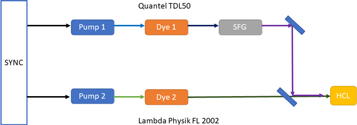
Figure 1. A simplified schematic of the experimental setup used to perform the optogalvanic measurements.
Download figure:
Standard image High-resolution imageThe UV (379.933 nm) wavelength was generated by sum frequency generation in a potassium dihydrogen phosphate (KDP) crystal. Specifically the 590.949 nm output from the TDL50 dye laser was mixed with the fundamental wavelength of the YG580 Nd:YAG laser. Both dye lasers could be wavelength tuned, by means of the software used to both acquire and process the data, so that independent tuning around the excitation wavelengths of 379.993 nm and 415.907 nm was possible. The average power was 0.3 mW for the TDL50 and 1.6 mW for the FL2002. The pulse durations for both the laser systems was ∼20 ns.
The two laser beams were directed towards the Heraeus Noblelight Mo hollow cathode lamp in a collinear geometry, using a mirror that is reflective in the ultraviolet (UV) spectral region and transparent in the visible region of the spectrum. Ne served as an inert filler gas. The hollow cathode lamp was powered by a KEPCO BHK 1000-40MG supply operated at a controlled current of 18 mA. The signals were recorded on a TDS540 Tektronix oscilloscope.
3. Results and discussion
Photographs of the slow (top panel) and fast (middle panel) optogalvanic signals on the oscilloscope screen are shown in figure 2, along with a partial energy level diagram illustrating the possible ionization pathways (bottom panel) using data from [20]. In the first step, the Mo atom absorbs a 379.933 nm photon, promoting it to the 7P4 excited state. In the second step, a 415.907 nm photon is absorbed, leaving the atomic system in the 7D5 excited state. Finally, the Mo atom is ionized by the absorption of either a 415.907 nm or a 379.933 nm photon, constituting the third step in this two colour, three photon ionization process. Generally speaking, the knowledge of this atom is relatively poor: for example, the hyperfine structure for the ground and excited states of Mo was reported some time ago [21, 22]. Since then, a few papers have described the interaction of Mo with light, especially in the IR—UV range.
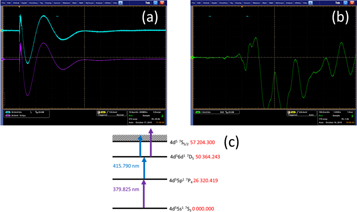
Figure 2. (a) The 'slow' optogalvanic signal recorded with the TDL 50 and the FL 2002 dye lasers tuned on resonance. The upper trace shows the real time signal while the lower trace is the result of averaging 250 single laser shot OG signals. The time base is set to 100 ns/div. The corresponding fast signal is shown in panel (b). A partial energy level diagram illustrating the relevant transitions in atomic Mo is shown in panel (c).
Download figure:
Standard image High-resolution imageIn order to investigate the resonance excitation and ionization of molybdenum atoms in the hollow cathode lamp, the authors performed wavelength scans in the vicinity of the transitions illustrated in figure 2(c). The corresponding spectra are presented in figures 3 and 4 and allow for the investigation of the relative efficiency of the different possible ionization pathways. Figure 3 shows the results obtained using the 'slow' OG signals while figure 4 was constructed using the 'fast' signals. In each case the spectral profiles were fitted with Lorentzian functions and the central wavelength values extracted. The laser wavelengths axes refer to the wavemeter readings.
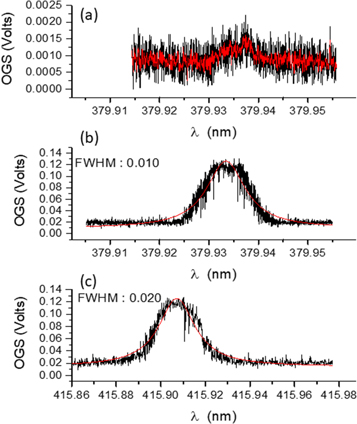
Figure 3. (a) The 'slow' OG signal acquired when only the laser beam from the TDL50 dye laser is present. The bright red trace is a 5-point moving average. (b) The corresponding signal obtained by scanning the FL 2002 dye laser wavelength when both lasers being present. (c) The signal obtained by scanning the TDL50 dye laser wavelength when both lasers being present. The red lines in panels (b) and (c) represent Lorentz profile fits to each OG spectrum.
Download figure:
Standard image High-resolution image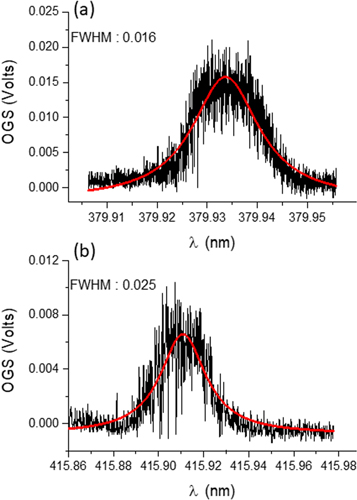
Figure 4. (a) The 'fast' optogalvanic signal obtained when a scanning of the FL 2002 wavelength, with both lasers on. (b) the same measurement performed by scanning the TDL50 wavelength while both lasers are on. The red lines in panels (a) and (b) correspond to the Lorentz fits.
Download figure:
Standard image High-resolution image
The origins of the 'slow' and 'fast' optogalvanic signals are as follows. In the former case, the absorption of laser radiation in the discharge leads to a change in the steady-state population of bound atomic or molecular levels. Since different levels will have different ionization cross-sections and hence ionization probabilities, a perturbation of the steady-state population distribution results in a net change in the discharge current (or an equivalent change in the discharge impedance). Since ionization in this case mostly results from collisions between excited species (and between electrons and excited species), mediated by the buffer gas, the signal evolves on a timescale which is long compared to the initial laser excitation pulse or pulses: this takes place usually on a microseconnd timescale. On the other hand, the 'fast' signal arises from direct laser photoionization and can be ascribed to pure single/multicolour-multiphoton ionization. Hence the 'fast' signal follows the laser pulse temporal behaviour and so it exists on the nanosecond timescale.
Figure 3(a), top panel, shows the 'slow' OG signal obtained when the laser beam from the TDL50 dye laser was tuned around the 4d5(6S)5s 7S3–4d5(6S)5p 7P4 transition at 379.993 nm to excite the molybdenum vapour in the hollow cathode lamp while the FL2002 laser was off: this is a simplified one colour experiment. The signal is clearly very weak with a voltage difference of only about 1 mV between the peak value of the optogalvanic signal and the baseline voltage. As the laser-populated excited state lies only about 3.26 eV above the ground state, it is quite far from the ionization threshold, at approximately 3.8 eV. Hence ionization will rely heavily on collisions between Mo atoms in excited states. However, one single collision between a pair of Mo atoms, each in the 4d5(6S)5p 7P4 state, should not be able to ionize a Mo atom and hence more than a single binary collision is needed per Mo ionization event. Therefore the signal would be expected to be weak, as observed. It is worth noting that this single colour scheme, with its quite low signal-to-noise ratio (SNR) can not be considered well suited to the envisaged application in laser tuning for isotope ion detection, classification and potential separation.
In an attempt to improve the overall SNR for the OG signals, an optical double-resonance scheme (figure 2(c)) was investigated. Two separate experiments were carried out. In one case the wavelength of the TDL50 dye laser was scanned around the 4d5(6S)5s 7S3–4d5(6S)5p 7P4 transition (379.933 nm) while holding the second dye laser (FL2002) at a fixed wavelength of 415.907 nm, corresponding to the (4d5(6S)5p 7P4–4d5(6S)6d 7D5 transition. In the other case the TDL50 laser was held fixed at 379.933 nm and FL2002 laser was scanned around the 415.907 nm central wavelength.
Figure 3(b) shows the result from the first experiment. The scanning window was approximately 0.05 nm around the central wavelength of 379.933 nm. A Lorentzian profile fit to the OG spectrum yielded a FWHM for the main peak of ∼0.01000 ± 0.00010 nm. The central wavelength was obtained to be 379.93341 ± 0.00004 nm. It is clear that the optogalvanic signal is up to 100 times larger in this case than in figure 3(a). The two-step resonant ionization process is therefore significantly more efficient at selectively ionizing an isotope of interest, one of the key goals of the SPES project. The result exhibits two desirable and important features of this particular two colour AVLIS technique, ionization selectivity and efficiency.
For figure 3(c), the TDL50 laser wavelength was fixed at 379.933 nm, resonant with the first excitation step (4d5(6S)5s 7S3–4d5(6S)5p 7P4) while scanning the FL2002 laser over a window of ca. 0.14 nm centred on a wavelength of 415.907 nm, i.e., scanning across the 4d5(6S)5p 7P4–4d5(6S)6d 7D5 transition. The FWHM of the main peak, following a Lorentzian profile fit was ∼0.02000 ± 0.00040 nm. The central wavelength was obtained to be 415.90717 ± 0.00010 nm. The optogalvanic signal is comparable in height with that shown in figure 3 (b), indicating similar ionization efficiency. Also, the second step resonance is twice the width of the first step resonance. Hence, it is also less sensitive to laser wavelength jitter, which might be an advantage in practice, when using the OG spectroscopy for laser tuning and monitoring.
A similar study was performed using the 'fast' components of the optogalvanic signals. These signals exist only when the dye laser fields are both present, i.e., for ∼20 ns. The results are shown in figure 4. Hence their origin is easier to explain as simply due to optical double resonance excitation (379.933 nm + 415.907 nm) followed by ionization by either field.
Figure 4 (a) is the result of scanning the wavelength of the FL2002 dye laser while keeping the second (TDL50) laser at a fixed wavelength of 415.907 nm corresponding to the second step 4d5(6S)5p 7P4–4d5(6S)6d 7D5 transition. Again, the scanning window was set to 0.05 nm. The computed maxima of the acquired signal are plotted versus the laser output wavelength to obtain the OG spectrum shown. A Lorentzian profile fit results in a FWHM of ∼0.01620 ± 0.00040 nm at a peak wavelength of 379.9337 ± 0.00005 nm, in good agreement with the linewidth obtained by scanning the TDL50 wavelength in the case of the slow optogalvanic signal. What is most striking is that the peak of the electron signal in this case is only ca. 15 mV or some five times lower than in the slow signal case. One can only conclude that the collection efficiency of electrons is lower than for ions since the dominant charge state is expected to be singly ionized Mo and so the ion and electron densities due to photoionization should be comparable. One would not expect the Ne ion and electron densities to be significantly affected by laser ionization as the ionization potential for Ne is so high and the lasers are not resonant with any Ne or Ne ion states.
Figure 4(b) shows the wavelength dependence of the maximum amplitude of the fast optogalvanic signal acquired while keeping the FL2002 laser wavelength fixed at 379.933 nm while scanning the TDL50 dye laser wavelength. The scanning window was set to 0.12 nm. The FWHM of the resulting feature, obtained from a Lorentzian profile fit, is about 0.02500 ± 0.00090 nm and the peak wavelength is 415.91080 ± 0.00020 nm. Once again, the collected electron signal is lower than the ion signal, and in this case, the peak value is ∼ 6 mV and hence lower by a factor of more than two times compared to figure 3. As the corresponding ion signals for both cases are comparable, it is concluded that in this case the electron collection efficiency is lower than for ions and the result is likely not due to e.g., some significant mismatch between the ion and electron densities. The exact mechanism for the differences observed in the electron signals remains to be elucidated.
4. Conclusions
To conclude with, we have reported the first spectroscopic experimental evidence of the resonant ionization of Mo using a hollow cathode lamp (HCL). Results from this work confirm the effective use of HCL as a cost effective spectroscopic investigation tool. In particular its use in the optogalvanic mode of operation allows the user to precisely, easily and reliably tune the wavelength of one or more lasers to resonances of interest for experiments in the general domain of atomic vapour laser isotope selection (AVLIS). It could also be used to monitor such wavelengths and provide cheap and simple signals for closed loop wavelength control systems at ISOL and other atom/ion beam facilities. Finally, we note that the second step in the scheme investigated here is stated to be some 300 times weaker than the first step in the NIST database [20]. However, these line strengths are often not measured. In addition the structure and hyperfine structure of many excited states are still not known. Therefore both atomic structure calculations and further experiments on the fine and hyperfine structure of excited states in atoms and ions of potential interest for radiotherapy and other applications is a significant strategic need in the drive for further progress in these application domains.
Acknowledgments
LV acknowledges support by the Education, Audio visual and Culture Executive Agency (EACEA) Erasmus Mundus Joint Doctorate Programme EXTATIC, Project No. 2013 0033. The DCU group's work was supported by Science Foundation Ireland Grant Nos. 16/RI/3696, 19/FFP/6956 and and SEAI Grant No. 19/RDD/556. Work associated with EU H2020 COST Action No. CA17126 (TUMIEE).
Data availability statement
All data that support the findings of this study are included within the article (and any supplementary files).