

Abstract
A Langmuir probe was used to measure various electron plasma parameters in O2 capacitively coupled plasma. It was shown that the variation in these plasma parameters was due to changes in the electron heating mechanisms as the discharge conditions varied. The so called 'α–γ' mode transition in O2 plasma (100 mTorr) was identified from the power evolution (30–600 W) of the electron energy probability function (EEPF), electron density (ne) and effective electron temperature (Teff). The EEPF evolved from Druyvesteyn to bi-Maxwellian with increasing applied power which resulted in a rapid decrease and an abrupt increase in Teff and ne respectively. Comparisons were made to the same mode transition for similar conditions in Ar plasma. The EEPFs were Druyvesteyn in the α mode and evolved into a Maxwellian like EEPF in the γ mode of an Ar plasma. Two distinct trends of ne versus power was observed, it was shown that the measured rf current and rf voltage had a similar behavior. The pressure evolution of the EEPF, ne, and Teff was also investigated in O2 plasma operated at both 30 and 200 W. At 30 W the number of high energy electrons decreased and flattening of the low energy portion of the EEPF occurred with increasing gas pressure (10–100 mTorr) which indicates a collisionless to collisional heating transition. However, at 200 W the right combination of rf voltage and pressure was met for the discharge to evolve into the γ mode as the pressure increased. This was evident from significant narrowing of the EEPF as the pressure increased.
Export citation and abstract BibTeX RIS
1. Introduction
Knowledge of the electron kinetics is of critical importance for understanding fundamental physical processes within plasma. Parameters such as the electron density, ne, the electron temperature, Te, and the electron energy distribution function (EEDF) are particularly useful for understanding important quantities in plasma physics such as reaction rates e.g. dissociation, ionization, excitation, radical production and also fundamental plasma quantities such as the Debye length, electron–ion and electron-neutral mean free paths and the plasma frequency. Electron plasma parameters such as density, temperature and the energy distribution depend on the plasma operating conditions such as gas composition, pressure, applied power, reactor geometry and reactor material [1, 2]. These operating conditions govern the mechanisms by which electrons are 'heated' for sustaining the discharge. A comprehensive understanding of the various electron heating mechanisms and associated electron plasma parameters will therefore allow for a better optimization of plasma aided processes e.g. etching for IC manufacturing.
Langmuir probes are by far the most popular technique for investigating the dynamics of charged species within plasma. The electron kinetics and various electron heating mechanisms in capacitively coupled plasma (CCP) have been extensively studied with Langmuir probes [1–7], however these studies have been restricted to noble gases such as argon and helium. Experimental reports on the electron kinetics in molecular plasmas commonly used in processing such as O2 are less available. O2 inductively coupled plasmas (ICPs) has been studied by several authors [8–12], however very few studies of O2 capacitive discharges are available. Lee et al [13] reported on the pressure variation (3–100 mTorr) of the EEPF, the density of the low and high electron energy groups and the temperature of the low energy electron group in an O2 CCP. Pulpytle et al [14] reported a bi-Maxwellian EEPF in O2/Ar (75/25%) CCP operated at 110 mTorr and for applied rf potential of 320 V. The variation of Teff and ne as a function of applied rf voltage was also reported. More experimental studies of O2 capacitive discharges are required to increase our understanding of processing type plasmas and also to benchmark computational studies.
A key goal of this paper is to provide measurements of electron plasma parameters in O2 CCP due to limited experimental data in the literature and also to attempt to correlate these findings with electron heating mechanisms and mode transitions. However, it is important to note that time averaged Langmuir probe measurements in the plasma bulk alone can only partly examine the electron heating mechanisms since only the static isotropic electron energy distribution is measured. In CCP there are many complex electron interactions at the plasma-sheath boundary that can produce electron beams which have a significant time varying anisotropic energy distribution component [15]. Also, in electronegative plasmas the influence of negative ions can impact Teff and ne making results difficult to interpret. More recent studies in electronegative plasma by Schulze et al [16] have shown a novel electron heating operating mode known as the drift-ambipolar (DA) mode. In the DA mode ionization is caused by strong drift and ambipolar fields and is dominant in both the bulk and at the sheath-boundary. To investigate these important aspects in order better understand electron heating mechanisms requires diagnostic techniques other than Langmuir probes. Techniques such as phased resolved optical emission spectroscopy and particle-in-cell simulations provide detail of the spatiotemporal variations in the electron kinetics, rates of excitation/ionization/electron heating and spatiotemporal electric fields and more.
One of the common mode transitions in CCP is the α–γ transition which occurs at intermediate pressures (0.1–1 Torr) and for changes in the discharge power or rf current/voltage [3, 5, 17, 18]. This transition occurs as the rf potential on the driven electrode reaches a critical threshold such that the accelerating ions generate secondary electrons (SE). These SE emitted from the electrode become accelerated in the sheath to cause ionization. An electron avalanche develops as the discharge enters the γ mode which results in rapid variations of ne, Teff and the EEPF. For the first time, the power evolution of the EEPF in O2 CCP (100 mTorr) is reported. A wide power range (30–600 W) was explored so that the EEPF was investigated for two discharge modes (α and γ modes). The powers reported in this paper are the applied input powers only (rf generator set point) and not a measured or calculated power. In this report two distinct trends of ne versus applied power in oxygen plasma was observed which is contrary to other reports [1, 5]. A hairpin probe was used to measure and compare ne over the same conditions to better interpret this trend. The α–γ transition in an argon plasma was also investigated for comparison with the same mode transition in an oxygen discharge. An IV probe was also used to measure and investigate the relationship between the rf current and voltage and applied input power.
Transitions in the dominant electron heating mechanisms are also observed for changes in the gas pressure [1, 19–22] which can result in abrupt changes in electron characteristics such as the EEPF, ne and Teff. Collisionless (stochastic) electron heating is observed at low pressures where the electron-neutral mean free path,  , is comparable or greater than the discharge length i.e.
  . Thus, electrons can reach the oscillating sheaths where kinetic energy is gained to ionize the background gas. Associated with the collisionless electron heating regime is an EEPF which is characterized by two distinct low and high energy electron groups (bi-Maxwellian). At high pressures the electron-neutral mean free path is small and electrons collide more frequently with the background gas instead of the sheaths i.e.
  . Thus, the discharge is said to be in the collisional (ohmic) heating regime as the electrons gain energy for ionization by interaction with the small rf electric field in the plasma bulk. The variation of the EEPF, ne and Teff as a function of gas pressure was investigated with use of a Langmuir probe in this paper. The pressure evolution of the EEPF, ne, Teff, rf current and voltage in O2 plasma is reported for fixed applied powers of 30 and 200 W corresponding to regimes where SE have different significances on the plasma. 30 W corresponds to a power where SE have little influence on the ionization balance of the discharge. It will be demonstrated that the stochastic to collisional heating transition occurs as the pressure increased at this low power. However at a higher applied power setting of 200 W SE are found to significantly influence the ionization balance. A transition from a stochastic to SE dominated discharge was observed as the pressure increased at 200 W.
Through over 40 years of research, significant advancements have been made in understanding electron heating phenomena in industrial plasmas. However, it should be noted that due to the wide range of electron interactions in a highly complex environment that some fundamental electron heating processes are still not fully understood. Many theoretical/numerical models have been developed to understand various topics such as non-local electron kinetics, Fermi heating, the pressure heating effect and the plasma series resonance effect. These more recent studies can be found in the literature [23–28].
2. Experiment
2.1. The oxford instruments plasmalab 100
The plasma source investigated in this study was an Oxford instruments plasmalab system 100 [29]. Only a brief outline of this plasma system is given in this section, more details can be found elsewhere [30]. The plasmalab system 100 is a capacitively coupled (parallel plate) plasma, CCP, which was excited with 13.56 MHz rf power. Figure 1 shows a simplified schematic of the important features of this plasma system. The plasma system was geometrically asymmetric and the plasma was confined laterally between the electrodes and extends out in the radial direction towards the outer walls. The reactor (inner bore) was cylindrical in shape and has radial and axial lengths of 380 and 130 mm respectively. The plasma did not extend into the free space below the driven electrode. The driven electrode was 205 mm in diameter and was capable of holding 200 mm wafers, the electrode separation distance was 45 mm. The grounded electrode was 295 mm in diameter and also served as the shower-head to supply the feedstock gas, the chamber walls (radial) are grounded. The reactor material (walls and electrodes) is made from an aluminium alloy (6082) whose main chemical component is Al but also contains small amounts of Mg (1.2%), Si (1%), Mn (0.8%), Fe (0.25%) and Zn (0.25%). Access ports on the chamber allowed for electrical probes to be positioned at the radial and axial center of the discharge i.e. 190 mm from the inner (radial) wall and 22.5 mm from the driven/grounded electrode.

Figure 1. Schematic of the oxford instruments plasma system.
Download figure:
Standard image High-resolution image2.2. The SmartProbe
The Langmuir probe used in this work was a SmartProbe from Scientific Systems [31]. This probe deploys passive compensation using a compensation electrode and was also equipped with a floating reference probe. The probe tip was made from cylindrical platinum wire which was 10 mm in length and 0.15 mm in diameter. Platinum was used to reduce the degree contamination and thus minimize distortion of the IV data (probe current/voltage). The probe potential was swept from −95 to 95 V and the sampling size was 100 samples per point, the IV trace used for analysis was an average of ≈20–30 sweeps. The tip was cleaned before each sweep by electron bombardment until it glowed red hot. This was achieved by biasing the tip positively for ≈2–3 s depending on the plasma density. This procedure ensured a reproducible IV trace was obtained which was free from contaminants such as an oxide layer which has a low conductivity. The tip was replaced regularly to avoid changes in the tip dimensions from etching particularly in reactive plasma such as O2.
In this work the Druyvesteyn method [32] was used to determine ne, Te and the EEPF. This is the most widely used method for determining electron plasma parameters in processing plasmas since it is independent on the particular shape of the electron energy distribution and is directly related to the second derivative of the measured electron current with respect to probe voltage. More details of the Druyvesteyn technique and details for removing the positive ion current can be found elsewhere [30].
2.3. Hairpin probe
A hairpin probe is a useful plasma diagnostic instrument which measures the electron density [33]. The hairpin probe used for this work was developed by Gaman et al and more detail can be found elsewhere [34]. The basic principle of the hairpin probe is that a microwave powered resonator consisting of an antenna immersed in plasma will experience a different resonance frequency,  , compared to the resonance frequency,
  , under just vacuum conditions. The electron density, ne, can be determined by measuring this pair of frequencies and using

where  is the vacuum permittivity, me and e are the mass and charge of an electron respectively. A sheath correction factor was applied to compensate for the change in the permittivity due to the formation of a sheath around the hairpin probe antenna. The correction factor was most important for measurements taken at low rf powers and low electron densities. More details of this sheath correction factor can be found elsewhere [33, 34].
2.4. IV probe
In this work an Octiv VI probe from Impedans Ltd [35] was used as a inline monitor of the rf current/voltage. The Octiv VI probe measures rf current, voltage and phase angle to a high accuracy and at a time resolution on the order of micro-seconds. In this work however, the steady state current and voltage (rms values) was determined only. The probe was positioned between the match unit and driven electrode.
3. Results and discussion
3.1. The α–γ transition in O2 plasma
Figure 2 shows the power evolution of the EEPF measured with a Langmuir probe in an oxygen plasma operated at 100 mTorr. Significant changes in the shape of the EEPF was shown as the power increased from 30 to 75 W. The number of bulk electrons (0–4 eV) rapidly increased with increasing power within this range. Also, the width of the EEPF became progressively narrower as the applied power increased which correlates to a decrease in the effective electron temperature.

Figure 2. Power evolution (30–600 W) of the EEPF in pure O2 plasma operated at 100 mTorr. The significant change in the EEPF is due to the α–γ mode transition.
Download figure:
Standard image High-resolution imageThe EEPFs are concave in shape and closely resembles a Druyvesteyn distribution for low powers (≈30–40 W). The broadening of the EEPFs in the low power range is typical for discharges sustained by ohmic or collisional heating. Examples of this broadening of the EEPF was also observed in capacitive discharges (Ar, N2) under conditions which are favorable for ohmic heating i.e. moderate pressures (0.1–1 Torr) and low applied rf potential or alternatively low discharge current density [1, 3, 4, 17, 20, 36]. The shape of the EEPFs in the power range of 50–75 W resembled a bi-Maxwellian distribution and evolved into a distinctly bi-Maxwellian distribution upon increasing the applied power greater than 75 W. No significant change in the shape of the EEPF occurred for powers between 100 and 600 W.
The significant reshaping of the EEPF between 30 and 75 W seen in figure 2 indicates the occurrence of the α–γ transition. This occurs when a significant fraction of the applied power or voltage is coupled into the driven sheath. This power is predominantly transferred to the ions which are accelerated by the large electric field across the sheath and release SE upon transfer of kinetic energy onto the surface of the driven electrode. These SE are then accelerated by the oscillating sheath leading to significant ionization at the plasma-sheath boundary. Ions produced by SE are again accelerated into the electrode which produce more SE so that an electron avalanche develops and consequently ne increases abruptly. This is most significant at moderate to high pressures, i.e. 0.1–1 Torr, where the electron-atom/molecule collision rate is sufficiently high. In this regime the SE dominate the ionization balance and consequently the bulk rf electric field and electron temperature decreases to prevent further ionization. The discharge is said to be in the γ mode when this occurs as the ionization occurs predominantly by these SE.
The power variation of Teff and ne are shown in figure 3, both Teff and ne show abrupt changes as the power varied in the range of 30–75 W which corresponds to the α–γ mode transition. The behavior of Teff and ne with power seen in figure 3 is consistent with previous findings in argon and helium CCP [1, 2, 5] and was also explained by the occurrence of the α–γ transition. The threshold conditions for which the discharge enters the γ mode is defined by the steepest  dependence [3], where Prf is the applied rf power. Alternatively it can also be found by the steepest dependence of Teff with applied voltage/current. The threshold power for the γ mode transition in O2 plasma operated at 100 mTorr was observed at 50 W which corresponds to 188 V. As the α–γ transition occurs between 30 and 50 W the plasma is likely sustained by a combination of collisional heating and SE within this range.
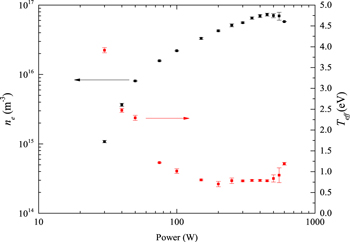
Figure 3. Variation of Teff (red square) and ne (black square) as a function of applied power in O2 plasma operated at 100 mTorr. The abrupt changes in Teff and ne with increasing power is due to the α–γ mode transition.
Download figure:
Standard image High-resolution imageIt is possible that the presence of negative ions contributes to the results shown on figures 2 and 3. This would occur if the plasma evolved from a region of high to low electronegativity as the power increased. However, the primary reason for these observations shown on figures 2 and 3 is still thought to be due to the α–γ transition. This is supported in a further section 3.2 where the α–γ transition is shown for an Argon plasma for similar RF voltage/current/power conditions with no negative ions present. Neverthless, it is worth noting that changes in the electronegativity can also influence the shape of the EEPF, ne and Teff [37, 38] although supporting evidence (negative ion density measurements) would be required to quantify its contribution in this case.
Similar changes in the EEPF for the α–γ transition as measured with a Langmuir probe in argon and helium capacitive discharges have been reported elsewhere [1, 2, 5], although, the electron energy distribution can be specific to the gas used for a given discharge mode. For example, the α mode in Ar plasma is characterized by a Druyvesteyn EEPF while a Maxwellian EEPF was observed in a He plasma for the same mode [1]. Similarly, a Maxwellian EEPF was measured in Ar plasma in the γ mode whereas a bi-Maxwellian was reported in the γ mode of He plasma [1]. In addition, the shapes of the EEPFs can be different even for the same background gas and similar discharge conditions. For example, a bi-Maxwellian EEPF was reported in the γ mode of Ar plasma at at 300 mTorr [5] which is contrary to findings by Godyak et al [1] where a a Maxwellian EEPF was shown. A bi-Maxwellian EEPF in the γ mode of a H2 plasma operated at 300 mTorr was also shown by Abdel-Fattah et al [17]. To date, the authors have not found an EEPF variation study over the α–γ mode in O2 CCP in the literature for comparison. Although in two cases, the α–γ transition was observed in oxygen plasma by means of a decrease in the electron temperature with increasing applied voltage [14, 39].
3.1.1. Investigation of the low and high energy electron groups in O2 plasma at 100 mTorr
Using the measured EEPF allows for the analysis of the low and high energy electron groups provided the EEPF can be well approximated by a bi-Maxwellian distribution. The densities (nlow, nhigh) and temperatures (Tlow, Thigh) of the low and high energy electron groups have been determined for powers between 100 and 600 W since the criteria for a bi-Maxwellian EEPF is valid over this power range. nlow and nhigh were determined by integrating the EEDF within a given energy range that is defined by the approximate electron energy where the EEDF experiences a change in the slope or a 'kink'. In this work; this energy was ≈3 eV in O2 plasma at 100 mTorr operated between 100 and 600 W. Tlow and Thigh were determined by a plot of ln  versus ε; the temperature of an electron group was found by −1/slope where the slope was found by a linear fit to the data (ln
  versus ε) in a given energy range where a linear dependence was satisfied.
Figure 4 shows the power variation of nlow and nhigh for a fixed pressure of 100 mTorr in O2 plasma. The low energy electron population increased linearly between 100 and 350 W followed by saturation and a decrease for powers above 350 W. This variation of nlow versus power for (100–350 W) is expected since an increasing number of SE are created which generates more electrons from ionizing the background gas, these electrons then fall into the low energy group.

Figure 4. Variation of nlow (hollow circles) and nhigh (filled squares) as a function of applied power in pure O2 plasma operated at 100 mTorr.
Download figure:
Standard image High-resolution imageFigure 4 shows an unusual trend as nlow saturated for powers above 350 W. This saturation effect will be discussed in more detail in section 3.1.2. nhigh increased with increasing power and no saturation was observed at high powers. The densities of the low and high electron groups increased by similar magnitudes i.e. a factor of ≈3.6 and 2.0 between 100 and 450 W respectively.
Figure 5 shows the variation of Tlow and Thigh as function of increasing power for a fixed pressure of 100 mTorr O2. The temperature of the high energy group increased gradually with increasing power. These electrons gain kinetic energy from the oscillating sheath as the sheath potential increases with increasing power, hence, Thigh increases with increasing power. However, Tlow decreased with increasing power which is expected since the temperature of the bulk electrons predominately determines Teff which was observed to decrease with increasing power due to the α–γ transition as discussed in section 3.1.

Figure 5. Variation of Tlow (hollow circles) and Thigh (filled squares) as a function of applied power in pure O2 plasma operated at 100 mTorr.
Download figure:
Standard image High-resolution image3.1.2. Comparison of  determined with a Langmuir and hairpin in O2 plasma

The power variation of ne (see figure 3) shows two distinct trends. Firstly, ne rapidly increased while increasing the power from 30 to 100 W which is due to the development of an electron avalanche as the discharge enters the γ regime. Secondly, a gradual increase of ne followed by saturation was observed as the power increased above 100 W. This behavior of the electron density is unusual and is generally not observed in similar studies [1, 5]. A hairpin probe was used to measure ne which provides a independent diagnostic in order to investigate this unusual trend and discount any ambiguity of ne determined with a Langmuir probe. An example of a situation where Langmuir probe measurements could be compromised is when significant probe contamination occurs by sputtered electrode material which can distort the IV characteristics or alter the net dc current drawn by the Langmuir probe by a change in the series resistance. A possible explanation to the saturation of ne could be if there is a nonlinear relationship between the applied power and the actual power deposited into the plasma. Power losses can occur in the matching unit by insufficient impedance matching which may cause nonlinearity between the applied power and deposited power.
The comparison of the electron densities determined with the Langmuir and hairpin probe is shown on figure 6. Generally, these techniques produce results which are in excellent agreement [33]. Reasonable qualitative and quantitative agreement between both techniques is evident from figure 6. This is a reasonable statement to some extent, however, a discrepancy was observed for powers above 450 W, ne determined with the Langmuir probe decreased while the hairpin probe measured a continual increase of ne for powers above 450 W. Such discrepancy may be due to considerable contamination of the Langmuir probe tip by sputtered electrode material. However, the emphasis is not on the accuracy of each independent technique but on the qualitative agreement and the appearance of saturation of ne at high powers.

Figure 6. Comparison of ne measured with both a Langmuir probe (•) and hairpin probe (△) as a function of applied power in pure O2 plasma operated at 100 mTorr.
Download figure:
Standard image High-resolution imageThe rms values of the rf voltage, Vrms, and current, Irms, was measured with an Octiv VI probe from Impedans in order to investigate this behavior of ne. Figure 7 shows Vrms and Irms versus applied rf power in O2 and Ar plasma (100 mTorr). Both Irms and Vrms showed rapid variation between 0 and 100 W followed by a more gradual increase (near saturation) for powers greater than 100 W. This voltage/current behavior indicates a possible change in the dependence of the actual transmitted power with applied input power. Further evidence is required i.e. the phase angle to make an exact conclusion on this power dependence. An example of a similar rf voltage versus discharge power relationship was shown by Godyak et al [40], although only slight saturation of the rf voltage was observed. No examples of such profound saturation of ne was found in the literature for comparison. It can be concluded that this unusual saturation trend of ne is indeed real and erroneous results obtained by an inadequate Langmuir probe can be discounted. The reason for ne to saturate at higher powers is still unclear but a possible explanation is due to a change in the dependence of transmitted power with applied power.
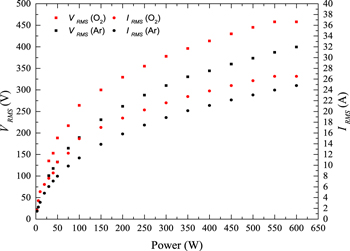
Figure 7. Comparison of the measured rf voltage (Vrms) and rf current (Irms) as function of applied power in argon and oxygen plasma (100 mTorr).
Download figure:
Standard image High-resolution image3.2. The α–γ mode transition in argon plasma (comparison to oxygen plasma)
Section 3.1 discussed a significant reshaping of the EEPF and abrupt variations of ne and Teff as a function of applied power in O2 plasma. These findings are typical in CCP when changes in the electron heating mechanisms or mode transitions occur, in particular the α–γ transition. Reported in this section is the α-mode transition in Ar plasma operated at 100 mTorr and for powers ranging from 20 to 600 W. Comparisons were made to the same mode transition in O2 plasma. The power evolution of the EEPF in Ar plasma operated at 100 mTorr is shown on figure 8.
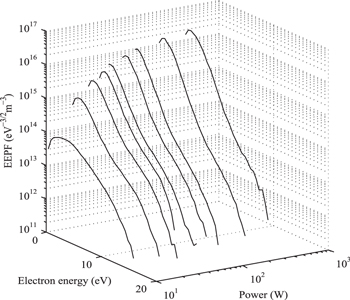
Figure 8. Power evolution of EEPF as a function of applied power in pure argon plasma operated at 100 mTorr.
Download figure:
Standard image High-resolution imageThe shape of the EEPF varied significantly as the power increased from 20 to 50 W. The EEPF resembles a Druyvesteyn distribution between 20 and 40 W and evolved into a Maxwellian like distribution for powers greater than 40 W. No significant change in shape of the EEPF was observed for powers above 40 W, however the population of the bulk electrons increased significantly as the power increased. This variation of the EEPF is due to the α–γ transition and is consistent with other Langmuir probe studies in Ar CCP [1, 17]. The most apparent difference between the shapes of the EEPFs in Ar plasma with respect to O2 plasma (figure 2) is that in the high power regime (100–600 W) the EEPFs are distinctly bi-Maxwellian in O2 plasma whereas only one main electron group was observed in Ar plasma. Also, the low energy electrons are characterized by a three-fold higher electron temperature in Ar plasma compared to O2 plasma. A clearer comparison of these EEPFs is shown in figure 9.

Figure 9. Comparison of EEPFs in both Ar and O2 plasma operated 100 mTorr and 400 W.
Download figure:
Standard image High-resolution imageThe EEPFs shown in figure 9 at 400 W are consistent with findings by Lee et al [13] in CCP operated at a fixed power of 120 W (12.5 MHz). The authors suggested that collisional heating was inefficient in O2 plasma due to a weak electric field, hence, the observation of a bi-Maxwellian EEPF instead of a Maxwellian like EEPF measured in Ar plasma. This hypotheses was demonstrated by coupling 2 W of inductive power at 13.56 MHz into the O2 CCP plasma which heated the low energy electron group, consequently a distinctly bi-Maxwellian EEPF evolved into a Maxwellian EEPF. However, the differences in the EEPFs in O2 and Ar at 100 mTorr and 400 W as shown in figure 9 could have an alternative explanation. Unlike the conditions shown by Lee et al [13], in this case the discharge is in the gamma mode (at 400 W) where the bulk electric field drops and ohmic heating does not play a significant role in the ionization balance. However, if a small electric field still exists in the discharge center it is possible that there may be some energy transfer that may influence the low energy electrons. Not to the extent that sufficient energy is gained by low energy electrons to cause ionization but enough to explain the smaller temperature of the low energy electron group in O2 plasma compared to Ar plasma. However, no exact conclusions can be drawn without further supporting evidence, alternatively the differences in the EEPFs could also be due to the many more inelastic collisions in O2 plasma compared to Ar plasma or differences in the elastic cross-sections.
3.2.1. Comparison of Teff and in O2 and Ar CCP

The comparison of the power variation of ne and Teff in O2 and Ar plasma operated at 100 mTorr is shown on figures 10 and 11 respectively. The variation of ne as a function of power is similar in both discharges. A rapid increase in ne occurs for powers 30–100 W which is followed by a gradual increase for powers greater than 100 W.

Figure 10. Comparison of ne measured in argon (◦) and oxygen (•) plasma as function of applied power, the gas pressure was 100 mTorr.
Download figure:
Standard image High-resolution image
Figure 11. Comparison of Teff measured in argon (◦) and oxygen (•)plasma as function of applied power, the gas pressure was 100 mTorr.
Download figure:
Standard image High-resolution imageThe reasons for the gradual variation of ne at higher powers was already discussed in section 3.1. However, in O2 plasma ne is lower than in Ar plasma particularly for powers ≈30 W where the difference can be up to ≈6 fold. This is unexpected due to the higher rf voltage/current in O2 plasma. The generation of negative ions by attachment reactions in O2 plasma is a likely explanation for the lower electron density. The measured Teff in O2 plasma was greater than in Ar plasma when the discharge is operated in the α mode. This is attributed to a higher collisional heating by the rf electric field due to the much lower ne in O2 plasma in the low power range since  where E is the rf electric field and JO is the discharge current density.
3.3. Investigation of the electron kinetics as a function of gas pressure in O2 plasma
3.3.1. Pressure evolution of the EEPF, and Teff at 30 W

The pressure evolution of the EEPF and the corresponding ne and Teff in O2 CCP operated at 30 W is shown on figures 12 and 13 respectively. As already shown in section 3.1 the threshold power for the α–γ transition was 50 W for an intermediate pressure of 100 mTorr. In this section a fixed power of 30 W was used to ensure SE emission had as little influence as possible on the ionization balance of the discharge. Thus, as the pressure was increased the discharge remains in the α mode and the collisionless to collisional heating transition occurs. Due to limitations of the Langmuir probe used in this work the extremely collisional plasma conditions i.e. ≈0.1–1 Torr was not explored. However, the effects of increasing the pressure on the electron kinetics within the pressure range of 10–100 mTorr are apparent although not as profound as reported in other examples [1].
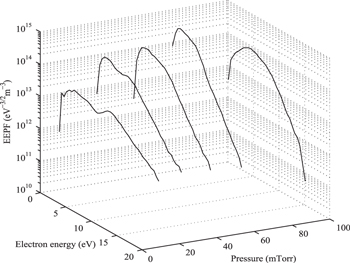
Figure 12. Pressure evolution of the EEPF in O2 plasma operated at 30 W.
Download figure:
Standard image High-resolution image
Figure 13. Pressure evolution of ne (black circles) and Teff (red squares) in O2 plasma operated at 30 W.
Download figure:
Standard image High-resolution imageThe tail of the EEPF in the energy range close to the O2 ionization potential (≈12 eV) decreased significantly with increasing gas pressure (10–100 mTorr). This is consistent with the inverse relationship between the ionization rate constant and neutral gas density as derived from the particle balance equation [4],

where kion is the ionization rate constant evaluated using the normalized EEDF, ionization cross-section and electron velocity, uB is the Bohm velocity, ng is the neutral gas density and deff is the effective plasma size which accounts for the edge to center density ratio in both the radial and axial directions. kion is sensitive to changes in the EEDF or Te (for a Maxwellian distribution) and can vary by several orders of magnitude for changes in Te in the range of 1–5 eV, however, uB is less sensitive to Teff and has a  dependence. Thus, the ionizing tail of the EEPF should decrease with increasing pressure provided negligible changes in deff.
 for the low energy electron group and for low pressures of 10, 30 and 50 mTorr is ≈207, 70 and 40 mm respectively. These electrons have a mean free path much larger than the plasma half-width (12–15 mm), however, they can not reach the oscillating sheath as they are confined in the bulk by the dc ambipolar potential barrier. The corresponding
  for the high energy electron group for the same pressures is ≈37, 14 and 8 mm respectively which is comparable to or greater than the plasma half-width. These electrons have enough energy to over come the dc ambipolar potential well in the bulk to reach the plasma-sheath boundary. Their energy which is lost by inelastic collisions is compensated by energy gained by the sheath.
Associated with conditions favorable for stochastic heating is a bi-Maxwellian electron energy distribution with a characteristic low bulk electron temperature (≈0.5 eV) and a high tail electron temperature (≈3 eV). However, an EEPF with such characteristics was not observed in this case, particularly for the lowest pressures corresponding to the collisionless regime (10 and 30 mTorr). It is possible that the stochastically heated high energy electrons dissipated most of their energy at the plasma-sheath boundary and therefore such characteristics are not observed in the discharge center were the measurements are taken. The EEPFs at 50 and 70 mTorr shown on figure 12 exhibit a bi-Maxwellian shape, although the low energy group is characterized by a higher temperature than the temperature of the high energy electron group. This is due to the increasing importance of inelastic collisions as the pressure increases.
An unusual structure in the EEPF was observed at 10 and 30 mTorr. These distributions had a doubled peak feature and the peaks appeared at energies in the region of 3 and 10 eV respectively for 10 mTorr. The dip appearing between the peaks was located at 7 eV and could be due to the loss of electrons through an inelastic collisional process such as vibration or rotational excitation of O2 molecules with a particularly large cross-section or a maximum in the cross-section at an energy which corresponds to the location of the dip. Structure or a so called 'dip' or 'hole' of this kind is not usually observed in EEPFs in O2 plasma. Although, it has often been reported in N2 plasma with a dip located in the energy range of 2–4 eV which correlates to the maximum in the cross-section for vibrational excitation of  [19, 20, 41]. The structure observed at 30 mTorr was similar except the peaks and dip appeared at lower energies. An unusual double peaked structure of the EEPF was reported in N2 ICP [42] using a Langmuir probe. Similarly, the energy location of these peaks were also displaced as the operating conditions varied (power/pressure) [42]. Structure was also observed on the Langmuir probe measured EEPFs in H2 CCP by Mahony et al [43].
Due to limitations of the Langmuir probe, measurements above 100 mTorr were not reliable. For pressures above 100 mTorr (30 W) analysis of the Langmuir probe IV trace suggests that the probe was not compensated well at these conditions providing misleading results such as the apparent marked enhancement of energetic electrons with increasing pressure greater than 100 mTorr.
Poor compensation was evident from a plot of the second derivative of the electron current with respect to the probe voltage ( versus Vb). For a well compensated probe a plot of
  versus Vb should be symmetric around the zero crossing point for example figure 10 of [44]. It was noticed that this limitation of the probe compensation was restricted to molecular gases. Poor compensation was mostly observed in O2 and N2 plasma and rarely observed in Ar or He plasma for a wide range of powers and for pressures up to 900 mTorr. In addition, it was found that the probe referencing was not sufficient for the same conditions where the compensation was compromised. An investigation into the referencing limitations of this probe was presented by Babu [45].
3.3.2. Pressure evolution of the EEPF, and Teff at 200 W

The investigation of the EEPF, ne and Teff as a function of gas pressure in the range of 10–200 mTorr is discussed in this section and can be seen in figures 14 and 15 respectively. These parameters are investigated for a fixed applied power of 200 W which corresponds to a power associated with the γ mode (for intermediate pressures). For the lower pressures examined, (10–50 mTorr) SE are mostly lost by the discharge (to the walls) without collisions with the background gas. Therefore, stochastic heating is dominant at these low pressures and SE do not influence the ionization balance significantly.

Figure 14. Pressure evolution of the EEPF in O2 plasma operated at 200 W.
Download figure:
Standard image High-resolution image
Figure 15. Pressure variation of ne (black circles) and Teff (red squares) in O2 plasma operated at 200 W. The error bars are too small to indicate.
Download figure:
Standard image High-resolution imageHowever, as the pressure is increased SE collide more frequently with the background gas and therefore play a more significant role in the discharge ionization balance. A similar transition was seen by Godyak et al where the right combination of pressure and discharge voltage occurred for an electron avalanche to develop and the discharge to enter the γ mode [1]. The most significant change in these plasma parameters occurs as the discharge evolves from the collisionless to collisional regime i.e. between 10 and 50 mTorr and when the plasma is collisional ≈100–200 mTorr. The high energy tail of the EEPF significantly decreased as the pressure increased from 10 to 30 mTorr, this resulted in a ≈ four-fold decrease in Teff. This reduction in the concentration of high energy (ionizing) electrons as a function of increasing gas pressure is consistent with the expected reduction in the ionization rate constant with increasing neutral gas density (for a fixed effective plasma size) as given by the particle balance equation. This  dependence was satisfied over a wider range of pressures (10–200 mTorr) when compared to 30 W (10–100 mTorr) reported in section 3.3.1. Again, the probe was limited to specific plasma conditions for good compensation and referencing. At 200 W the probe measurements became unreliable at pressures higher than 200 mTorr. Figure 16 shows the measured rf current and voltage as a function of pressure and for fixed input powers of 30 and 200 W. Both current and voltage gradually decreased as the pressure increased and a substantial difference between the magnitudes of the rf voltage and current was shown for each power setting.

Figure 16. RF current and voltage as a function of gas pressure in O2 plasma for both 30 and 200 W.
Download figure:
Standard image High-resolution image
4. Conclusion
This article reports various electron plasma parameters in an O2 CCP with use of electrical probes. Important electron plasma parameters such as the EEPF, ne, Teff and also discharge operating parameters such as rf current and voltage were reported. For the first time the evolution of the EEPF over the α–γ mode transition in pure O2 plasma was shown. The EEPF evolved from Druyvesteyn to bi-Maxwellian with increasing input power. Comparisons were made to Ar plasma however the EEPF evolved from Druyvesteyn to a more Maxwellian like distribution. The threshold power and rf voltage (rms) for the α–γ transition in O2 and Ar plasma was 50 W/188 V and 20 W/80 V respectively.
The corresponding ne and Teff in both O2 and Ar plasma was also reported. ne was higher across all powers in Ar plasma which is likely due to the presence of negative ions in O2 plasma. Teff decreased with increasing power in both O2 and Ar plasma due to the increasing importance of SE in sustaining the discharge. ne saturated at higher powers due to a possible change in the dependence of the transmitted power with applied input power. As the applied power increased the rf current and voltage showed a rapid increase (low powers) followed by gradual increase (for high powers).
The EEPF, ne, Teff, Irms and Vrms was reported for various pressures at two fixed input powers of 30 and 200 W depicting two electron heating mode transitions. The collisionless to collisional transition was observed at fixed power of 30 W while increasing the pressure between 10 and 100 mTorr and the collisionless to γ mode transition was shown by increasing the pressure at fixed power of 200 W. In O2 plasma operated at 30 W the tail of EEPF close to the ionization potential of O2 (≈12 eV) decreased significantly as the pressure increased from 10–100 mTorr which is expected from the particle balance equation. In O2 plasma at 200 W the inverse relationship between kion and ng was satisfied over a wider range of pressures 10–200 mTorr.
Acknowledgments
This material is based upon the work supported by the Science Foundation, Ireland, under grant No 08/SCR/I1411. We would like to thank Mr Conor Murphy for his skillful technical assistance and Dr Cezar Gaman for the use of his hairpin probe system.