

Abstract
Atmospheric pressure capacitively coupled radio frequency discharges operated in He/N2 mixtures and driven by tailored voltage waveforms are investigated experimentally using a COST microplasma reference jet and by means of kinetic simulations as a function of the reactive gas admixture and the number of consecutive harmonics used to drive the plasma. Pulse-type 'peaks'-waveforms, that consist of up to four consecutive harmonics of the fundamental frequency (f = 13.56 MHz), are used at a fixed peak-to-peak voltage of 400 V. Based on an excellent agreement between experimental and simulation results with respect to the DC self-bias and the spatio-temporal electron impact excitation dynamics, we demonstrate that Voltage Waveform Tailoring allows for the control of the dynamics of energetic electrons, the electron energy distribution function in distinct spatio-temporal regions of interest, and, thus, the generation of atomic nitrogen as well as helium metastables, which are highly relevant for a variety of technological and biomedical applications. By tuning the number of driving frequencies and the reactive gas admixture, the generation of these important species can be optimised. The behaviour of the DC self-bias, which is different compared to that in low pressure capacitive radio frequency plasmas, is understood based on an analytical model.
Export citation and abstract BibTeX RIS
1. Introduction
Radio frequency (RF) excited microscopic atmospheric pressure plasmas have been receiving increasing attention in both academic and applied research. The reactive species generated in such plasma sources are suited for various applications [1, 2]: sterilization [3], bacteria/virus/cancer cell deactivation [4–7], wound healing [8], exhaust gas cleaning [9], surface treatment/modification of different materials [10, 11], and semiconductor manufacturing [12]. Micro atmospheric pressure plasma jets (μ-APPJs) are one of the most common devices to generate such plasmas [13–16]. Their main advantage is their ability to provide a high density of different reactive species while the buffer gas temperature, for a wide range of conditions, remains close to the ambient temperature. As a feed gas helium or argon are typically used with or without some admixtures (≤1%) of molecular gases, e.g. oxygen, nitrogen, water vapour etc [13, 17–23]. A key research question is how to generate efficiently and selectively different reactive species of, e.g. oxygen and nitrogen (RONS) which are highly relevant for biomedical applications and for the removal of volatile organic compounds from different exhaust gas streams [24–28]. One of the primary processes responsible for the generation of such reactive radicals is electron impact excitation/dissociation of the neutral gas. Consequently, the optimization of the generation of such species can be based on tailoring the electron energy distribution function (EEDF). The formation of the EEDF significantly depends on the spatio-temporal electron power absorption dynamics in the active plasma volume. Understanding these processes can provide valuable insights to generate concepts for EEDF control. Due to the small dimensions of the jets (the gap between the electrodes is typically in the range of a millimeter) and the short timescales within the RF period, such distribution functions typically cannot be measured space and time resolved. This problem can be overcome by invoking simulations: the EEDF can then be extracted from these with high spatial and temporal resolution. It was previously shown, that even for such high pressures and short mean free paths, kinetic effects are not negligible in μ-APPJs [29, 30]. Therefore, in order to obtain EEDFs correctly from simulations, kinetic approaches such as the Particle in Cell method, complemented with Monte Carlo treatment of collision processes (PIC/MCC) [31–34], should be used.
Most RF μ-APPJs are driven by a single frequency voltage waveform at 13.56 MHz. Previously, such atmospheric pressure plasmas in He(Ar) with some molecular gas admixtures were found to be operated in two electron power absorption modes, i.e. (i) the Ω- or (ii) the Penning-mode [17, 35–39]. In the Ω-mode, maximum electron power absorption and ionization occur in the plasma bulk during sheath expansion and collapse. Due to the high collision frequency of electrons, the electrical conductivity in the bulk is significantly depleted. Thus, in order to ensure current continuity throughout the bulk a high electric field is required at the times of high current within the RF period. Such a bulk heating regime (Drift-Ambipolar-mode) was also observed in low pressure electronegative gases [40–44], but in contrast to high pressure discharges, the low conductivity in the bulk is caused by the depleted electron density due to electron attachment processes in electronegative gases. Similarly to the γ-mode of low pressure capacitively coupled plasmas (CCPs) [40, 45], in the Penning-mode, the ionization occurs inside the sheaths in μ-APPJs. At low pressures the ionization is caused by secondary electrons accelerated towards the plasma bulk by the electric field inside the sheath, which are multiplied collisionally inside the sheaths. These electrons are mainly created at the electrodes by ion impact. In the Penning-mode of μ-APPJs operated in, e.g. He/N2, the electrons are created predominantly by Penning ionization, i.e.  . Recently, in this mode, the ionization dynamics was found to consist of two channels: direct and indirect Penning ionization [46]. When Penning ionization takes place inside the sheath, the created electrons are accelerated towards the bulk by the sheath electric field and can cause ionization (direct channel). As the helium metastable density exhibits maxima at some distance from the electrodes [47], the multiplication of such electrons is limited and located close to the maximum sheath edge. The ions created via Penning ionization can also induce the emission of secondary electrons from the electrodes. Such secondary electrons can contribute significantly to the ionization inside the sheath (indirect channel). By varying the driving voltage amplitude and the molecular gas admixture concentration, a transition of the electron power absorption dynamics (from the Ω- to the Penning-mode) was observed in single frequency μ-APPJs [46].
In low pressure CCPs, Voltage Waveform Tailoring (VWT) has been demonstrated to provide the opportunity to customize the electron power absorption dynamics on a nanoseconds timescale. Under such discharge conditions, this technique can be used to optimize the control of flux-energy distribution functions of different particle species at the electrodes [48–53]. The method is based on using a finite Fourier series of N consecutive harmonics of a fundamental frequency, f, with individually adjustable relative phases and amplitudes as the driving voltage waveform. The amplitudes and phases of the harmonics can be adjusted in a way to form so-called 'peak'-, 'valley'-, and 'sawtooth'- waveforms [54]. 'Sawtooth'-waveforms were found to induce a fast sheath expansion at one electrode, while a slow sheath expansion happens at the opposite electrode. Via this Slope Asymmetry Effect a strong DC self-bias was found to be generated [55] by this waveform. Via the spatio-temporal ionization dynamics the sign and the value of the DC self-bias was found to depend on the used gas [48]. Using multiple consecutive harmonics in low pressure CCPs also allows to apply voltage waveforms with different global extrema, e.g. 'peaks'- and 'valleys'-waveforms. By controlling the difference between the absolute values of the global maximum and minimum by phase control, this Amplitude Asymmetry Effect allows to induce and control the generation of a DC self-bias as well. In this way, phase control was demonstrated to provide the freedom of setting the ion flux separately from the mean ion energy at boundary surfaces [56–58]. Despite the increasing usage and importance of low pressure CCPs, studies of VWT at atmospheric pressures are very limited. Gibson et al [59] have recently demonstrated that tailored voltage waveforms are able to break the symmetry of the spatio-temporal electron power absorption dynamics in μ-APPJs operated in He with 0.5% Ar admixture. This study was limited to a fixed number of harmonics, i.e. one and four consecutive harmonics of 13.56 MHz. Due to the different modes of operation of μ-APPJs compared to low pressure CCPs, the effects of a given tailored voltage waveform on the spatio-temporal electron power absorption dynamics were found to be markedly different. Based on experimental and computational results, 'sawtooth'-waveforms were found to induce a temporal asymmetry of the spatio-temporal electron dynamics, i.e. excitation/ionization occur only during one half of the fundamental RF period [59]. 'peaks'-waveforms were found to cause both spatial and temporal asymmetries of the electron dynamics, i.e. electron power absorption was found to be confined to small regions in space (at only one electrode) and time within the fundamental RF period [59]. Such a confinement of the electron power absorption in space and time allows to tailor the EEDF and provides the potential for controlling the electron-driven plasma chemistry. Studies of VWT in He/N2 mixtures are limited to simulations of a jet driven at two frequencies, i.e. 13.56 MHz and 40.68 MHz, which are odd, but not consecutive harmonics [60]. In that study, tuning the amplitudes and relative phases of both harmonics was demonstrated to provide some degree of control of the EEDF.
Here, in a μ-APPJ operated in helium with variable admixture of N2 and based on a synergistic combination of experiments, simulations, and modeling we show that VWT allows to customize the spatio-temporal electron impact excitation dynamics and the EEDF. We explain the physical mechanisms behind the electrical generation of a DC self-bias and demonstrate that VWT allows to optimize and control the generation of atomic nitrogen and helium metastables by tuning the number of consecutive driving harmonics, N, and the reactive gas admixture. These investigations are performed for 'peaks'-waveforms at a fixed peak-to-peak voltage of 400 V and as a function of N as well as of the admixture of N2 to helium. Our results show that VWT provides a unique potential for controlling and optimizing the generation of selected particle species that are relevant for distinct applications, that is far beyond classical single frequency μ-APPJs.
The paper is structured in the following way: the experimental set-up and the PIC/MCC simulation approach are described in section 2. Our results are presented in section 3, which is divided into 4 parts. First, the DC self-bias generation is studied for 'peaks'- and 'valleys'-waveforms as a function of the reactive gas admixture and the number of driving frequencies. Then, the control of the electron energy probability function (EEPF) in space and time as a consequence of controlling the electron power absorption dynamics by VWT is discussed as a function of the reactive gas admixture and the number of driving frequencies, respectively. Consequences of the EEPF control on the helium metastable density profile are outlined. In the last part of section 3, a concept to control the generation of atomic nitrogen and helium metastables by tuning the number of driving frequencies and the reactive gas admixture is introduced. Finally, conclusions are drawn in section 4.
2. Experimental set-up and PIC/MCC simulation
2.1. Experimental set-up
The experimental set-up including all diagnostics is shown schematically in figure 1. Experiments are performed using a COST reference microplasma jet [13] operated in He with different N2 admixture concentrations. The jet consists of two identical stainless steel electrodes covered by two quartz plates confining the plasma channel volume to 1 mm × 1 mm × 30 mm. More detailed information about the plasma source can be found elsewhere [13].
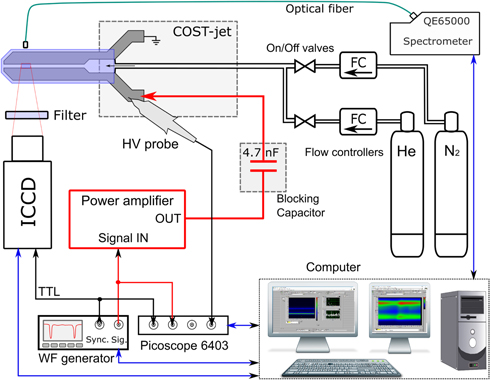
Figure 1. Schematic of the experimental set-up for PROES and voltage measurements.
Download figure:
Standard image High-resolution imageWe use (99.999%) purity helium and nitrogen gases with flow rates of 1 slm and 1–10 sccm, respectively. To avoid any strong pressure gradient along the cost jet, the absolute pressure before the helium flow controller is kept close to 1.1 Bar. The desired waveform is generated by an arbitrary waveform generator (Keysight 33600A). The signal is then applied to the powered electrode of the jet via a broadband power amplifier (AR RF/Microwave Instrumentation 500A250A, 0.01–250 MHz, 500 W). No impedance matching is used here, although advanced matching networks for tailored voltage waveforms exist [61–63]. A high voltage probe (Tektronix P6015A with a bandwidth of 75 MHz) is used to measure the applied voltage waveform at the electrode. The probe is directly connected to a USB oscilloscope (Picoscope 6402c, 250 MHz, 5 Gs s−1). The signal from the oscilloscope is analyzed using a LabVIEW software. In this way a feedback loop is realized which corrects for waveform distortions in an iterative way to ensure the desired waveform at the electrode. The RF power is set so that the peak-to-peak value of the driving voltage waveform at the electrodes, ϕpp, is 400 V. This value allows to generate a stable discharge for the range of reactive gas admixtures and for the different numbers of consecutive driving harmonics, N, used in this work. In this way only one external control parameter, i.e. either N or the N2 admixture concentration, is changed at a time. A 'peaks' voltage waveform is generated according to the following equation for the driving voltage waveform by setting all harmonics' phase angles, θk, to 0°:

where ϕk are the amplitudes of the individual harmonics of the fundamental frequency, f = 13.56 MHz. The voltage amplitudes of the harmonics are set according to:  , where
  [64]. The 'valleys'-type voltage waveforms are obtained by changing the phase angles of all even harmonics from zero to π. In figure 2, 'peaks'- and 'valleys'-waveforms are shown for different numbers of consecutive harmonics, N.
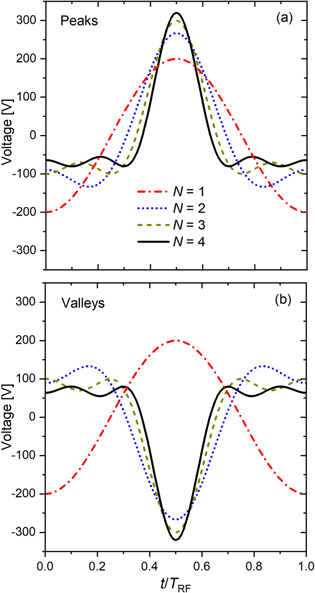
Figure 2. Tailored voltage waveforms generated for different numbers of consecutive harmonics, N. The upper panel represents 'peaks'-waveforms and the bottom panel represents 'valleys'-waveforms. The peak-to-peak voltage is kept constant at 400 V. The time axis covers one RF period, TRF, of the fundamental frequency f = 13.56 MHz and is shifted by half of the period for better visibility.
Download figure:
Standard image High-resolution imageDuring the measurements the impurity level and the stability of the system are monitored by time integrated Optical Emission Spectroscopy using a USB grating spectrometer (Ocean Optics QE65000, spectral range: 200–980 nm, spectral resolution: 0.8 nm). The plasma emission intensity is uniform along the jet except the last 3–5 mm in front of the end of the nozzle due to back diffusion of ambient air. Phase Resolved Optical Emission Spectroscopy (PROES) measurements are performed by using an ICCD camera (4 Picos from Stanford Computer Optics) with a Canon MP-E 65 f/2.8 macro lens. The camera is synchronized with the driving voltage waveform. To monitor the He line at 706.5 nm, the lens is equipped with an interference filter from Thorlabs (700 nm, FWHM of 15 nm). The time and space resolved electron-impact excitation rate from the ground state into He I (3S1) is calculated using an effective lifetime of 6 ns based on estimations from [65]. The influence of collisional de-excitation by N2 is neglected due to the small amount of N2 present in the discharge. The contribution of other lines/bands, that emit at wavelengths within the filter's transmission range is negligibly small. For all conditions studied, a gate width and time step of 1 ns are chosen for the PROES measurements. The resolution of the recorded images corresponds to 210 pixels within the electrode gap (1 mm) and 782 pixels (3.7 mm) in the direction of the gas flow. The central position of the image is located approximately in the middle of the active discharge region. All images are binned in horizontal direction to obtain spatio-temporal plots with a spatial resolution of approximately 25 μm in the direction perpendicular to the electrodes.
2.2. PIC/MCC simulation
The plasma is simulated based on our electrostatic Particle-in-Cell code including a Monte Carlo treatment of collision processes (PIC/MCC) [32, 66, 67], which is the same as used in our previous studies of atmospheric-pressure plasma jets [46, 59] and similar in most respects to that used for previous studies of atmospheric-pressure pulsed discharges [68]. As full details of the discharge model and its computational implementation have already been given in the references quoted above, only a brief summary of the main features of the approach and specific parameter values for the simulations will be provided here.
The code considers one spatial dimension and three dimensions in velocity space. It traces electrons and three ionic species: He+, He2+, and  . The number of elementary processes is limited in our discharge model, but we expect that this limited set of processes (discussed below) is sufficient for a correct description of the electron kinetics and the main inelastic loss channels. On the other hand this model clearly cannot provide a full description of the detailed plasma chemistry. This is not the goal of this work.
For e−-He atom collisions we use the cross sections from [69], while for e−-N2 collisions the cross section set is taken from [70]. (We note that this latter set is largely based on the Siglo cross section set, which is accessible via the LxCat website [71]).
The total electron impact dissociation rate of N2 is computed based on the cross sections taken from [72]. The excitation rate from the He I ground state into the He I (3s)3S1 state is calculated by using the cross section adopted from [73].
All e−-atom/molecule collisions are assumed to result in isotropic scattering. In e−-He collisions 50% of the excitation is assumed to result in the formation of singlet (21S) or triplet (23S) metastable states either by direct excitation to these levels or by cascade transitions from higher-lying states [68]. The formation of these states is part of a very important ionization pathway, proceeding via the Penning ionization process.
For the different ionic species we only consider elastic collisions with the major constituent of the background gas, i.e. He atoms, collisions with N2 molecules are disregarded due to the minor concentration of this constituent in the buffer gas. For He+ ions the elastic collisions include an isotropic channel and a backward scattering channel [74]. For He2+ ions, which are created via the  ion conversion process, the Langevin cross section for the He2+ + He collisions is considered, and for
  ions, which are created either by direct electron impact ionization or via the
  Penning reaction, the Langevin cross section of
  + He collisions is adopted as well. The contribution of chemionization processes (e.g. He* + He*
  He+ + He + e−) to the production of electrons and ions is neglected, since the Penning ionization process is dominant.
The treatment of the ion conversion and Penning processes (described above) in the simulation proceeds as follows. The rates of these reactions (which are adopted from [75, 76]) are used to assign a random lifetime—according to the Monte Carlo approach—to each of the metastable atoms and He+ ions upon their 'birth'. These particles are then placed on a wait lists and the given conversion reaction is executed at a later time according to the (random) lifetime of the given particle (for more details see [68]).
The simulation code uses different time steps for the various species, optimized according to their collision frequencies. The smallest time step is required for the tracing of the electrons, due to their extremely high collisionality. We allow a collision probability  (here ν is the collision frequency). This results in a time step of Δte = 4.5 × 10⁻¹⁴ s for the electrons. The corresponding constraints for the ions allow significantly longer time steps:
  and
and  . These time steps, as well as the spatial numerical grid (that consists of 200 planes) satisfy the stability criteria of the PIC/MCC scheme. The superparticle number of each charged particle species traced in the simulation is monitored as a function of time. Convergence is considered to be achieved, when the drift of any of these numbers is less than the statistical fluctuation of these quantities.
The buffer gas temperature is kept constant throughout the numerical studies, at Tg = 300 K. The electron reflection probability at the electrodes is set to α = 0.6, which we consider to be a good approximation under the specific operating conditions of the experimental system where the mean energy of the electrons reaching the electrodes is a few eV [35, 46, 77]. The ion-induced secondary electrons emission coefficients are set as  = 0.3,
  = 0.2, and
  = 0.1. For He+ and
  ions these values are estimations based on [78–80], for He2+ we apply the findings of [81] that their yield is ≈60% of the yield of He+ ions. We have neglected the metastable induced secondary electron emission process, since the flux of the metastables towards the electrodes at this pressure, due to the very slow diffusion [82], is negligibly small in contrast to the flux of the positive ions. In our previous work [46], it was already shown that by using these surface coefficients the experimental results can be reproduced accurately.
3. Results
3.1. DC self-bias generation
First, we investigate the generation of a DC self bias, η, in the COST-jet for excitation by 'peaks'- and 'valleys'-waveforms as a function of the N2 admixture to helium and as a function of the number of consecutive harmonics used to drive the discharge. The DC self-bias is an important parameter, since it drastically affects the sheath voltages, which, in turn, can affect the electron power absorption dynamics. Note that the COST jet is geometrically symmetric, i.e. the surface areas of both electrodes are identical, so that no DC self-bias is generated when using a single driving frequency. Our analysis is performed based on measurements and results of PIC/MCC simulations as well as results of an analytical equivalent circuit model of CCPs [56, 64].
Figure 3 shows the DC self-bias, η, obtained experimentally (dashed lines) and obtained from the simulations (solid lines) for different N2 admixtures and numbers of harmonics, N, for 'peaks'- and 'valleys'-waveforms The peak-to-peak voltage is kept constant at Vpp = 400 V and f = 13.56 MHz for all N and N2 admixtures. The agreement between experimental and simulation results is excellent under all conditions. An almost linear decrease of the absolute value of the DC self-bias as a function of the N2 admixture is observed for all N. The strongest DC self-bias,  (7.5% of Vpp), is generated for the lowest nitrogen flow of 1 sccm and the highest number of harmonics, N = 4. By switching the driving voltage waveform from 'peaks' to 'valleys' the DC self-bias changes its sign, but its absolute value remains the same. Thus, we limit our following discussion of the physical origin of the DC self-bias generation to 'peaks'-waveforms only.
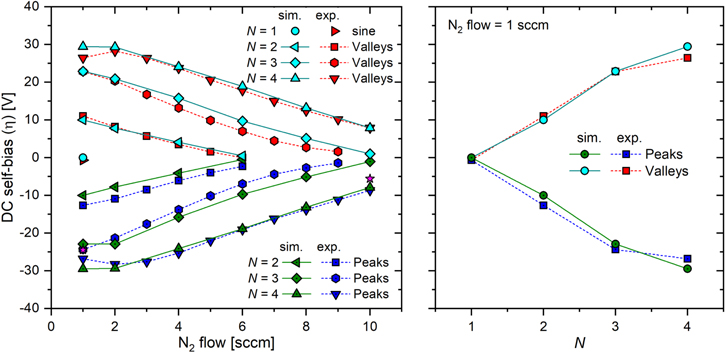
Figure 3. DC self-bias as a function of the nitrogen flow at constant He-flow of 1 slm (left panel) and as a function of the number of applied consecutive harmonics for a N2-flow of 1 sccm at a He-flow of 1 slm (right panel) resulting from the experiment and the PIC/MCC simulations. The base frequency and the peak-to-peak voltage of the driving voltage waveform are kept constant at 13.56 MHz and 400 V, respectively. The magenta stars in the left plot represent exemplary values of the DC self-bias values obtained from the analytical model, i.e. based on equation (2) for N = 4 at N2-flows of 1 sccm and 10 sccm, respectively.
Download figure:
Standard image High-resolution imageIf the N2 admixture is kept constant and the number of harmonics is increased,  will increase. This is caused by an increase of the amplitude asymmetry of the driving voltage waveform induced by increasing N. This effect is in principle known from low pressure CCPs, where, however, such waveforms can induce a much stronger DC self-bias of more than 30% of the peak-to-peak driving voltage [48, 64, 83]. At low pressures this is caused by the self-amplification of this Electrical Asymmetry Effect (EAE): the presence of a DC self-bias causes a higher mean sheath voltage at one compared to the other electrode, which leads to different mean ion energies at both electrodes. At low pressure the sheaths are collisionless and a higher ion velocity in one sheath leads to a lower mean ion density in this sheath compared to the other sheath due to ion flux continuity. This, in turn, affects the symmetry of the discharge and makes it even more asymmetric [83]. As shown in figure 3, at high pressure this effect is much less pronounced. In fact, there is a self-attenuation of the EAE at atmospheric pressure, which is caused by the spatial asymmetry of the electron power absorption dynamics, which will be discussed later (see figures 4–6).
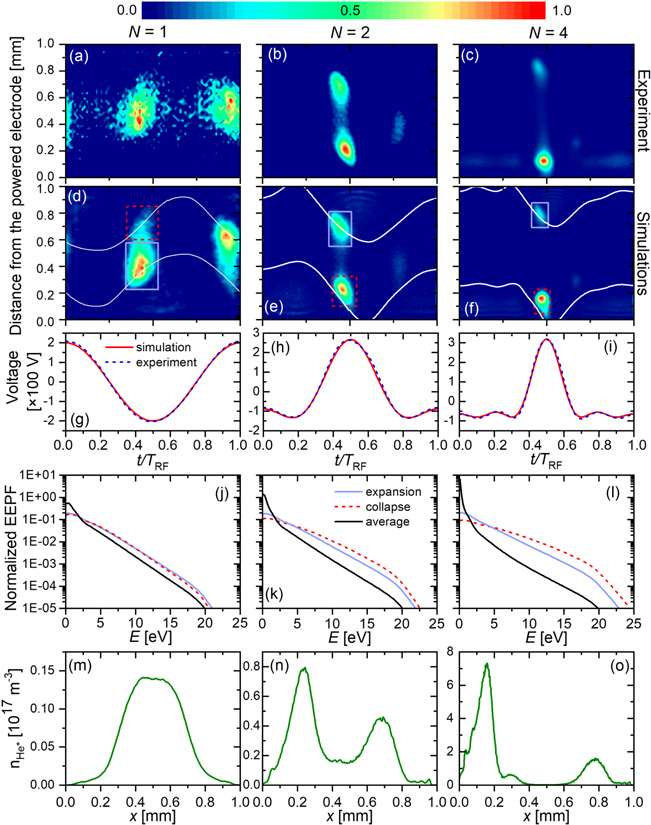
Figure 4. Normalized spatio-temporal plots of the electron impact excitation rate from the ground state into He I3S1 obtained experimentally (first row) and from PIC/MCC simulations, for different numbers of consecutive harmonics ('peaks'-waveform). The positions of the sheath edges are shown as a solid white line (second row). The data are plotted for different driving voltage waveforms shown in row 3. The fourth row shows EEPFs averaged over different spatio-temporal regions of interest marked in row 2. The black solid line corresponds to the EEPF averaged over the entire electrode gap and RF period of the fundamental driving frequency. The fifth row shows the time averaged helium metastable density profile extracted from the PIC/MCC simulation. The powered electrode is located at x = 0, while the grounded electrode is at x = 1 mm. The base frequency is f = 13.56 MHz, the flow ratio is He/N2 = 1000/1 (1 sccm N2 flow).
Download figure:
Standard image High-resolution image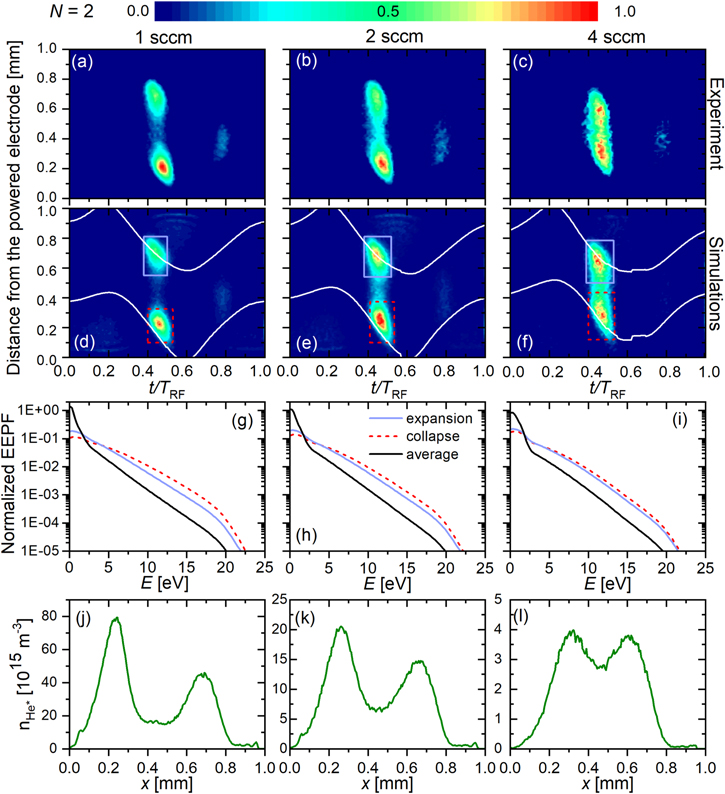
Figure 5. Normalized spatio-temporal plots of the electron impact excitation rate from the ground state into He I 3S1 obtained experimentally (first row) and from PIC/MCC simulations, for different N2 reactive gas admixtures. The sheath widths are shown as a solid white line (second row). The data are plotted for 'peaks'-waveforms with N = 2 and Vpp = 400 V. The third row shows EEPFs averaged over different spatio-temporal regions of interest marked in row 2. The black solid line corresponds to the EEPF averaged over the entire electrode gap and RF period of the fundamental driving frequency. The fourth row shows the time averaged helium metastable density profiles extracted from the PIC/MCC simulation. The powered electrode is located at x = 0, while the grounded electrode is at x = 1 mm. The base frequency is f = 13.56 MHz.
Download figure:
Standard image High-resolution image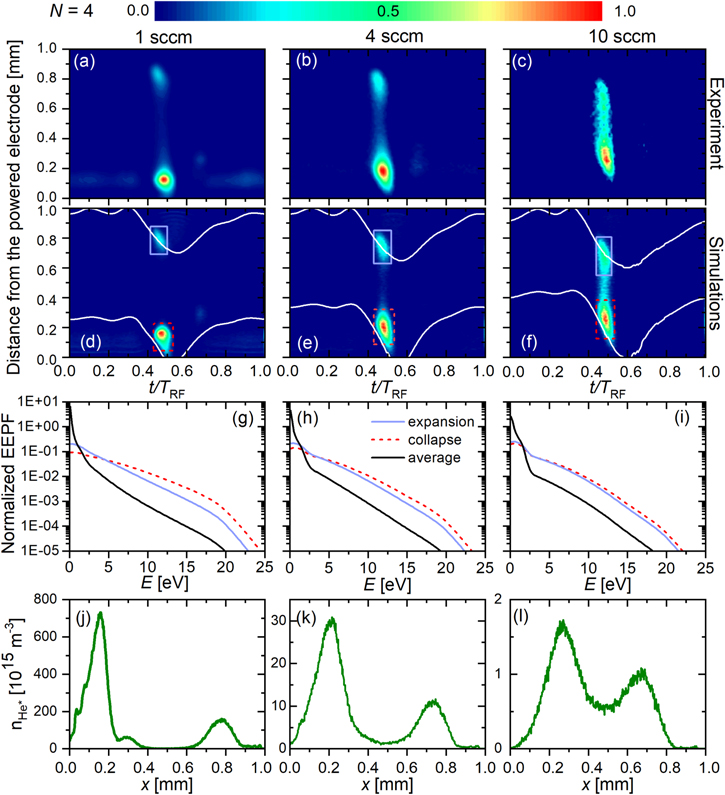
Figure 6. Normalized spatio-temporal plots of the electron impact excitation rate from the ground state into He I 3S1 obtained experimentally (first row) and from PIC/MCC simulations, for different N2 reactive gas admixtures. The positions of the sheath edges are shown as a solid white line (second row). The data are plotted for 'peaks'-waveforms with N = 4 and Vpp = 400 V. The third row shows EEPFs averaged over different spatio-temporal regions of interest marked in row 2. The black solid line corresponds to the EEPF averaged over the entire electrode gap and RF period of the fundamental driving frequency. The fourth row shows the time averaged helium metastable density profiles extracted from the PIC/MCC simulation. The powered electrode is located at x = 0, while the grounded electrode is at x = 1 mm. The base frequency is f = 13.56 MHz.
Download figure:
Standard image High-resolution imageThese effects can be understood in detail based on an analytical equivalent circuit model of CCPs [56, 64], which yields the following equation for the DC self-bias:
where ϕmax and ϕmin are the maximum and the minimum of the applied voltage waveform ϕ(t), respectively.  and
and  are the floating potentials at the powered and grounded electrode, respectively, and
  and
and  are the voltage drops across the plasma bulk at the time of maximum and minimum applied voltage, respectively. All quantities on the RHS of this equation can be obtained from the PIC/MCC simulations as input parameters for the model. For a geometrically symmetric CCP, the symmetry parameter, ε, is:

Here,  and
and  are the maximum sheath voltage drops across and the mean ion density in the respective sheath. A symmetry parameter of ε = 1 refers to a symmetric discharge, whereas
  refers to an asymmetric CCP. The higher the deviation of this parameter from unity the more pronounced the discharge asymmetry is. In low pressure electropositive plasmas, the first term of equation (2) is dominant, the second and third terms can usually be neglected [84, 85]. In electronegative low pressure plasmas, the third term is also significant [40, 50, 86].
For the atmospheric pressure conditions studied here, table 1 provides the symmetry parameter and all three terms of equation (2) for two different flows of N2 for a 'peaks'-waveform with four consecutive harmonics of 13.56 MHz at a peak-to-peak voltage of 400 V. In contrast to most low pressure CCPs, we find that all three terms of equation (2) play an important role for the DC self-bias formation.
Table 1. Symmetry parameter and terms (1) –(3) of equation (2) for a 'peaks'-waveform generated based on four consecutive harmonics of 13.56 MHz at a peak-to-peak voltage of 400 V for two different admixtures of N2. These data are obtained from PIC/MCC simulations. The DC self-bias obtained from the model and the simulation is also shown.
| Flow | ε | Term 1 | Term 2 | Term 3 | ηcalc | ηPIC |
|---|---|---|---|---|---|---|
| 1 sccm | 1.74 | −66.0 V | 3.5 V | 38.0 V | −24.5 V | −29.6 V |
| 10 sccm | 1.82 | −61.0 V | 15.4 V | 41.0 V | −5.6 V | −7.7 V |
The symmetry parameter, ε, deviates significantly from unity and is comparable at low and high reactive gas admixtures. Its deviation from unity is explained by the spatial asymmetry of the spatio-temporal dynamics of energetic electrons induced by the 'peaks' driving voltage waveform, which will be discussed in detail in the next section. As can be clearly observed in figures 4(c) and (f) for the 'peaks'-waveform at N = 4 the ionization/excitation mainly occurs at the powered electrode. At atmospheric pressure, the decrease of the ion density from the bulk towards the electrode due to ion flux continuity is much less pronounced due to the presence of collisional sheaths. Instead, the spatial asymmetry of the ionization dynamics leads to  and ε > 1, which corresponds to a self-attenuation of the EAE and is the exact opposite compared to the self-amplification observed under low pressure conditions. By decreasing N, the discharge becomes more symmetric in space (see figures 4(b) and (e)) and the symmetry parameter approaches unity, e.g. ε = 1.25 for N = 2 at 1 sccm N2 flow. The effect of adding more harmonics to the driving voltage waveform on the DC self-bias is shown in the right plot of figure 3 and can be explained by the increasing difference of the absolute values of the extrema of the applied waveform in combination with the increase of ε as a function of N, which induces a stronger spatial asymmetry of the discharge.
According to table 1, the first term of equation (2) remains almost constant for different N2 admixtures, since the voltage waveform is fixed and the symmetry parameter, ε, changes only slightly. However, the value obtained from the first term is two times higher than the DC self-bias measured for 1 sccm N2 flow, i.e. the second and the third terms matter as well. At atmospheric pressure, due to the high collisionality of electrons and in order to drive the current through the bulk, a high electric field is generated in the bulk at the times of maximum current within the fundamental RF period [46]. This causes high voltage drops across the bulk at the times of maximum and minimum applied voltage. As the currents are strongly different at these two times, the absolute values of the bulk voltage at these times within the fundamental RF period are also different, i.e.  (see table 2). Their absolute values increase as a function of the N2 flow due to the enhanced collisionality induced by the presence of a higher molecular gas admixture. In combination with the specific value of the symmetry parameter, this leads to a high value of term 3 of equation (2) and to a depletion of the DC self-bias. By increasing [N2] the second term of equation (2) becomes more important. We find that the value of the floating potential at the powered electrode is quite high and positive (+44 V at 10 sccm of N2 admixture, see table 2), while at the grounded electrode it is very close to zero. The high and positive floating potential is a consequence of the short sheath collapse at the powered electrode in combination with the collisional discharge conditions. For these reasons the electron transport to the powered electrode is limited. In order to compensate the positive ion flux to this electrode on time average, a local electric field reversal is generated at the powered electrode, which accelerates electrons towards this boundary surface [87, 88]. Thus, the voltage drop across the sheath at the powered electrode during the local sheath voltage, i.e.
  , is positive. This electric field reversal and, thus,
  increase as a function of the molecular gas admixture due to the enhanced collisionality and the reduced electron mobility. This effect is the main reason why the absolute value of the DC self-bias decreases as a function of the N2 admixture concentration (see figure 3).
Table 2. Extrema of the driving voltage waveform, bulk voltages and floating potentials at the times of maximum and minimum applied voltage as used in equation (2) to calculate the DC self-bias from the analytical model for a 'peaks'-waveform generated by four consecutive harmonics of 13.56 MHz at a peak-to-peak voltage of 400 V, for two different admixtures of N2.
| Flow | ϕmax | ϕmin |

|

|

|

|
|---|---|---|---|---|---|---|
| 1 sccm | 320 V | −80 V | 10 V | 0 V | 115 V | −6 V |
| 10 sccm | 320 V | −80 V | 44 V | 0 V | 129 V | −7 V |
The values of the DC self-bias obtained from the analytical model by using equation (2) in combination with the input parameters provided in table 2 for N = 4 and for two different N2 admixtures are presented as magenta stars in the left plot of figure 3. These results are in very good agreement with both the PIC/MCC simulation and the experimental data. Thus, we can conclude that the physical mechanisms outlined above are responsible for the formation of the DC self-bias in μ-APPJs operated in He/N2 with 'peaks'-/'valleys'-waveforms as well as for its dependence on the number of consecutive driving harmonics, N, and on the reactive gas admixture.
3.2. EEPF control by VWT as a function of the number of driving frequencies
In this section, we demonstrate that VWT allows to control the spatio-temporal dynamics of energetic electrons and the EEPF in distinct spatio-temporal regions of interest by changing the number of consecutive driving harmonics at a fixed peak-to-peak voltage and at otherwise constant discharge conditions. As a direct consequence of this, the spatial distribution and the number of helium metastables can be controlled and optimized by VWT. In the following, we focus on the electron dynamics induced by 'peaks' waveforms with N = 1, N = 2, N = 4 at a nitrogen flow of 1 sccm.
Figure 4 shows the measured [(a)–(c)] and computed [(d)–(f)] space and time resolved electron-impact excitation rate from the ground state into He I 3S1 for the 'peaks'-voltage waveforms shown in plots [(g)–(i)]. The white solid lines in panels (d)–(f) indicate the sheath edge position as a function of time calculated using the Brinkmann criterion [89]. The measured electron impact excitation rates are in excellent agreement with the computed rates.
In the single frequency case (N = 1), a spatially and temporally symmetric excitation pattern is observed. The excitation rate exhibits two maxima during the sheath expansion at the powered and the grounded electrodes (blue solid rectangles). Much weaker excitation is observed during the sheath collapses (red dashed rectangles). Under these conditions, the discharge is operated in the Ω-mode [46]. The electron power absorption inside the bulk at distinct times within the RF period is caused by a strong bulk electric field generated to ensure current continuity in the presence of frequent electron-neutral collisions and, hence, a low conductivity in the bulk [40]. The field is stronger at the sheath edges due to lower electron densities in these regions and, thus, the excitation rates are more pronounced on the bulk side of the sheath edges. This single frequency scenario is the standard way to operate μ-APPJs that provides only limited control of the electron power absorption dynamics and, thus, of the EEPF in space and time via changing the driving voltage amplitudes and/or the gas mixture. Figure 4(j) shows the normalized EEPF obtained from the simulation and averaged over different spatio-temporal regions of interest indicated in figure 4(d). These regions are defined around the excitation maxima during sheath expansion (blue solid line) and the sheath collapse (red dashed line). We also determine the EEPF averaged over the entire electrode gap and one complete RF period (black solid line). For single frequency operation, the EEPFs during the sheath collapse and expansion phase show similar behaviour, but differ from the averaged EEPF. This can be explained by the fact that the enhanced high energy tail of the EEPF during sheath expansion and collapse results from the strong electron power absorption within these regions of interest. We also computed the time averaged spatial profile of the helium metastable density (for N = 1, see figure 4(m)).The density is weakly modulated in time, as the main destruction mechanism of the metastables inside the jet is Penning ionization with N2 and the reaction time of this process is comparable to or longer than one rf period for the conditions studied here. Previously it was shown [46] that the metastable density profile is highly correlated with the behaviour of the high energy tail of the EEPF and the spatio-temporal excitation dynamics, since these metastable levels can only be populated by highly energetic electrons. Here, for the single frequency case, we observe a broad, but single peak of the metastable density in the discharge center and do not find any double peak structure [47], because under these conditions maximum excitation occurs close to the discharge center. Thus, only one maximum of the helium metastable density is observed. Overall, the metastable density is low and there are only limited concepts for EEPF control in single frequency μ-APPJs.
By increasing the number of harmonics to N > 1, i.e. by using VWT, the spatio-temporal electron impact excitation dynamics can be tailored. When 'peaks'-waveforms are used to drive the discharge, these dynamics exhibits a strong spatial and temporal asymmetry. The asymmetry increases with increasing N. The electron power absorption is confined to a small region in both space and time at the powered electrode during the local sheath collapse. This is caused by the extremely fast local sheath collapse induced by the shape of the driving voltage waveform. While positive ions continuously flow to this electrode, electrons can reach this boundary surface only during the short local sheath collapse. Thus, a high electron current must flow during this short time interval in order to compensate the ion flux to this electrode on time average. Due to the high electron-neutral collision frequency at atmospheric pressure, the electrical conductivity is low and a high electric field is required to drive this high current. This field is maximum close to the electrode due to the decrease of the electron density and the corresponding decrease of the conductivity from the bulk towards the electrode. Electrons are accelerated to high energies by this electric field in vicinity to the powered electrode during the local sheath collapse. This is the underlying physical mechanism that causes the strong excitation maximum observed in figures 4(e) and (f) (dashed red rectangles) and the break of the symmetry of the spatio-temporal electron dynamics. This is a direct consequence of the specific 'peaks'-voltage waveform. The scenario can be mirrored in space by using a 'valleys'-waveform, for which the excitation maximum occurs at the grounded electrode during sheath collapse. Increasing the number of consecutive driving harmonics makes the sheath collapse even shorter and faster, so that the electron transport to the electrode is even more limited and an even stronger electric field is required to accelerate electrons to even higher energies and such a waveform will induce an even stronger discharge asymmetry.
The asymmetry of the spatio-temporal dynamics of energetic electrons induced by VWT has strong consequences on the EEPF formation within the regions of interest indicated in figures 4(d)–(f) and provides a method for EEPF control via VWT. For a 'peaks'-voltage waveform the high energy tail of the EEPF is strongly enhanced during the sheath collapse at the powered electrode due to the strong electron acceleration by the high local electric field. Compared to the single frequency scenario, the number of electrons at energies around 20 eV in the corresponding spatio-temporal region of interest is increased by approximately two orders of magnitude by using four consecutive driving harmonics under otherwise identical discharge conditions. This leads to a drastic increase of the helium metastable density at the powered electrode by a factor of approximately 50 compared to the single frequency case (see figures 4(m)–(o)). Similar to the electron dynamics the spatial symmetry of the helium metastable density profile is broken by using 'peaks'-waveforms, i.e. the metastable density at the powered electrode is much higher compared to that at the grounded electrode. Such control of the helium metastable density and its spatial distribution is expected to be highly relevant for various applications, since helium metastables act as an energy reservoir that can induce various processes of interest.
3.3. EEPF control by VWT as a function of the reactive gas admixture
Figures 5 and 6 show spatio-temporal plots of the electron impact excitation rate from the He I ground state into the He (3S1) state for different flow rates of N2 for 'peaks'-driving voltage waveforms with N = 2 and N = 4 harmonics, respectively, at a peak-to-peak voltage of 400 V. The first rows in both figures include the experimental results, while the second rows show computational data. Again, the agreement between the experimental and the simulation results is excellent under all conditions studied here. This shows that our simulation accurately describes the COST-jet under such discharge conditions. Similar to figure 4, these figures also depict the computed EEPFs (third row) for selected spatio-temporal regions of interest during sheath expansion and collapse indicated in the second rows as well as the EEPF on space and time average. The time averaged helium metastable density profiles are shown in the fourth rows. By increasing the reactive N2 gas flow the spatio-temporal excitation patterns and, hence, the helium metastable density profile become more symmetric in space. Correspondingly, the shape of the EEPF during the sheath collapse phase at the powered electrode becomes more similar to the EEPF during the sheath expansion at the grounded electrode with an increasing amount of the N2 admixture. This is caused by the following mechanism: adding more N2 enhances the collisionality of electrons, particularly at low electron energies, due to inelastic electron-molecule collisions. This reduces the generation of helium metastables and direct electron impact ionization of N2 with an increasing amount of the molecular gas admixture. Additionally, the quenching of existing helium metastables by Penning ionization increases as a function of the N2 admixture concentration. These mechanisms cause the helium metastable density (see rows 4 of figures 5 and 6) as well as the peak electron density to decrease with an increasing amount of the nitrogen admixture. For N = 4, the peak electron density obtained from the simulation is found to decrease from 3.4 × 10¹⁷ m−3 at an N2 flow of 1 sccm to 6.1 × 10¹⁶ m−3 at an N2 flow of 10 sccm. The average electron density is also decreased approximately by the same factor from 1.8 × 10¹⁷ m−3 at an N2 flow of 1 sccm to 2.8 × 10¹⁶ m−3 at an N2 flow of 10 sccm. Consequently, the electrical conductivity in the plasma bulk decreases, too, and the electric field required to drive a given current through the bulk increases as a function of the nitrogen admixture (1.5 times between 1 and 10 sccm of N2-flow at N = 4). In combination with the decrease of the plasma density and the conductivity from the discharge center towards the electrodes, this leads to a more symmetric spatio-temporal electron dynamics, since the electric field is now also high enough to cause excitation/ionization on the bulk side of the expanding sheath edge at the grounded electrode. This also explains, why the EEPFs during sheath expansion at the grounded electrode and during sheath collapse at the powered electrode are more similar to each other at high compared to low reactive gas admixtures and why the helium metastable density profiles become more symmetric. Due to the depleted plasma density, the maximum sheath width increases with the N2-flow causing the bulk plasma and the excitation maxima to be more localized towards the center of the electrode gap. This explains why the two maxima of the helium metastable density profile move closer to the discharge center at high nitrogen admixtures. In case of 4 consecutive driving harmonics the plasma density is higher compared to the scenario, where only 2 harmonics are used under otherwise identical discharge conditions. Via the mechanisms described above the discharge is, therefore, more asymmetric for N = 4 compared to N = 2 for a given admixture of nitrogen (see figures 5 and 6).
3.4. Control of the atomic nitrogen and helium metastable generation
In the previous sections, we analyzed the spatio-temporal electron power absorption dynamics as a function of the number of driving frequencies, N, and the N2 admixture to helium. Based on this analysis we showed that the EEPF within distinct spatio-temporal regions of interest can be controlled by VWT. Here, we show that this EEPF control allows to control the electron-driven chemistry of μ-APPJs. We choose two direct electron-impact induced processes, which are efficient at different electron energies, i.e. the generation of helium metastables and nitrogen atoms via electron impact dissociation of N2. For the latter process only the sources of atomic nitrogen are provided by the simulation, since the corresponding loss channels are not included self-consistently due to excessive computational efforts. However, we expect the atomic nitrogen density to be proportional to the square root of these sources based on previous findings of Wagenaars et al [90], who found the dominant loss channel of atomic nitrogen inside the jet to be  . This could be studied by a rate balance model, which is not the topic of this work. Atomic nitrogen is highly reactive and important for many applications, e.g. in biomedicine, via various chemical reactions such as nitric oxide or nitrogen dioxide generation [24]. It should be noted that, in this paper, we focus on the electron driven chemistry, but there could be other processes, which can contribute to the atomic nitrogen production, e.g. the dissociative recombination of
  ions with electrons [91]. Taking into account the
  ion density, the contribution of such processes is estimated to be one order of magnitude less compared to the electron impact dissociation process.
Figure 7 shows the profile of the time averaged total electron impact dissociation rate of nitrogen molecules for neutral products obtained from the simulations for different values of N and for different molecular nitrogen admixtures to helium, for 'peaks'-voltage waveforms. The cross section of this process is taken from [72]. Previously, the atomic nitrogen density was shown to increase almost linearly as a function of the applied voltage amplitude in single frequency μ-APPJs [92]. In such discharges, the helium metastable density is also proportional to the applied voltage amplitude [46, 93]. The increase of the atomic nitrogen and helium metastable densities by increasing the driving voltage amplitude is, however, limited to amplitudes below the threshold at which the discharge enters a constricted mode.
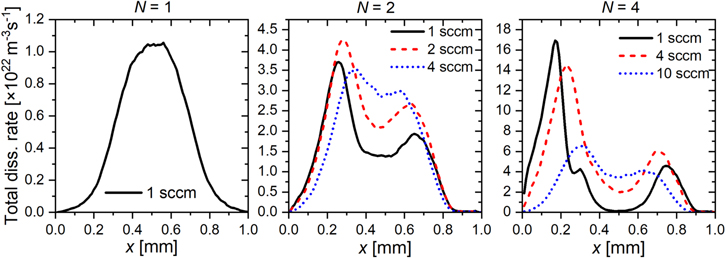
Figure 7. Time averaged total electron impact dissociation rate of N2 molecules obtained from PIC/MCC simulations using a cross section adopted from [72] for different numbers of driving harmonics, N, and nitrogen admixtures, for 'peaks'-voltage waveform with a peak-to-peak voltage of 400V. The powered electrode is located at x = 0, while the grounded electrode is at x = 1 mm. The base frequency is f = 13.56 MHz.
Download figure:
Standard image High-resolution imageIn the following, we demonstrate that VWT allows to realize very high helium metastable densities and strong atomic nitrogen generation. In combination with adjusting the reactive gas flow, it also allows to control both processes separately. Instead of using the driving voltage amplitude/power, we propose to tailor the shape of the driving voltage waveform. This can be realized e.g. by increasing the number of consecutive driving harmonics, N. As shown in figure 7, the maximum value of the time averaged dissociation rate of N2 can be significantly increased from 1 × 10²² m−3 s−1 to 17 × 1022 m−3 s−1 for an N2 flow of 1 sccm by increasing the number of driving harmonics from N = 1 to 4 at a fixed peak-to-peak voltage of 400 V. At the same time the maximum helium metastable density shows a similar behaviour, i.e. a strong increase (see figures 4(m)–(o)). The dissipated power density also strongly depends on the number of harmonics and changes from 3.7 × 10⁶ W m−3 for N = 1 to 1.9 × 10⁷ W m−3 for N = 4. The shape of the time averaged profiles exhibits a strong spatial asymmetry with maxima close to the powered electrode for N = 4 due to the spatially asymmetric electron power absorption dynamics. This result demonstrates that the flux of the specific species can be directed towards one of the electrodes by changing the applied waveform from 'peaks' to 'valleys'.
Figure 8 compares the space and time averaged helium metastable densities to the N2 dissociation rate as a function of the N2 flow for different numbers of driving harmonics, N, for 'peaks'-waveforms. The N2 dissociation rate has a weaker dependence on the flow rate of N2 compared to the helium metastable density. Note that convergence of the simulation could not be achieved for all combinations of the nitrogen flow and N under these discharge conditions. For  4, the averaged dissociation rate depends only weakly on the nitrogen flow rate. A similar behaviour was observed for the measured density of atomic nitrogen in a single frequency μ-APPJ [92]. At a low nitrogen admixture, electrons more efficiently cause the population of higher helium excited states than dissociating N2 molecules. As figure 4 indicates, the high energy tail of the EEPF is enhanced, when N is increased and, thus, a 23 times higher helium metastable density can be reached for N = 4 compared to N = 1, while the dissociation rate of N2 changes only by a factor of 8. By increasing the nitrogen content the dissociation processes become more efficient at a given electron energy due to the presence of more collision partners, but at the same time the electron density decreases (see section 3.3). These two processes compensate each other partially, i.e. the N2 dissociation depends only weakly on the flow of molecular nitrogen. Meanwhile adding more molecular nitrogen to the discharge causes the helium metastable density to decrease due to enhanced Penning ionization and changes of the EEPF, i.e. changing the N2 flow predominantly changes the helium metastable density, while the generation of atomic nitrogen remains approximately constant. In order to control the atomic nitrogen generation at constant helium metastable density, N and the atomic nitrogen flow must be changed simultaneously. For instance, increasing N from 1 to 4, while increasing the nitrogen flow from 1sccm to 4 sccm leaves the helium metastable density approximately constant, but induces a change of the N2 dissociation by approximately one order of magnitude. In these ways, the helium metastable density can be controlled separately from the atomic nitrogen generation.

Figure 8. Space and time averaged values of the helium metastable density and the electron impact dissociation rate of N2 molecules obtained from the PIC/MCC simulations for different numbers of driving harmonics, N, and molecular nitrogen admixtures for 'peaks'-voltage waveform with a peak-to-peak voltage of 400 V. The powered electrode is located at x = 0, while the grounded electrode is at x = 1 mm. The base frequency is f = 13.56 MHz.
Download figure:
Standard image High-resolution image
4. Conclusions
We studied the effects of VWT on capacitively coupled μ-APPJs based on a synergistic combination of experiments, PIC/MCC simulations, and analytical modeling. By using 'peaks'- and 'valleys'-waveforms constructed based on up to 4 consecutive harmonics of 13.56 MHz at a fixed peak-to-peak voltage, we found that changing the number of consecutive harmonics, N, and the admixture of N2 to the helium gas strongly affect the DC self-bias generation and the spatio-temporal dynamics of energetic electrons. The absolute value of the DC self-bias was found to increase with increasing N and to decrease with increasing reactive gas admixture. Based on an excellent agreement between measured, simulated, and modelled values of the DC self-bias, we found these trends to be caused by (i) an increased amplitude asymmetry of the driving voltage waveform induced by adding more harmonics and (ii) changes of the spatio-temporal dynamics of energetic electrons. Adding more harmonics, while using a 'peaks'-waveform causes a short sheath collapse at only one (the powered) electrode. In order to compensate the positive ion flux to this electrode in the presence of a highly collisional regime at atmospheric pressure, a strong electric field is generated to drive a high electron current to this electrode during the local sheath collapse. This causes a strong acceleration of electrons and strong electron power absorption/excitation/ionization only in the vicinity of this electrode. This breaks the symmetry of the spatio-temporal electron dynamics, which is inherent to single frequency μ-APPJs. This break of symmetry causes a self-attenuation of the EAE at atmospheric compared to low pressures CCPs, where a much stronger DC self bias is generated by using 'peaks'-waveforms. Increasing the reactive gas admixtures leads to an even higher collisionality and results in a further reduction of the DC self-bias due to higher bulk voltages and stronger electric fields at one of the electrodes, where the sheath collapses shortly.
The break of the symmetry in space and time of the spatio-temporal electron power absorption dynamics was observed experimentally and by the PIC/MCC simulation. Based on an excellent agreement between both approaches, we demonstrated that this asymmetry can be controlled by tuning the number of driving harmonics and the admixture of N2. In case of a strong asymmetry induced by VWT, the high energy tail of the EEPF is strongly enhanced adjacent to the electrode, where the sheath collapses for a short time interval, during the local sheath collapse. Based on this EEPF control via VWT the generation of helium metastables and atomic nitrogen can be strongly enhanced by more than one order of magnitude. Moreover, the spatial symmetry of the resulting heavy particle density profiles can be broken and controlled via VWT, e.g. a higher metastable density adjacent to one compared to the other electrode can be realized. In this way, VWT allows to control the electron driven plasma chemistry, and to access regimes, that have been inaccessible by increasing the driving voltage amplitude/power in single frequency μ-APPJs before, since these plasmas enter a constricted mode at high voltages/powers.
Our results demonstrate the potential of VWT for process control in μ-APPJs in an exemplary scenario. We expect the enhanced generation of helium metastables and atomic nitrogen to be highly relevant for various applications, e.g. biomedical applications. Clearly, there is a variety of other process relevant discharge conditions and ways to control such microplasmas by VWT, that need to be explored in the future.
Acknowledgments
This work is supported by the DFG via SFB 1316 (project A4), by the Hungarian Office for Research, Development, and Innovation NKFIH grants 119357 and 115805, by the US NSF grant PHY 1601080, as well as the UK EPSRC grant EP/K018388/1.